

| Journal of Neurology Research, ISSN 1923-2845 print, 1923-2853 online, Open Access |
| Article copyright, the authors; Journal compilation copyright, J Neurol Res and Elmer Press Inc |
| Journal website http://www.neurores.org |
Original Article
Volume 1, Number 5, December 2011, pages 177-189
Severe Hypoxia: Consequences to Neural Stem Cells and Neurons
Hady Felflya, Alexander C. Zambonb, Jin Xuea, Alysson Muotria, c, Dan Zhoua, Evan Y. Snydera, d, Gabriel G. Haddada, e, f, g
aDepartments of Pediatrics, University of California San Diego, School of Medicine, USA
bDepartments of Pharmacology, University of California San Diego, School of Medicine, USA
cDepartments of Cellular and Molecular Medicine, University of California San Diego, School of Medicine, USA
dSanford-Burnham Medical Research Institute, La Jolla, CA 92037, USA
eDepartments of Neuroscience, University of California San Diego, School of Medicine, USA
fRady Children’s Hospital-San Diego, USA
gCorresponding author: Gabriel G. Haddad, University of California San Diego, School of Medicine, 9500 Gilman Dr, La Jolla, California 92093-0735, USA
Manuscript accepted for publication December 9, 2011
Short title: NSCs and Neurons in Hypoxia
doi: https://doi.org/10.4021/jnr70w
| Abstract | ▴Top |
Background: Multiple neurological diseases result from a pathological hypoxia in the brain, resulting in various motor, sensory or cognitive sequelae. Understanding the response of neural stem cells (NSCs) and differentiated neurons to hypoxia will help better treat such diseases.
Methods: We exposed mouse embryonic primary neurons (PN) and neural stem cells to 1% O2 in vitro.
Results: Both cell types survived and retained their immunocytochemical markers, and neurons showed no obvious morphological changes. Microarray analysis showed that the number of genes with significantly altered expression levels was almost five-fold higher in NSCs compared to PN. NSCs displayed a clear block in G1/S phase of the cell cycle and a number of down-regulated cytokine genes. Various growth factors (e.g. neural growth factor, prolactin), involved in survival and proliferation, genes of the Notch pathway, and genes involved in glial differentiation, and cell-matrix adhesion were up-regulated. PN displayed a down-regulation of a number of genes involved in neuron-specific functions, in particular, transmitter-related (e.g. synaptic transmission, neurotransmitter transport and release, learning, adult behavior).
Conclusions: We conclude that hypoxia 1-down-regulates genes involved in multiple neuronal functions which can negatively impact learning and memory; 2-induces a cell cycle block in NSCs; 3-can precondition NSC towards a particular differentiation potential while maintaining them fully undifferentiated.
Keywords: Hypoxia; Neural stem cells; Cell cycle; Primary neuron; Neurotransmitter; Neuronal function
| Introduction | ▴Top |
Neural stem cells (NSCs) are first generated during embryonic gastrulation and then persist throughout the mammalian lifespan to help preserve equipoise in the face of perturbations [1]. The division and differentiation of these endogenous NSCs is regulated by both physiological stimuli and pathological conditions [2]. Most tissue culture protocols maintain NSCs at an oxygen tension that is equivalent to that of room air at sea level - 21% O2. However, the natural in vivo environment where NSCs reside at various stages of life is actually hypoxic relative to atmospheric oxygen levels. Placental development [3], rat embryo at 9.5 days post coitum [4], human embryo [5] and interstitial tissues [6, 7, 8] are examples of tissues with low O2.Oxygen levels have been shown to vary by brain regions too [9]. These data demonstrate that the embryonic, fetal, and adult brain tissues naturally exist in a relatively hypoxic environment [10].
Understanding the response of NSC and neurons to pathological hypoxia first requires profiling the expression pattern of key genes under hypoxic versus normoxic conditions (relative to room air) using a population of NSCs and neurons Therefore, for this study, we performed microarray analysis on a clone of NSCs that could be efficiently grown as essentially homogeneous monolayers in quantities sufficiently large and healthy to ensure reproducible patterns of growth and differentiation, making comparisons between cultures feasible while eliminating confounders such as variability in migration, differentiation, cell number, and survival. These NSCs were compared to neurons obtained from the same strain for their response to hypoxia.
Our data suggested that, while both NSC and neurons tolerate 1% O2well, primary neurons exhibited a suppression of genes involved in neuronal-specific functions (e.g. neuron differentiation, neurotransmitter transport, synaptic transmission, and learning), while NSCs exhibited down-regulation of many inflammatory genes (e.g. interferons and tumor necrosis factors) and an up-regulation of multiple growth factors. The expression pattern of genes involved in cell cycle control suggested a tendency not to proceed from G1 to S, which correlated with a clear G1/S block.
| Materials and Methods | ▴Top |
Murine NSCs (mNSCs)
We began the study using a stable, clonal population of dependably engraftable lacZ-expressing mNSCs taken from a well-characterized clone, C17.2, because its enhanced yet constitutively self-regulated expression of stemness genes [11, 12] permits its cells to be efficiently grown in sufficiently large, homogenous, and viable quantities to ensure reproducible patterns of growth and integration. The mNSCs were cultured and passaged as previously described [11, 12]. The C17.2 line was graciously provided by Dr Evan Snyder.
Primary embryonic neuronal culture
C57BL/6J female mice were obtained from the Jackson Laboratories with timed pregnancy (Jackson Laboratories, Bar Harbor, ME, USA). Embryos were extracted at embryonic day (E) 17, cortexes were incubated with 0.25% trypsin (Gibco) then triturated, centrifuged and pellets resuspended in plating medium consisting of Neurobasal Medium (Gibco), B27 1X final (Gibco), Glutamine 500 µM (Gibco), penicillin/streptomycin 100 U/ml and 100 µg/ml respectively (Gibco), and glutamic acid 25 µM (Sigma), 1ml of 106 cells/ml suspension was added onto a 35 mm plate previously coated with Poly-D-Lysine > 300 KDa (Sigma) at 0.15 mg/ml, and cultured in 5% CO2 at 37 °C (day 0). After 24 h (day 1), 1ml plating medium was added. Then every 4 days, 1ml of the plating medium was replaced with an equal volume of maintaining medium (same composition as plating medium without glutamic acid). Cells were grown for 6 days before experimental use.
Hypoxia studies
To study the effect of hypoxia on NSC and primary neurons (PN), 1% O2 was used with 5% CO2 and 37 °C. Unless otherwise indicated, all cells used were incubated in normoxia for a certain time, then transferred to hypoxia, while controls were maintained in parallel at 21% O2. Cells were incubated in normoxia (2 days for NSCs, until they reach ∼ 20% confluency; 6 days for PN), then transferred to the 1% O2incubator for 2 days, while control counterparts were maintained in normoxia all the duration (total 4 days for NSCs, 8 days for PN). Unless otherwise indicated, gene expression studies and immunocytochemistry analyses were performed on cells after 2 days in 1% O2, as well as on the normoxic counterparts.
Phase contrast microscopy and cell death
Using phase contrast microscopy, the morphology of all cultured cells was monitored, and cell death was assessed by propidium iodide staining (5 µg/µl) (Sigma). Images were acquired with Zeiss microscope with AxioCam MRm camera (Zeiss) using the Axiovision Rel 4.5 software.
Immunocytochemistry (ICC) staining
ICC was performed on NSC and primary neurons to detect the neural stem cell marker Nestin, the neuronal marker MAP2, and late neuronal marker NeuN using unlabelled primary antibodies and fluorescent secondary antibodies (Chemicon). Briefly, cells were fixed, permeabilized, blocked, then incubated with primary antibodies at 4 °Covernight, followed by secondary antibodies for 2.5 h at RT. DAPI was added and cells observed under fluorescent microscope (Zeiss). Images were acquired with AxioCan MRm camera (Zeiss) using the Axiovision Rel 4.5 software. Magnifications used were × 100 and × 400.
Analysis of neural stem cell division and cell cycle
To quantify NSC division, pulse-chase BrdU incorporation experiment was performed followed by flow cytometry to detect BrdU+ cells and DNA content, using EZ-BrdU kit (Phoenix Flow Systems) according to the manufacturer recommendations, with a 20 min BrdU pulse, and 2 h and 4 h chase. Nine independent BrdU incorporation experiments were performed. BrdU+ cells and DNA content were assessed for each time point using CellQuest Pro Software. Cell proliferation was also assessed using total cell counts.
Protein quantification
Proteins were extracted using HEPES buffer and 30 µg protein per sample were loaded on gel. Membranes were probed for MAP2, NeuN, Nestin, actin (Chemicon), then incubated with HRP-conjugated secondary antibodies (ZYMED).
Microarray analysis
Total RNA was extracted from NSC and PN, (n = 3 each) using the RNeasy kit (Qiagen) according to the manufacturer instructions. Spectrophotometer readings were taken with the NanoDrop ND-1000. The RNA integrity was checked with the Agilent 2100 BioAnalyzer system (Agilent Technologies, Santa Clara, CA). Sample processing for microarray data collection was performed as previously described [13].
For analysis, intensities were normalized using “modified LOESS” as previously described [14]. Pairwise fold changes were computed for the hypoxia and normoxia cultured primary neurons and NSCs. Genes with a fold change > 2 and P < 0.05 were considered significant and comparison groups were annotated with statistically significant GeneOntology term overrepresentation using the MappFinder algorithm and GO-Elite software packages [15]. Functional categorization of gene alterations was created with Ingenuity Pathway Analysis (IPA) program (Ingenuity Systems, Redwood city, CA) [13]. The P-value for each network or function was calculated with a right-tailed Fisher’s exact test. The score for each network of function was shown as – log10 (P value), which indicates the likelihood of finding a set of focus genes in the network or function by random chance. The significance threshold was set to a score of 1.3 (i.e. P ≤ 0.05). All microarray data is MIAME compliant and the raw data has been deposited in the Gene Expression Ominibus database at http://www.ncbi.nlm.nih.gov/geo and can be retrieved using access number GSE24131.
Research Ethics
The experimentations requiring animal use were submitted to the Institutional Animal Care and Use Committee (IACUC) at the University of California San Diego (UCSD) and approval was obtained (S05534).
Statistical analysis
Statistical analysis was performed using the Student T-test available from Microsoft Excel software. Values were considered significant for P ≤ 0.05.
| Results | ▴Top |
Survival of NSCs and primary neurons under hypoxic vs. normoxic conditions
All NSCs expressed the stem cell marker Nestin (Fig. 1A, c) in normoxia, and expressed no mature neuronal markers, e.g., MAP2 (Fig. 1A, a, k) and NeuN (Fig. 1A, b, k) and showed little cell death (Fig. 1A, h). When NSCs were transferred to 1% O2, the expression profiles of Nestin, MAP2 and NeuN were similar to those in normoxia (Fig. 1B, e, f). Interestingly, NSCs tolerated well the 1% O2 for 2 days and there was no increase in cell death (Fig. 1B, i). Western blot confirmed the absence of MAP2 and NeuN and showed similar levels of Nestin in normoxia and 1% O2 (Fig. 1A, k).
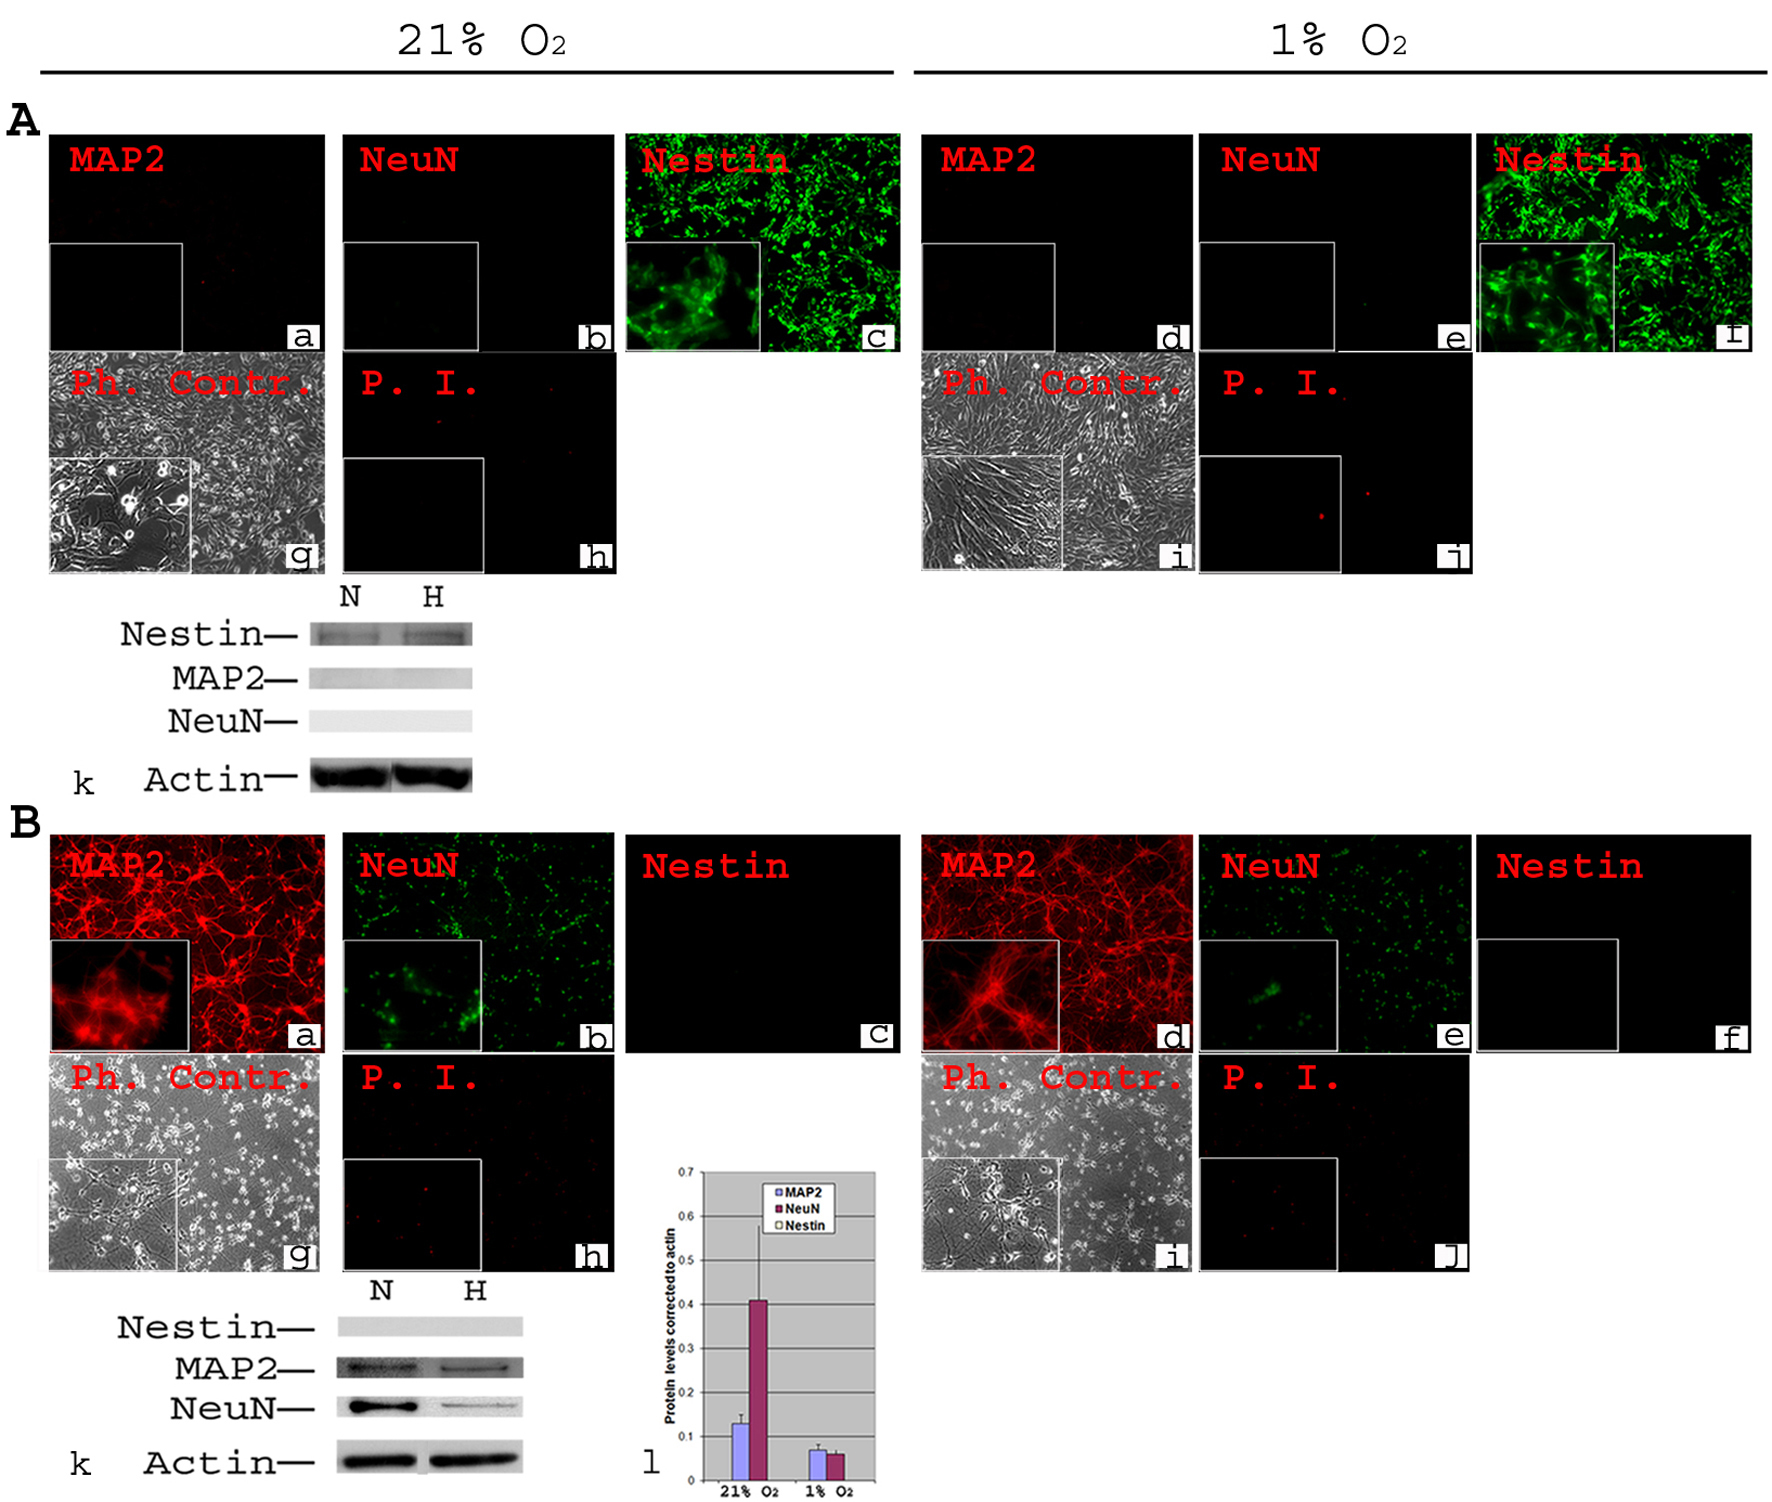 Click for large image | Figure 1. Phenotypic characterization of C17.2 NSCs and PN in 21% O2 and 1% O2. A-NSCs were cultured either in normoxia for 4 days (a, b, c, g, h) or in normoxia for 2 days then transferred to 1% O2 for 2 days (d, e, f, i, j). Cells were stained using antibodies directed against mouse stem cell marker Nestin and neuronal markers MAP2 and NeuN (a-f). Under both normoxia and hypoxia, all cells expressed nestin (c, f), but there was no detectable MAP2 or NeuN (a, b, d, e). Phase contrast (Ph. Contr.) microscopy shows the cells in normoxia (g) and 1% O2 (i). Propidium Iodide (P.I.) staining revealed a very low cell death similarly in normoxia (h) and 1% O2 (j). Magnification × 100; inset × 400. Western blot analysis confirmed the absence of MAP2 and NeuN from NSCs, and the presence of equivalent amounts of nestin in normoxia (N) and hypoxia (H, 1% O2) (k); B-Primary neurons were cultured form Embryonic (E) day 17 of mouse cortex in normoxia for 8 days (a, b, c, g, h) or in normoxia for 6 days then transferred to 1% O2 for 2 days (d, e, f, i, j). Immunocytochemistry was performed for Nestin, MAP2 and NeuN. There was a complete absence of Nestin both in normoxia (c) and 1% O2 (f). MAP2 and NeuN were detected in all cells both in normoxia (a, b) and 1% O2 (d, e). Phase contrast (Ph. Contr.) microscopy revealed typical neuronal shape with processes and synapses both in normoxia (g) and 1% O2 (i). PI staining showed a comparable cell death between normoxia (h) and 1% O2 (j). Magnification × 100; inset × 400. Western blot confirmed the absence of Nestin, and the presence of MAP2 and NeuN (k). Quantifications revealed ∼ two-fold decrease in the protein level of MAP2 and a significant (P ≤ 0.05) ∼ five-fold decrease in protein level of NeuN under hypoxia (l). |
Cortical primary neurons (PN) cultured in normoxia for 8 days displayed typical morphology (Fig. 1B, g), little cell death (Fig. 1B, h), and expressed MAP2 and NeuN but not Nestin (Fig. 1B, a, b, c). When incubated for 2 days in hypoxia (days 7 & 8 in culture), PN continued a normal developmental pattern as in normoxia (Fig. 1B, i). They also had equivalent survival (Fig. 1B, j) and a similar pattern of marker gene expression (Fig. 1B, d, e, f). There was, however, a significant (P ≤ 0.05) decrease in NeuN (more than 3-4 fold) and MAP2 (about twice) protein levels at 1% O2 compared to normoxia (Fig. 1B, k, l).
NSCs induced to become more quiescent in hypoxia than in normoxia
A high proliferation rate was observed in NSCs in normoxia, as 45-48% (n = 9) (Fig. 2A) of cells were BrdU+ after a 20 min pulse. In 1% O2, the total percentage of BrdU+ cells was 31 - 43% (n = 9) (Fig. 2A), significantly lower from that in normoxia (P < 0.02 to P < 0.002), indicating that hypoxia is affecting cell cycle, prompting us to perform a more in-depth analysis of cell proliferation rates. Kinetic analysis of cell cycle progression (Fig. 2B, D) showed significantly more BrdU+ cells in G1 (P < 0.04 - 3 ×10⁻⁵) and significantly (P < 0.006) less BrdU+ cells in S phase in hypoxia as compared to normoxia, in 3 independent experiments of n = 3 each, at all time points (Fig. 2D, a-i), concordant with DNA content analysis (Fig. 2C, E). This is consistent with a G1/S block with hypoxia. The percentage of cells in the S phase averaged 45.5 ± 7.7% (n = 9) in normoxia and significantly (P < 0.03) less in hypoxia (average 32.6 ± 12.6%, n = 9).
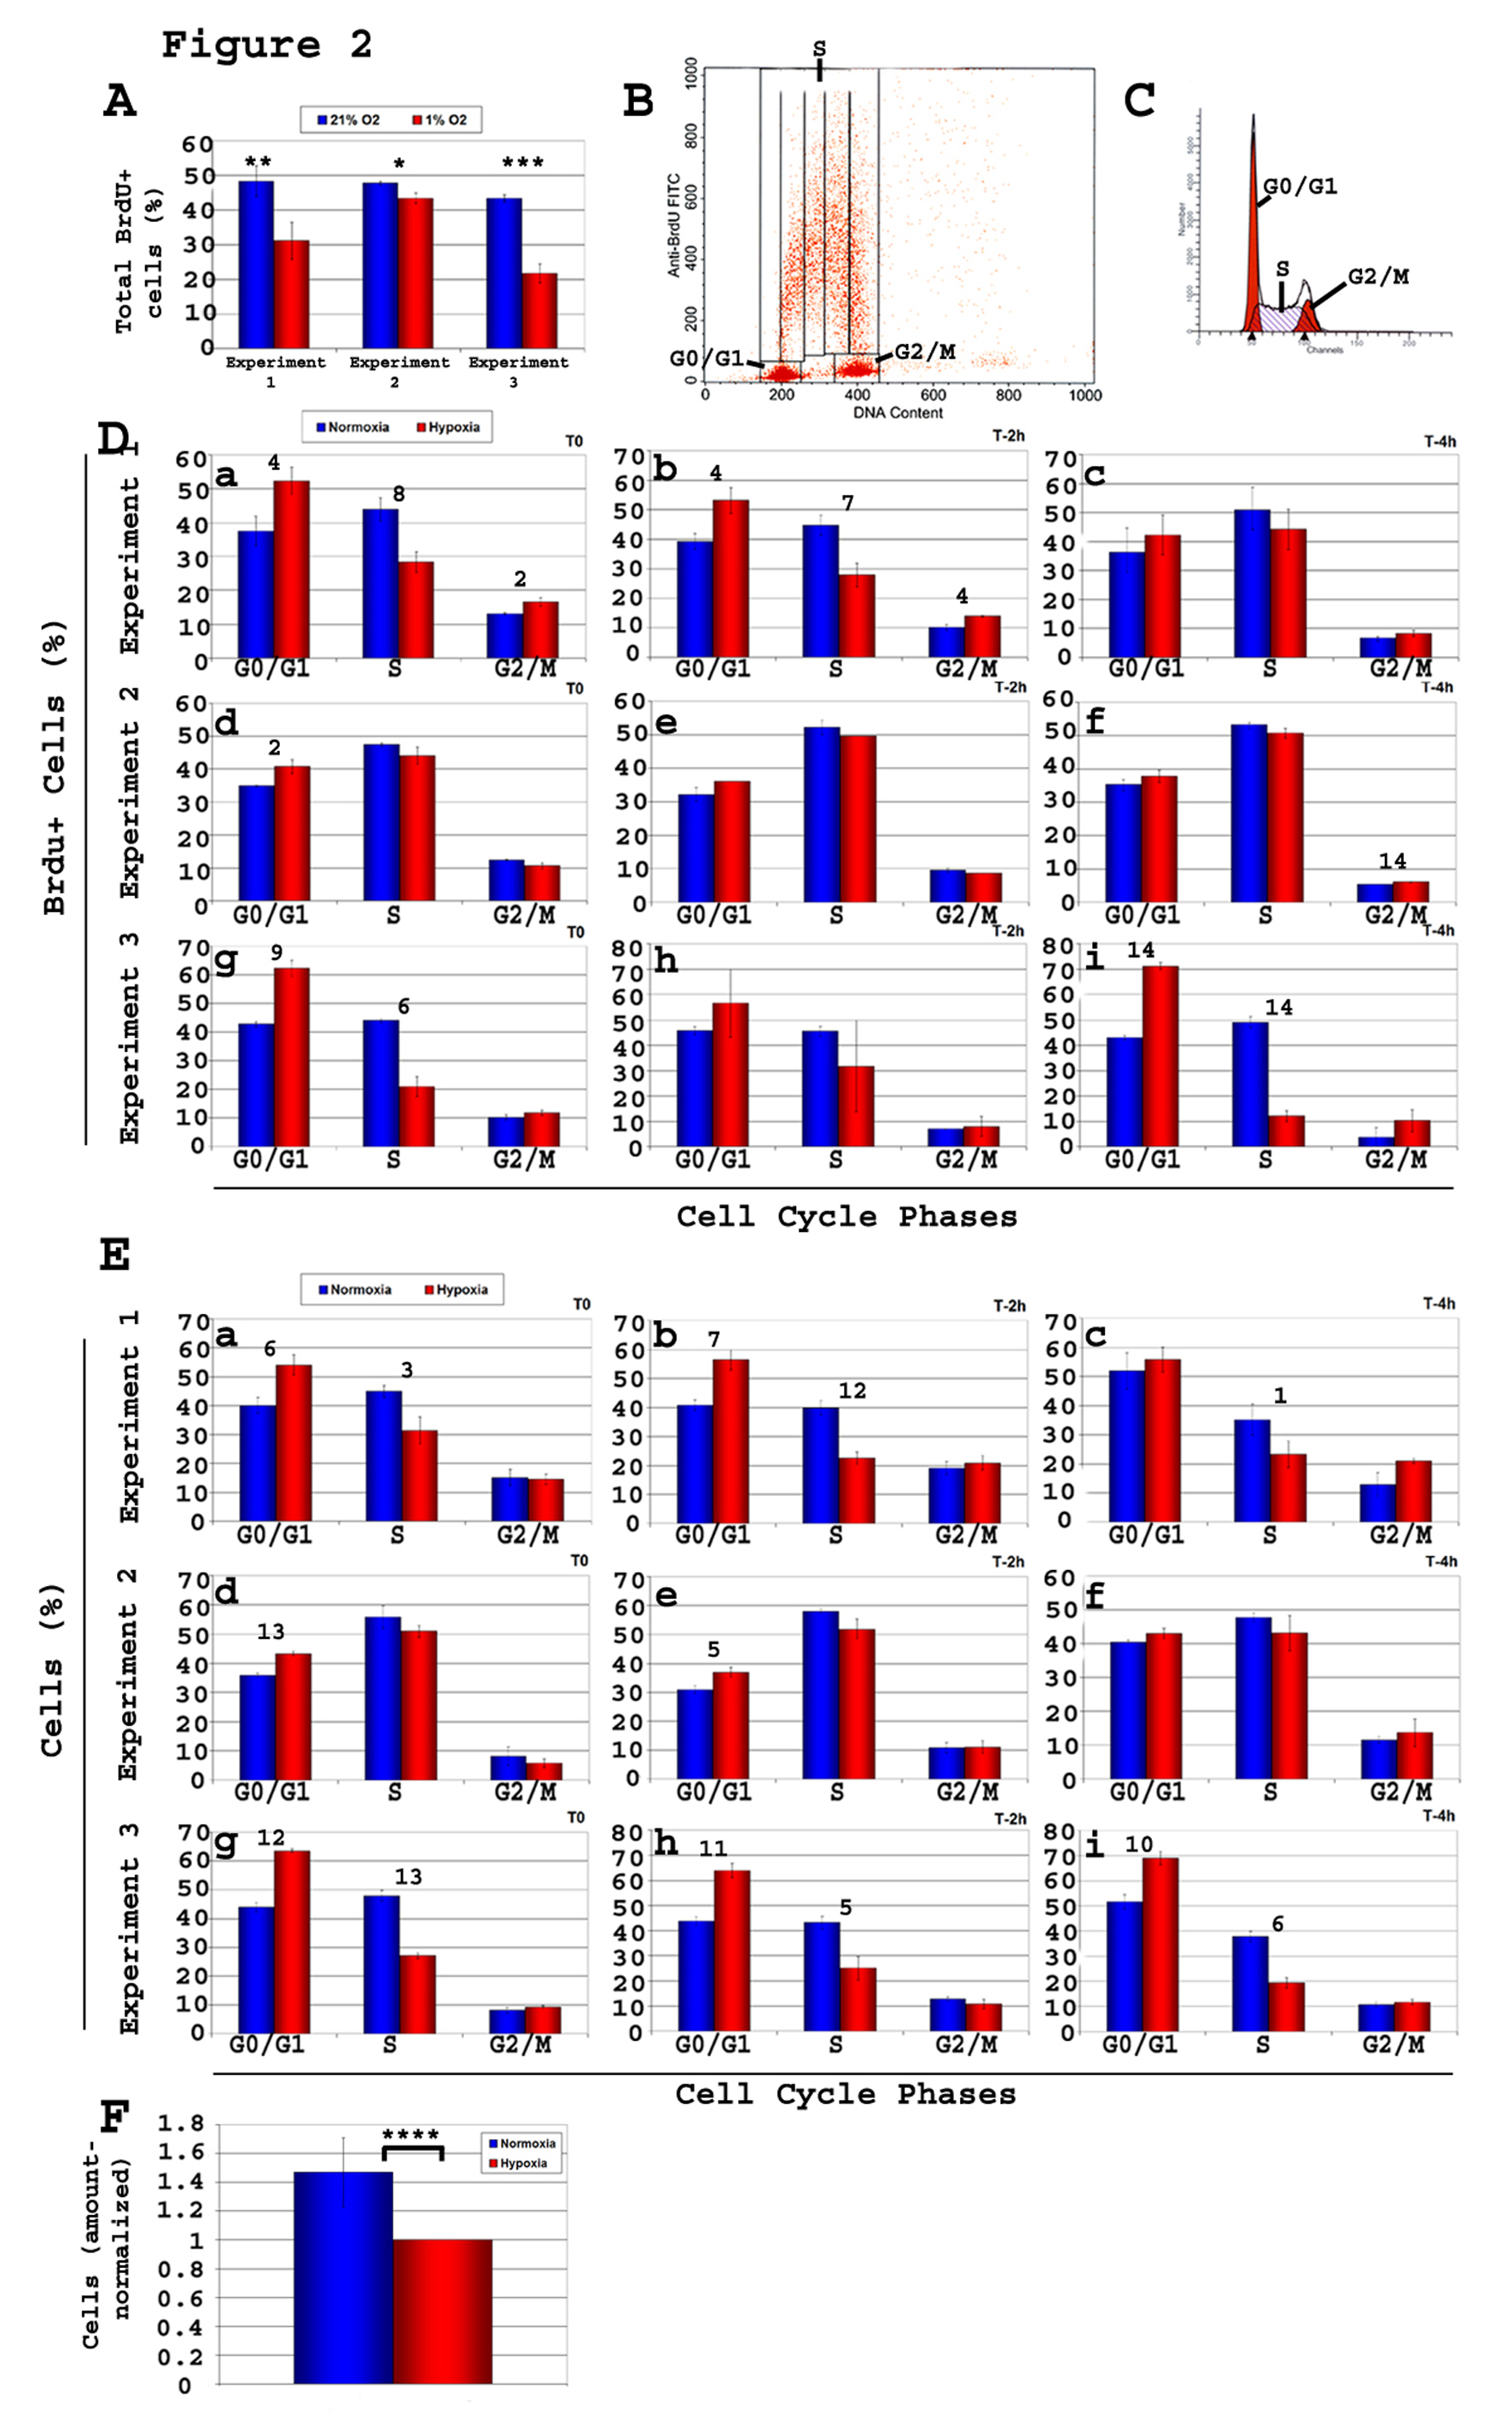 Click for large image | Figure 2. Kinetic analysis of cell cycle of C17.2 neural stem cells (NSCs) C17.2 cells were incubated in either 21% O2 or 1% O2. Brdu pulse of 20 minutes was followed by cell harvest either immediately (T0) or after a chase time of either 2 h or 4 h (T-2 h, T-4 h). Brdu staining and flow cytometry analysis was performed on all samples, and the percentage of Brdu+ cells relative to cell cycle was determined. Shown here are three experiments of n = 3 each (total n = 9). Two types of flow cytometry analyses were performed, one using total cells (Brdu+ and Brdu-), and one gated on the Brdu+ population. A-Total percentage of Brdu+ cells in each of the 3 experiments both in 1% O2 and 21% O2. T-test, normoxia vs. hypoxia: *, P< 0.03; **, P < 0.01; ***, P < 0.002; B-Gates used to calculate the percentage of Brdu+ cells in each of the phases G0/G1, S, and G2/M of the cell cycle; C-Graphics used to calculate the percentage of total cells in the various phases of the cycle (G0/G1, S, G2/M). Values obtained were used to draw the histograms in panel E; D-Brdu+ cells, and their progression in cell cycle phases. Under hypoxia, the percentage of Brdu+cells showed a consistent increase in G1 and a decrease S relative to normoxia showing a clear G1/S block; E-There is a consistent increase in the percentage of cells in G1 and a decrease in S phase, in hypoxia compared to normoxia, as analyzed based on their DNA content; F-Cell counts reflect fewer cells in hypoxia. T-test, value in normoxia vs. hypoxia of same cell cycle phase: Panel A: *, P < 0.03; **, P < 0.02; ***, P < 0.0002. Panels D and E: 1, P < 0.05; 2, P < 0.04; 3, P <0.03; 4, P < 0.02; 5, P < 0.009; 6, P < 0.007; 7, P < 0.006; 8, P < 0.005; 9, P < 0.004; 10, P < 0.003; 11, P < 0.002; 12, P <0.0008; 13, P < 0.0004; 14, P < 3 ×10⁻⁵. Panel F: ****, P <0.03. |
After seeding a similar amount of cells, plates incubated in hypoxia for 2 days showed significantly (P < 10-4) less cells (Fig. 2F) than normoxia counterparts (ratio normoxia-to-hypoxia = 1.48 ± 0.2). Altogether, these data confirm a greater number of quiescent NSCs (i.e. decreased progression into the cell cycle) in 1% compared to 21% O2 attributable to predominantly a G1/S block. Altogether, these data indicate that under hypoxia, NSCs have become more quiescent.
Microarray analysis reveals a major difference between PN and NSCs in response to hypoxia
Under 1% O2, only 210 genes changed more than two-fold (P < 0.05) in PN, but about 5 × more in NSCs (i.e. 1090 genes). In PN and NSCs, most genes were up-regulated (156 genes in PN and 725 genes in NSC (Fig. 3). Through GO analysis, we also found that, in hypoxia, PN had a large array of genes involved in neuronal specific functions that were down-regulated, including adult locomotory and fear/anxiety behavior (atp1a2 [16]) , feeding behavior and cellular response to starvation (Cartpt) [17], behavioral response to coccain, and cerebral cortex development (CDK5) [18, 19], behavioral fear response and memory (Grm7), learning [20], chemotaxis (FGF10), mechanoreceptor differentiation (FGF10, hes5, ntrk2), synaptic transmission (atp1a2, Cartpt, Cdk5, Grm7, Ntrk2), neurotransmitter transport (Atp1a2, Ntrk2, Slc6a11), and neuronal differentiation (Apoe, Cdk5, Fgf10, Hes5, Rtn4rl1) (Table 1, 2, 3). This gene expression profile is consistent with a suppression of neuronal function under hypoxic conditions. There was also up-regulation of genes related to various metabolic processes, including oxidation/reduction, gluconeogenesis, glycolysis, ascorbic acid binding, and lipid biosynthetic process (Table 1, 2), pointing towards a metabolic adaptation; a well-established role for hypoxic gene responses.
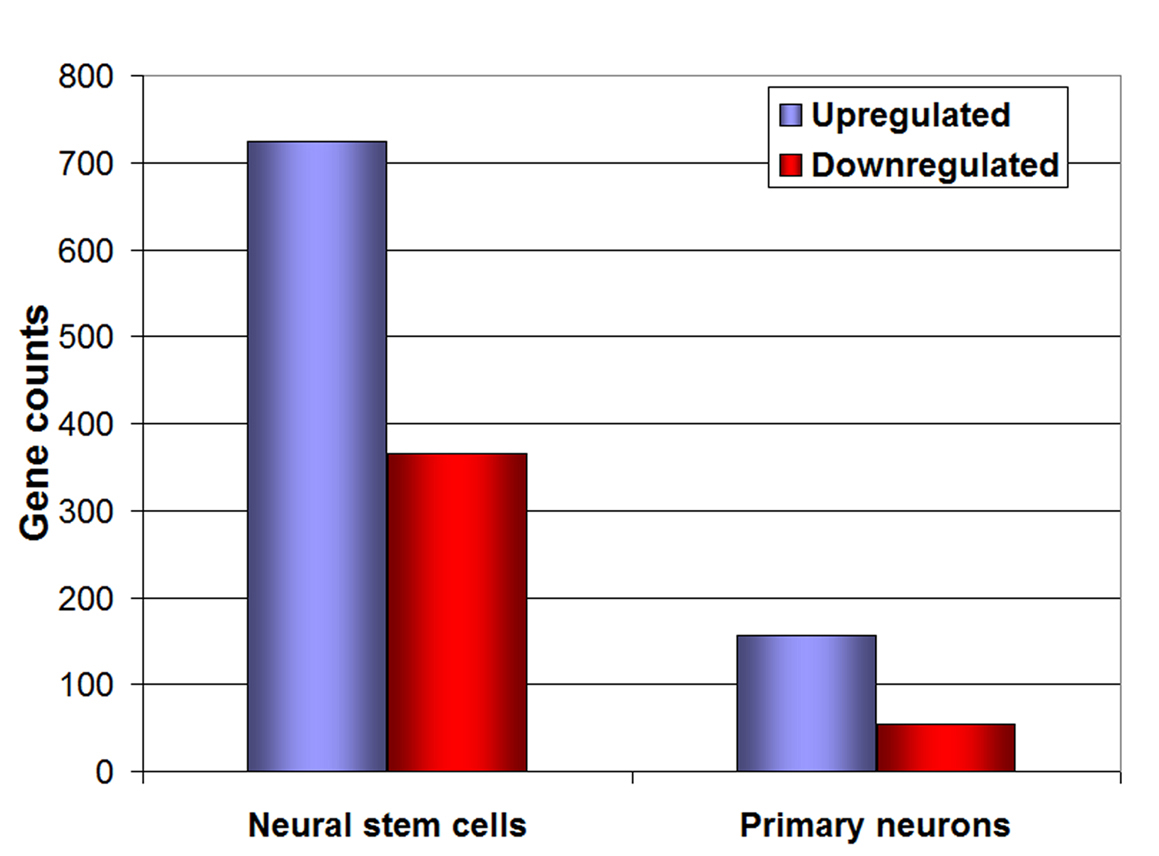 Click for large image | Figure 3. Microarray analysis of neural stem cells and neurons. Representation of the number of genes up-regulated (blue bars) and down-regulated (red bars) under 1% O2, both in neural stem cells and primary embryonic neurons. |
 Click to view | Table 1. Major Cellular Functions With Genes Changed in Primary Neurons at 1% O2 Relative to 21% O2, Down-regulated |
Click to view | Table 2. Major Cellular Functions With Genes Changed in Primary Neurons at 1% O2 Relative to 21% O2, Up-regulated |
Click to view | Table 3. Major Genes With Expression Level Changes Under Hypoxia. Major Neuronal-Specific Functions and the Genes Which are Down-Regulated, in Primary Embryonic Neurons |
NSCs down-regulated, in hypoxia, multiple members of the interferon (IFN) family and tumor necrosis factors (TNF) (Table 4, 5). They displayed an up-regulation of multiple growth factors, such as insulin, VEGF, NGF, prolactin, GH-Rc (data available at the Ominibus database, materials & methods), factors involved in cell survival and proliferation. They also up-regulated genes involved in glial cell differentiation and Notch signaling pathway (data not shown). Furthermore, there was an up-regulation of genes involved in cellular component assembly (Fn1, Itga5, Lox), cell-matrix adhesion genes (Bcl6, csf1, Pik3cb), cytoplasm organization and biogenesis (Fn1, Itga5, Tcfcp2l1), and genes involved in positive regulation of cell motility (Bcl6, Csf1, Hbegf, Irs2, Prl2c2, Rras2).
Click to view | Table 4. Major Cellular Functions With Genes Changed in Neural Stem Cells at 1% O2 Relative to 21% O2, Down-Regulated |
Click to view | Table 5. Major Cellular Functions With Genes Changed in Neural Stem Cells at 1% O2 Relative to 21% O2, Up-Regulated |
Significant changes in transcript levels of genes affecting many functions in PN and NSCs were also detected through gene categorization using the Ingenuity Pathway Analysis (IPA) software (data not shown). Since the NSC cultures showed a cell cycle block and a change in morphology, genes involved in these two functions were among the genes we focused our attention on. There was a significant change in expression levels of genes involved in favoring G1/S arrest, such as up-regulation of GADD45B and GADD45G and down-regulation of E2F (Table 6). There were also changes in expression levels of genes involved in cytoskeletal remodeling, such as biogenesis of cytoskeleton, depolymerization of microtubules, formation of actin stress fibers, formation of lamellopodia (Table 7), the combination of which can be associated with change in proliferative status.
Click to view | Table 6. Major Genes With Expression Level Changes Under Hypoxia. Changes in Expression Level of Genes Involved in Cell Cycle Block in NSCs |
Click to view | Table 7. Major Genes With Expression Level Changes Under Hypoxia. Changes in Expression Levels of Genes Involved in Cytoskeleton Rearrangements in NSCs |
Detailed analysis of PN expression profile using the IPA software also showed changes in expression levels of multiple genes. These changes, based on the IPA database, favor neuro-degeneration, correlating with the GO analysis.
| Discussion | ▴Top |
In this study, our goal was to investigate the effect of hypoxia on gene expression of NSCs and primary neurons to gain more insight about their response to hypoxia. We have shown that hypoxia: a) down-regulates genes involved in multiple neuronal functions, includingneuron differentiation, neurotransmitter transport, synaptic transmission, and learning b) affects cell cycle progression of neural stem cells, c) up-regulates genes involved in glial cell differentiation and Notch pathway in NSCs, d) up-regulates many growth factors and IFN and TNF in NSCs.
To start with we can deduce from the microarray data how PN adapt, at least in part, to a hypoxic stress: neurons did not die after 2-day exposure to 1% O2, yet, we see for the first time that they down-regulated a large array of genes involved in various neuronal functions (Table 1, 2, 3), a change that can impact the physiology of neurons at a cellular level, and can potentially have a broad effect on brain functioning in an in vivo setting.
Most of the functions affected by these gene expression changes (such as learning, memory, synaptic transmission, neurotransmitter transport) are related to neurotransmitter biology. These findings point towards a hypoxia-induced neurotransmitter physiology alterations. We thus speculate that hypoxia can negatively affect learning and memory, and induce anorexia, by down-regulation of molecules involved in transport and release of neurotransmitters (Fig. 4A). Hypoxia has been previously known to impair learning and memory [21, 22], as well as body weight [23, 24], and our study thus provides potential mechanisms for these phenotypic changes.
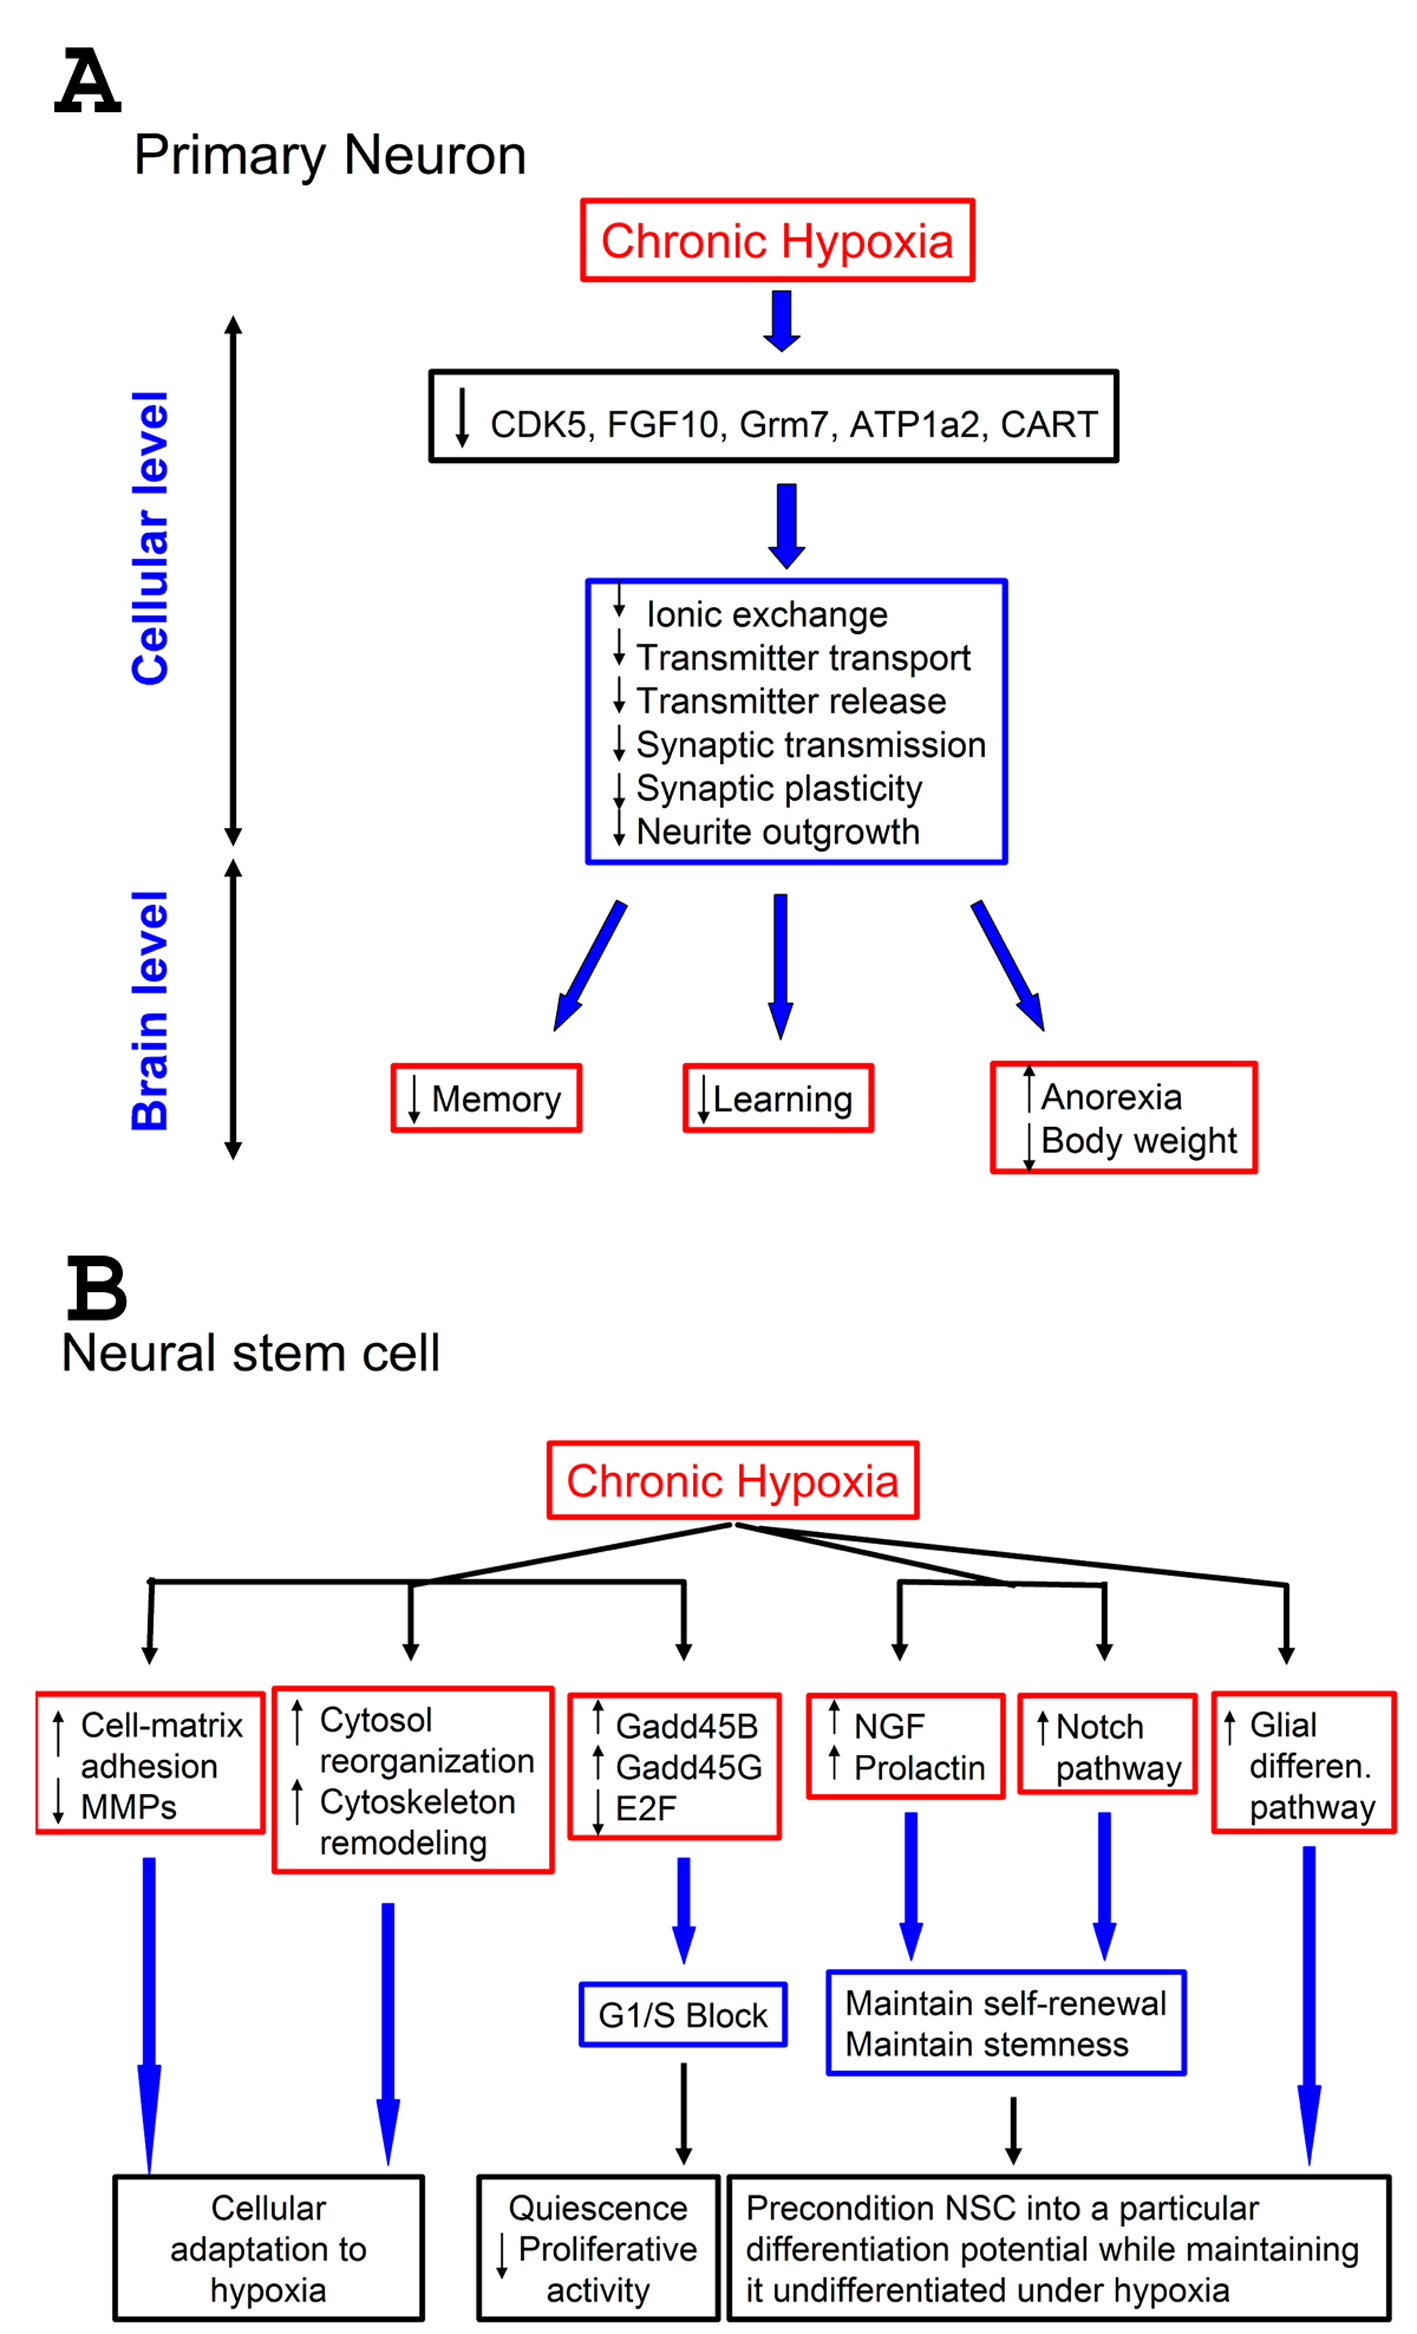 Click for large image | Figure 4. Effect of hypoxia on neurons and neural stem cells: a proposed model. A-Effect of hypoxia on neurons. A low (1%) level of oxygen for prolonged periods down-regulates certain genes that control pathways important for neuronal physiology. This results in suppression of neuronal functions at cellular level related to neurotransmitter processes, such as transmitter transport and release, and synaptic transmission. This suppression can negatively impact vital brain functions that depend on proper neurotransmission, such as memory and learning. Since some pathways (CART) are involved in controlling appetite, this suppression also results in anorexia, leading to weight loss; B-Effect of hypoxia on neural stem cells (NSCs). Prolonged exposure of NSCs to 1% O2 up-regulates cell-matrix adhesion molecules and down-regulates matrix metallo-proteases (MMPs). It also up-regulates genes involved in cytoskeleton remodeling, and causes changes in cell-cycle components resulting in G1/S block. Furthermore, hypoxia up-regulates some growth factors (NGF, neural growth factor, and prolactin), known to stimulate survival, and the Notch pathways as well. Also genes responsible for glial differentiation were up-regulated. Combined, these changes help maintaining the self-renewal of NSCs under hypoxia, keep them undifferentiated but pre-condition them into a particular differentiation potential. |
When NSCs were exposed to 1% O2 for 2 days, they displayed a predominantly clear G1/S block (Fig. 2C, D). It is known that most stem cells enter quiescence in their natural environment. Under hypoxia, the NSCs might therefore be acting like stem cells do in their natural niche.This was demonstrated by 3 different experimental approaches: 1) total DNA content showing more cells in G1 and less cells in S phase under hypoxia; 2) pulse-chase BrdU labeling coupled to cell cycle which showed the same result; 3) microarray data showing up-regulation of genes involved in DNA damage-induced cell cycle arrest (Gadd45B, Gadd45G) [25], and down-regulation of a transcription factor needed for the G1-to-S transition (E2F) [26]. These data demonstrate that cell G1/S block is a mechanism through which hypoxia decelerates cell division. However, we cannot exclude the possibility that there are other mechanisms operating in parallel to decelerate cell division in hypoxia (Fig. 4B).
Previous studies related to cell cycle of various stem cells, including neural stem cells, have indicated that hypoxia can either decelerate or accelerate the cell cycle, based on cell type, level of oxygen, and culture conditions. [18, 27, 28, 10, 29, 30], providing evidence that every stem cell line of any particular stem cell type can react differently to hypoxia. Here we show that CNS NSCs mitosis is negatively regulated by 1% O2 hypoxia.
The GO analysis showed an up-regulation of genes of the Notch pathway which is known to maintain the undifferentiated stem cell phenotype [31]. It has been shown that under hypoxia, HIF1-alpha interacts with activated Notch to repress terminal differentiation in NSCs [31]. This is concordant with the lack of spontaneous differentiation of NSCs in our study (Fig. 1A, Fig. 4B).
Finally, we have shown that under hypoxia, NSCs have up-regulated many growth factors and down-regulated IFN and TNF. This finding complements a recent study demonstrating that IFN-γ promotes the entry of hematopoietic stem cells into cell cycle [32]. Hence, the down-regulation of IFN in NSC would imply that their down-regulation correlates with decreased cell cycling or entry into quiescence. Altogether, these findings point to a global effect of hypoxia on NSC: a decrease in proliferation and promotion of quiescence, and maintenance of self-renewal/stemness, metabolic/cellular adaptation to hypoxia (Fig. 4B).
In summary, our study has revealed for the first time that hypoxia suppresses the expression of genes involved in neuronal processes in primary neurons. It also showed that this suppression is not associated with cell death since cell viability was similar between normoxia and hypoxia. We also showed that hypoxia supports the maintenance of NSCs in an undifferentiated and quiescent state, actually preserving their health, while more differentiated, primary neurons may have their function inhibited, slowed down, or even impaired under hypoxic conditions that persist for more than a few hours.
Acknowledgments
We are thankful to Shirley Reynolds for excellent laboratory management and assistance, and to Dennis Young for the flow cytometry acquisition and analysis. We also thank James Prague, Mila Angert and Roman Sassik for performing the microarray experiments and pathway analysis.
Grants
This work was supported by the National Institutes of Health [P01HD032573] to GGH and the American Heart Association Scientist Development [10SDG2630130] and NIH IRACDA [GM068524] grants to ACZ, NIH [1-DP2-OD006495-01] to ARM, a Parker B. Francis Fellowship grant to JX, and an American Heart Association grant 0835188N to DZ.
Disclosures
The authors declare that they have no conflict of interest.
| References | ▴Top |
- Kennea NL, Mehmet H. Neural stem cells. J Pathol. 2002;197(4):536-550.
pubmed doi - Kokaia Z, Lindvall O. Neurogenesis after ischaemic brain insults. Curr Opin Neurobiol. 2003;13(1):127-132.
pubmed doi - Genbacev O. To proliferate or to divide - to be or not to be. Early Pregnancy. 2001;5(1):63-64.
pubmed - Mitchell JA, Yochim JM. Intrauterine oxygen tension during the estrous cycle in the rat: its relation to uterine respiration and vascular activity. Endocrinology. 1968;83(4):701-705.
pubmed doi - Rodesch F, Simon P, Donner C, Jauniaux E. Oxygen measurements in endometrial and trophoblastic tissues during early pregnancy. Obstet Gynecol. 1992;80(2):283-285.
pubmed - Goda F, O'Hara JA, Liu KJ, Rhodes ES, Dunn JF, Swartz HM.Comparisons of measurements of pO2 in tissue in vivo by EPR oximetry and microelectrodes. Adv Exp Med Biol. 1997;411:543-549.
pubmed - Liu KJ, Hoopes PJ, Rolett EL, Beerle BJ, Azzawi A, Goda F, Dunn JF, et al. Effect of anesthesia on cerebral tissue oxygen and cardiopulmonary parameters in rats. Adv Exp Med Biol. 1997;411:33-39.
pubmed - Tammela O, Song D, Olano M, Delivoria-Papadopoulos M, Wilson DF, Pastuszko A. Response of cortical oxygen and striatal extracellular dopamine to metabolic acidosis in newborn piglets. Adv Exp Med Biol. 1997;411:103-112.
pubmed - Silver I, Erecinska M Oxygen and ion concentrations in normoxic and hypoxic brain cells. Adv. Exp. Med. Biol. 1988, 454:7-16.
- Morrison SJ, Csete M, Groves AK, Melega W, Wold B, Anderson DJ. Culture in reduced levels of oxygen promotes clonogenic sympathoadrenal differentiation by isolated neural crest stem cells. J Neurosci. 2000;20(19):7370-7376.
pubmed - Parker MA, Anderson JK, Corliss DA, Abraria VE, Sidman RL, Park KI, Teng YD, et al. Expression profile of an operationally-defined neural stem cell clone. Exp Neurol. 2005;194(2):320-332.
pubmed doi - Snyder EY, Deitcher DL, Walsh C, Arnold-Aldea S, Hartwieg EA, Cepko CL. Multipotent neural cell lines can engraft and participate in development of mouse cerebellum. Cell. 1992;68(1):33-51.
pubmed doi - Xue J, Mraiche F, Zhou D, Karmazyn M, Oka T, Fliegel L, Haddad GG. Elevated myocardial Na+/H+ exchanger isoform 1 activity elicits gene expression that leads to cardiac hypertrophy. Physiol Genomics. 2010;42(3):374-383.
pubmed doi - Sasik R, Woelk CH, Corbeil J. Microarray truths and consequences. J Mol Endocrinol. 2004;33(1):1-9.
pubmed doi - Doniger SW, Salomonis N, Dahlquist KD, Vranizan K, Lawlor SC, Conklin BR. MAPPFinder: using Gene Ontology and GenMAPP to create a global gene-expression profile from microarray data. Genome Biol. 2003;4(1):R7.
pubmed doi - Ikeda K, Onaka T, Yamakado M, Nakai J, Ishikawa TO, Taketo MM, Kawakami K. Degeneration of the amygdala/piriform cortex and enhanced fear/anxiety behaviors in sodium pump alpha2 subunit (Atp1a2)-deficient mice. J Neurosci. 2003;23(11):4667-4676.
pubmed - Kristensen P, Judge ME, Thim L, Ribel U, Christjansen KN, Wulff BS, Clausen JT, et al. Hypothalamic CART is a new anorectic peptide regulated by leptin. Nature. 1998;393(6680):72-76.
pubmed doi - Ezashi T, Das P, Roberts RM. Low O2 tensions and the prevention of differentiation of hES cells. Proc Natl Acad Sci U S A. 2005;102(13):4783-4788.
pubmed doi - Lee JP, Jeyakumar M, Gonzalez R, Takahashi H, Lee PJ, Baek RC, Clark D, et al. Stem cells act through multiple mechanisms to benefit mice with neurodegenerative metabolic disease. Nat Med. 2007;13(4):439-447.
pubmed doi - Callaerts-Vegh Z, Beckers T, Ball SM, Baeyens F, Callaerts PF, Cryan JF, Molnar E, et al. Concomitant deficits in working memory and fear extinction are functionally dissociated from reduced anxiety in metabotropic glutamate receptor 7-deficient mice. J Neurosci. 2006;26(24):6573-6582.
pubmed doi - Hubert GW, Jones DC, Moffett MC, Rogge G, Kuhar MJ. CART peptides as modulators of dopamine and psychostimulants and interactions with the mesolimbic dopaminergic system. Biochem Pharmacol. 2008;75(1):57-62.
pubmed doi - Morrell MJ, Twigg G. Neural consequences of sleep disordered breathing: the role of intermittent hypoxia. Adv Exp Med Biol. 2006;588:75-88.
pubmed - Prasad SM, Czepiel M, Cetinkaya C, Smigielska K, Weli SC, Lysdahl H, Gabrielsen A, et al. Continuous hypoxic culturing maintains activation of Notch and allows long-term propagation of human embryonic stem cells without spontaneous differentiation. Cell Prolif. 2009;42(1):63-74.
pubmed doi - Tschop M, Morrison KM. Weight loss at high altitude. Adv Exp Med Biol. 2001;502:237-247.
pubmed - Liebermann DA, Hoffman B. Gadd45 in the response of hematopoietic cells to genotoxic stress. Blood Cells Mol Dis. 2007;39(3):329-335.
pubmed doi - Berckmans B, De Veylder L. Transcriptional control of the cell cycle. Curr Opin Plant Biol. 2009;12(5):599-605.
pubmed doi - Gibbons J, Hewitt E, Gardner DK. Effects of oxygen tension on the establishment and lactate dehydrogenase activity of murine embryonic stem cells. Cloning Stem Cells. 2006;8(2):117-122.
pubmed doi - Jeong CH, Lee HJ, Cha JH, Kim JH, Kim KR, Yoon DK, Kim KW. Hypoxia-inducible factor-1 alpha inhibits self-renewal of mouse embryonic stem cells in Vitro via negative regulation of the leukemia inhibitory factor-STAT3 pathway. J Biol Chem. 2007;282(18):13672-13679.
pubmed doi - Panchision DM. The role of oxygen in regulating neural stem cells in development and disease. J Cell Physiol. 2009;220(3):562-568.
pubmed doi - Powers DE, Millman JR, Huang RB, Colton CK. Effects of oxygen on mouse embryonic stem cell growth, phenotype retention, and cellular energetics. Biotechnol Bioeng. 2008;101(2):241-254.
pubmed doi - Pierfelice TJ, Schreck KC, Eberhart CG, Gaiano N. Notch, neural stem cells, and brain tumors. Cold Spring Harb Symp Quant Biol. 2008;73:367-375.
pubmed - Baldridge MT, King KY, Boles NC, Weksberg DC, Goodell MA. Quiescent haematopoietic stem cells are activated by IFN-gamma in response to chronic infection. Nature. 2010;465(7299):793-797.
pubmed doi
This is an open-access article distributed under the terms of the Creative Commons Attribution License, which permits unrestricted use, distribution, and reproduction in any medium, provided the original work is properly cited.
Journal of Neurology Research is published by Elmer Press Inc.