

| Journal of Neurology Research, ISSN 1923-2845 print, 1923-2853 online, Open Access |
| Article copyright, the authors; Journal compilation copyright, J Neurol Res and Elmer Press Inc |
| Journal website https://www.neurores.org |
Original Article
Volume 11, Number 3-4, August 2021, pages 37-46

Patient-Specific Cerebral Flow Model Using Regional Flows and Multi-Objective Optimization
Daniel Lia, Meide Zhaob, Robert Kufahlb, Xinjian Dub, Ali Alarajb, Jianmin Lib, c, Sepideh Amin-Hanjanib, Fady T. Charbelb, c
aDepartment of Orthopedics, Ohio State University, Columbus, OH, USA
bDepartment of Neurosurgery, University of Illinois at Chicago, Chicago, IL, USA
cCorresponding Author: Fady T. Charbel and Jianmin Li, Department of Neurosurgery, University of Illinois at Chicago, 912 S Wood St. RM451-N, Chicago, IL 60612, USAand
Manuscript submitted April 28, 2021, accepted June 29, 2021, published online July 13, 2021
Short title: Patient-Specific Cerebral Flow Model
doi: https://doi.org/10.14740/jnr671
| Abstract | ▴Top |
Background: Some cerebral flow models have good accuracy in predicting patient outcome, but are too complicated to be readily duplicated by others. Others are simpler, but lack accuracy in utilizing patient-specific boundary conditions.
Methods: A new patient-specific cerebral flow model aimed at both simplicity and accuracy was designed and applied to predict stump pressure (SP) during balloon test occlusion (BTO). The new model simulates both a baseline and an internal carotid artery (ICA) occlusion flow model. The former involves building a novel patient-specific cerebral flow model with regional flows, where the resistances of all inlet and internal vessels were obtained using a multi-objective optimization algorithm; regional blood flows were calculated using vessel flows measured from quantitative magnetic resonance angiography (QMRA). The ICA occlusion flow model computes the new blood flows and pressures of efferent, inlet and internal vessels with the simulated occlusion of the ICA, while keeping the resistances of the peripheral, inlet and internal vessels constant.
Results: The model was applied to predict SPs of four patients undergoing BTO. When aortic pressures are used, the simulated SPs demonstrate -11% to 7% error when compared to actual clinical measurements. When cuff pressures are used to approximate aortic pressures, the errors of the corresponding SPs becomes -19% to 1%.
Conclusions: The proposed model flow was validated with both clinically measured blood flows and SPs. Even when cuff pressures were used to approximate aortic pressures, the reliable predicted SPs were achieved. The model may be promising for clinical use.
Keywords: Cerebral flow model; Circle of Willis; MR angiography; Stump pressure; Balloon test occlusion
| Introduction | ▴Top |
Cerebral flow and stump pressure (SP) play critical roles in clinical diagnosis and surgical procedures [1-6]. SP is also called internal carotid artery (ICA) back pressure [7], and is measured by inserting a needle pressure catheter into ICA while a clip is applied proximal to the needle catheter. In literature many studies estimate both flow rates and pressure in the circle of Willis (COW) using cerebral flow modeling. A simple and accurate model can be valuable in assisting physicians to make clinical diagnoses and predict outcomes before performing invasive treatment procedures [8-10].
Cerebral flow models can be classified as lumped or zero-dimensional (0D) models [11-13], one-dimensional (1D) models [14-16], two-dimensional (2D) models [17] and three-dimensional (3D) models [18-21]. The 3D models require advanced experience in extracting patient data from computed tomography (CT), angiograms or magnetic resonance imaging (MRI) to build 3D vessel meshes and running computational fluid dynamics (CFD) software packages. Compared to other models, computing time for 3D models is significantly longer. The results from 3D models are hard for physicians to comprehend [22].
Most 0D models involve solving ordinary differential equations (ODEs) while 1D to 3D models include solving partial differential equations (PDEs). For both ODEs and PDEs, finding model parameters and assigning boundary conditions have been challenges. Model parameters normally require invasive measurement of both pressure and flow at selected positions, which is impractical [11]. Among the latest 3D models, although the COW 3D geometry was patient-specific, the models [20, 21] used generic flows or pressures at either inlets or outlets. All the generic flows or generic pressures caused the modeling to deviate from patient-specific values.
For any models to be clinical usable, their boundary conditions must be patient-specific, specially distal or terminal resistances. A previously described 1D model [10] combined three-element windkessel model [23] with try and error method to calculate patient-specific terminal resistances in predicting balloon test occlusion (BTO) outcome. Although the results were promising, the try and error method is time consuming and not guaranteed to be convergent. The model also used a generic pressure at the aorta. An improved model [15] employed an iterative multi-staged algorithm to calculate patient-specific terminal resistances and aortic pressure. However, the model is difficult to be duplicate, due to its complexity.
A more recent 0D model [22] utilized both structured tree model [24] and autoregulation as the centerpiece to find terminal resistances. Using this model, key parameters in estimating terminal resistances were calculated from the data of 10 patients. Therefore, the calculated terminal resistances were not truly patient-specific. This limitation is apparent in the wide errors between the model’s calculated flows and the clinically measured flows: -125% to 125%.
The model proposed herein is based on relatively simple concepts. It involves only linear equations based upon mass conservation, i.e., flow in is equal to flow out, as well as incorporating the use of Poiseuille’s law for steady flow. We validate the model by demonstrating its performance relative to clinically measured blood flows and SPs in patients undergoing BTO.
| Materials and Methods | ▴Top |
Data including vessel diameters and corresponding flow rates, cuff pressures, aortic pressures, and SPs (measured invasively during BTO) for four patients were collected. Our institutional BTO protocol has been previously published [25]. All four patients had provided consent, as approved by the Institutional Review Board at the University of Illinois at Chicago. The study was conducted in compliance with the ethical standards of the responsible institution on human subjects as well as with the Helsinki Declaration.
Vessel flow rates and diameters were obtained from quantitative magnetic resonance angiography (QMRA) performed using commercial software Noninvasive Optimal Vessel Analysis (NOVA) software (VasSol, Inc., River Forest, IL). NOVA was used to measure vessel flow rates and diameters; 3D models of the vessel surface were also rendered. The technique of flow measurement has been previously published [26]. A more detailed description of flow measurement using NOVA can be found from [15].
The terminal blood flows of the new model are based upon the concept of regional flow [27]. The brain arterial network was partitioned into 12 different regions, and each regional flow was calculated from the measured vessel flows of 15 cerebral arteries. In addition to the original 12 regional flows [27], four new regional flows were added: anterior inferior cerebellar region, superior cerebellar region, and right and left ophthalmic regions. All four new regional flows can also be calculated from measured flows. The regional blood flows serve as terminal blood flows in the model. Figure 1a shows 12 efferent regional flows of COW without a left posterior communicating (LPCoA).
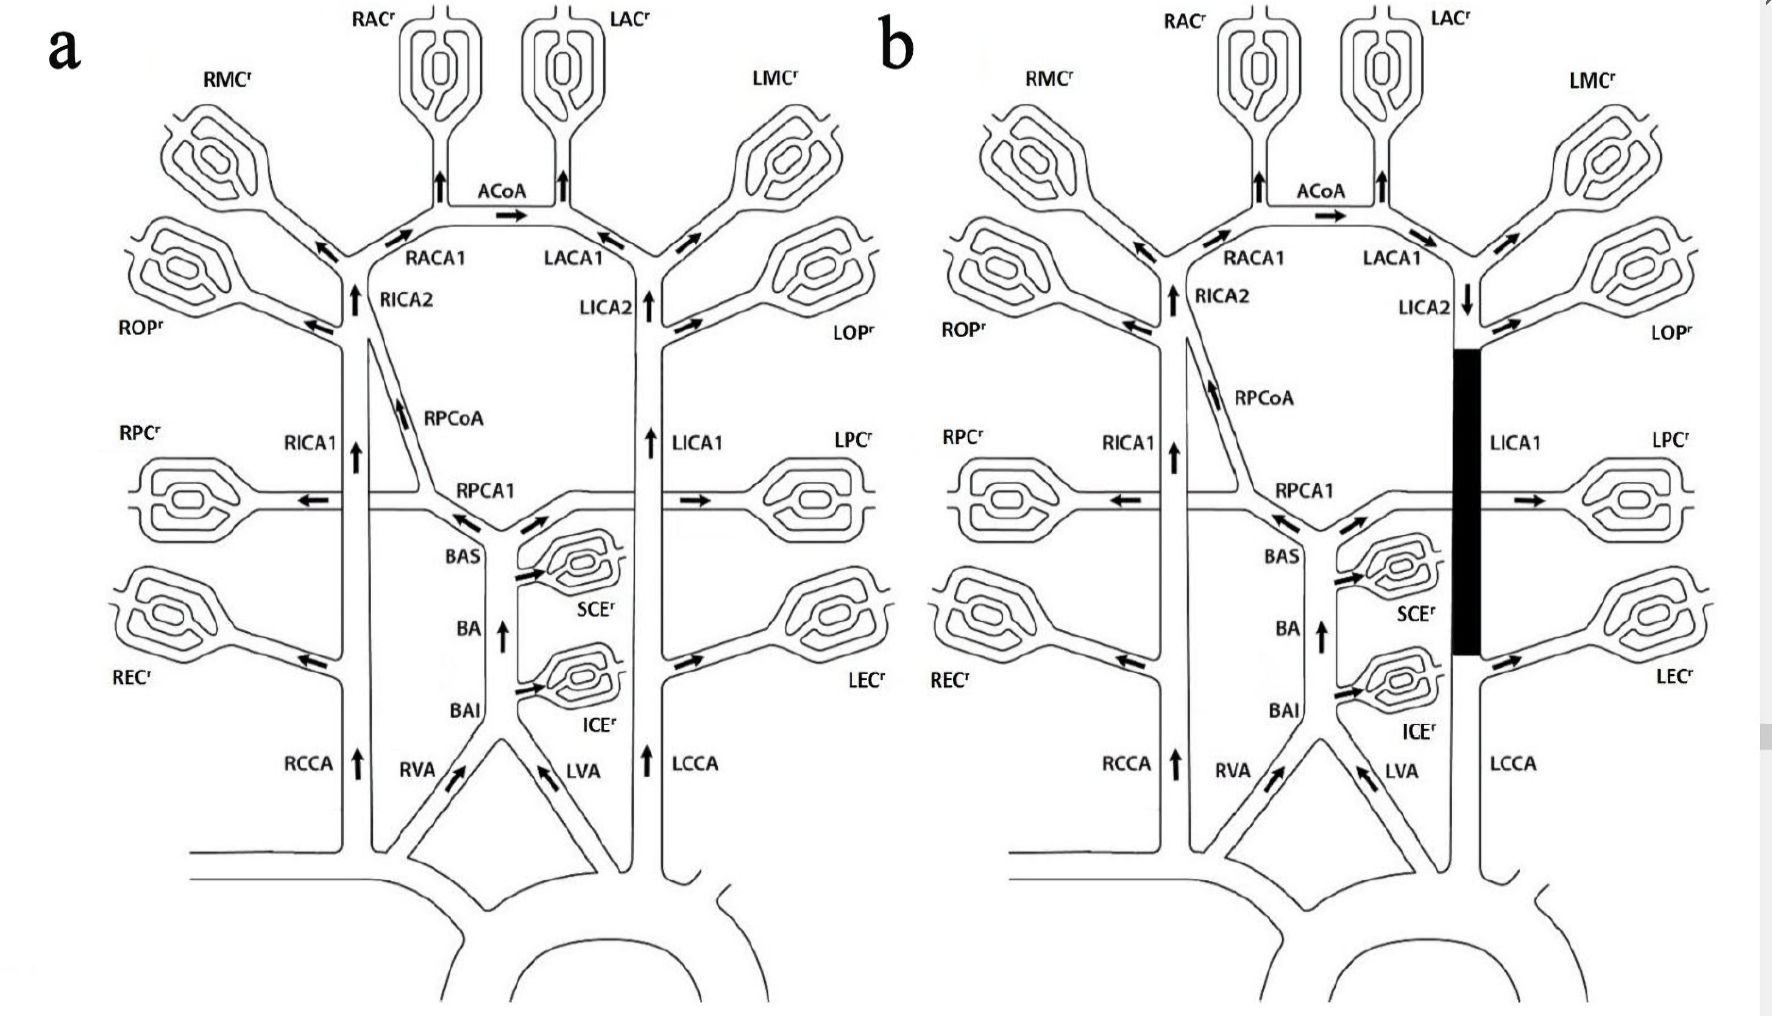 Click for large image | Figure 1. COW without LPCoA. (a) Baseline topology. (b) Left ICA occlusion topology. The 12 regional flows: right and left extra cranial regional flows (RECr and LECr), right and left ophthalmic regional flows (ROPr and LOPr), right and left middle cerebral regional flows (RMCr and LMCr), right and left anterior cerebral arteries section 2 regional flows (RACr and LACr), right and left posterior cerebral artery section 2 regional flows (RPCr and LPCr), anterior inferior cerebella regional flow (ICEr) and superior cerebella regional flow (SCEr); the four influent flows: right and left common carotid arteries (RCCA and LCCA), and right and left vertebral arteries (RVA and LVA); the 12 internal flows: BAI between VA and ICE, basilar artery (BA), BAS between BA and PCA1, right and left internal carotid arteries section 1 and 2 (RICA1, LICA1, RICA2 and LICA2), right posterior artery section 1 (RPCA1), right posterior communicating artery (RPCoA), right and left anterior cerebral arteries section 1 (RACA1 and LACA1), anterior cerebral communicating artery (ACoA). COW: circle of Willis. |
Baseline flow model
Figure 1a shows baseline topology for patients without LPCoA, which includes 16 vessels and 12 efferent regional flows. The topology is applicable to the first two patients.
Based upon flow continuity, whereby flow in is equal to flow out, there are 13 equations.
There are three additional pressure equations. Both vertebral artery (VA) and common carotid artery (CCA) originate from the ascending aorta area with nearly identical pressure. Thus for the outer layer loop, the pressure between right CCA (RCCA) through anterior cerebral communicating artery (ACoA) is equal to the pressure between left CCA (LCCA) through left anterior cerebral artery section 1 (LACA1):
For the left bottom inner loop, the pressure between RVA through right posterior communicating artery (RPCoA) is equal to the pressure between RCCA through right internal carotid artery section 1 (RICA1):
Both VAs pressures are equal:
All the 12 regional flows on the right side of the above equations (1) and (3) - (13) can be calculated from flow measurement using NOVA. The flow rates are denoted as QmRCCA, QmLCCA, QmRVA, QmLVA, QmRICA1, QmLICA1, QmBA, QmRMCA, QmLMCA, QmRACA1, QmLACA1, QmRACA2, QmLACA2, QmRPCA2, QmLPCA2, QmRPCoA, where Qmv indicates the measured flow rate for vessel “v”. Based on mass conservation, eight efferent regional flows QRECr, QLECr, QRMCr, QLMCr, QRACr, QLACr, QRPCr, and QLPCr can be obtained as follow:
Four more efferent regional flows QROPr, QLOPr, QICEr, and QSCEr can be calculated as follows:
Because all the 12 efferent regional flows are known, there are 16 variable flows and thus 16 necessary equations (1) - (16). The 16 flows can be solved independently, but the 16 resistances are unknown.
The flow rates of CCA, VA, BA, ICA1, PCoA, ACA1 and ACoA have been obtained from NOVA; therefore, a multi-objective optimization algorithm was used to find resistances in such a way that the calculated flow rates are as close to the measured flow rates as possible:
Each item in the minimization objective function Y is a scaled dimensionless and equalized weight factor for a targeted vessel’s flow rate. Therefore, the multiple objective optimization for each targeted vessel is converted to a single objective optimization function.
Optimization starts with the initial resistance R0, which is a vector including all 16 vessels, and it employs equations (1) - (16) to get new flow rates. The new flow rates are then used to get objective function value of Y, i.e., equation (29). Afterwards, a resistance change (also called step) ΔR is decided by the property of objective function Y and its constraints (30). A new resistance value R + ΔR is used for the next cycle (denoted as an iteration) until the objective function value cannot be reduced any further and constraints (30) are also satisfied. An introduction to optimization can be found from [28].
The initial optimization point of resistance R0 was estimated from Poiseuille’s equation:
Standardized vessel lengths were utilized in lieu of actual vessel lengths since vessel lengths were not specifically measured by NOVA. Table 1 shows the standard vessel lengths from [30-33].
 Click to view | Table 1. Vessel Standard Lengths |
UB was calculated using a 10% decrease in diameter (i.e., 1.5242R0), and LB was calculated using a 10% increase in diameter (i.e., 0.6561R0). The 20% freedom in diameter boundaries was chosen because NOVA has a 4.5% mean measurement error [27], and the additional 15.5% is to account for other possible errors such as using standard vessel lengths, generic blood viscosity and Poiseuille’s equation (31).
There are three simplifications related to unavailable vessel lengths. First, the ophthalmic vessel location on ICA1 is approximated to be in the same location as the PCoA on ICA1, i.e., the starting point of ICA2. Second, the resistance of ICA2 was assumed to be 2.5% of ICA1. The 2.5% factor estimation was based on the length ratio between ICA2 and ICA1 from [33]. Finally, the sectional resistances between the anterior inferior cerebellar artery (ICE) and VA, as well as the sectional resistance between the superior cerebellar artery (SCE) and PCA1, were also assumed to be 2.5% of the BA resistance.
Peripheral regional resistance calculation at baseline
After the internal vessel resistances and flows are obtained, the 12 regional pressure drop (from aorta) can be calculated using equations here (Supplementary Material 1, www.neurores.org) for patient 1 and 2. Where Paortic is aortic pressure and Pvenous is venous pressure. Pvenous is assumed to be a constant 10 mmHg.
The peripheral regional resistance for each region can be found using the equation below:
ICA occlusion flow model
Figure 1b shows the corresponding ICA occlusion topology for the first two patients. It is assumed that all the peripheral regional resistances are unchanged after ICA occlusion, as we did in our previous publication [10]. The new efferent regional (peripheral) flows and pressures, the new flows and pressures of inlet and internal vessels can be found by solving the corresponding linear equations.
There are total of 36 unknowns: 11 peripheral regional pressures, 11 new regional flows and14 new internal flows. The 36 required equations are shown in (Supplementary Material 2, www.neurores.org).
SP calculation at ICA occlusion
Venous pressure (10 mm Hg) is added back to the ipsilateral ophthalmic regional pressure drop at ICA occlusion to obtain the SP.
Optimization in Matlab
The source code for this model was written in Matlab. The multi-variable, constrained optimization uses the standard Matlab function fmincon. The following format was used: (R, fval) = fmincon (@Fun, R0, ( ), ( ), ( ), ( ), LB, UB), which returns a vector of optimal vessel resistance and the corresponding objective function value defined by equation (29). Fun is the objective function. For every set of vessel resistance, their corresponding vessel flow rates are calculated using governing equations (1) - (16). Then the corresponding objective function value is calculated using equation (29). R0 is a vector of initial vessel resistance defined by equation (31). LB and UB are lower and upper boundary limits of vessel resistance. The other four options are for linear inequality and linear equality constraints. They are left empty because there are no linear constraints for this case.
Statistical analysis
The linear fitting between the NOVA flows and the model flows was analyzed using the Curve Fitting Apps in Matlab. Matlab command Corr2 was used to calculate the correlations coefficient between the NOVA flows and the model flows.
| Results | ▴Top |
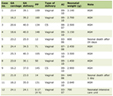
Both baseline and ICA occlusion flow models were applied to the first two patients shown in Table 2. Both patients have LICA aneurysms without LPCoA. Figure 2 shows patient 1’s flow chart and 3D surface rendering. Table 3 provides diameter and flow comparisons between NOVA and the proposed model. The calculated flows using the initial resistance R0 (without optimization), the initial resistance R0 and the optimal resistance R from the model are also listed. The optimal diameters were converted from equation (31) using optimal resistances. They are used for comparison only.
Click to view | Table 2. Patient Demographics/BTO Outcomes/Aortic/Cuff Pressure Measurements |
 Click for large image | Figure 2. Patient 1’s flow chart and 3D surface rendering. 3D: three-dimensional. |
Click to view | Table 3. Patient 1 Diameters and Flows Comparison Between NOVA and Model |
Because RPCA1 was not measured by NOVA, its flow was omitted from objective function Y. RPCA1assumes the diameter of RPCA2, which was measured by NOVA.
The objective function targets include CCA, VAs, BA, ICA1s, RPCoA, ACA1s and ACoA:
The initial objective function Y value is 1.7952 and the optimal Y value is 0.0684. Matlab fmincon analysis suggests that a local minimum was achieved.
The obtained optimal resistances were used to calculate peripheral regional resistances shown as in Table 4. The peripheral resistances were then applied to the ICA occlusion flow model to obtain SP of 88 mm Hg shown in Table 5, i.e., -7% error.
Click to view | Table 4. Peripheral Regional Resistance at Baseline for Patient 1 |
Click to view | Table 5. SPs Comparison Between Model and Clinical Measurement |
The flow and pressure comparison between baseline and occlusion is shown in Table 6. The vessel pressures were calculated at the middle section of each vessel. The biggest drop of both flow and pressure during occlusion were 12% and 13% respectively.
Click to view | Table 6. Flow and Pressure Comparison Between Baseline and Occlusion Model for Patient 1 |
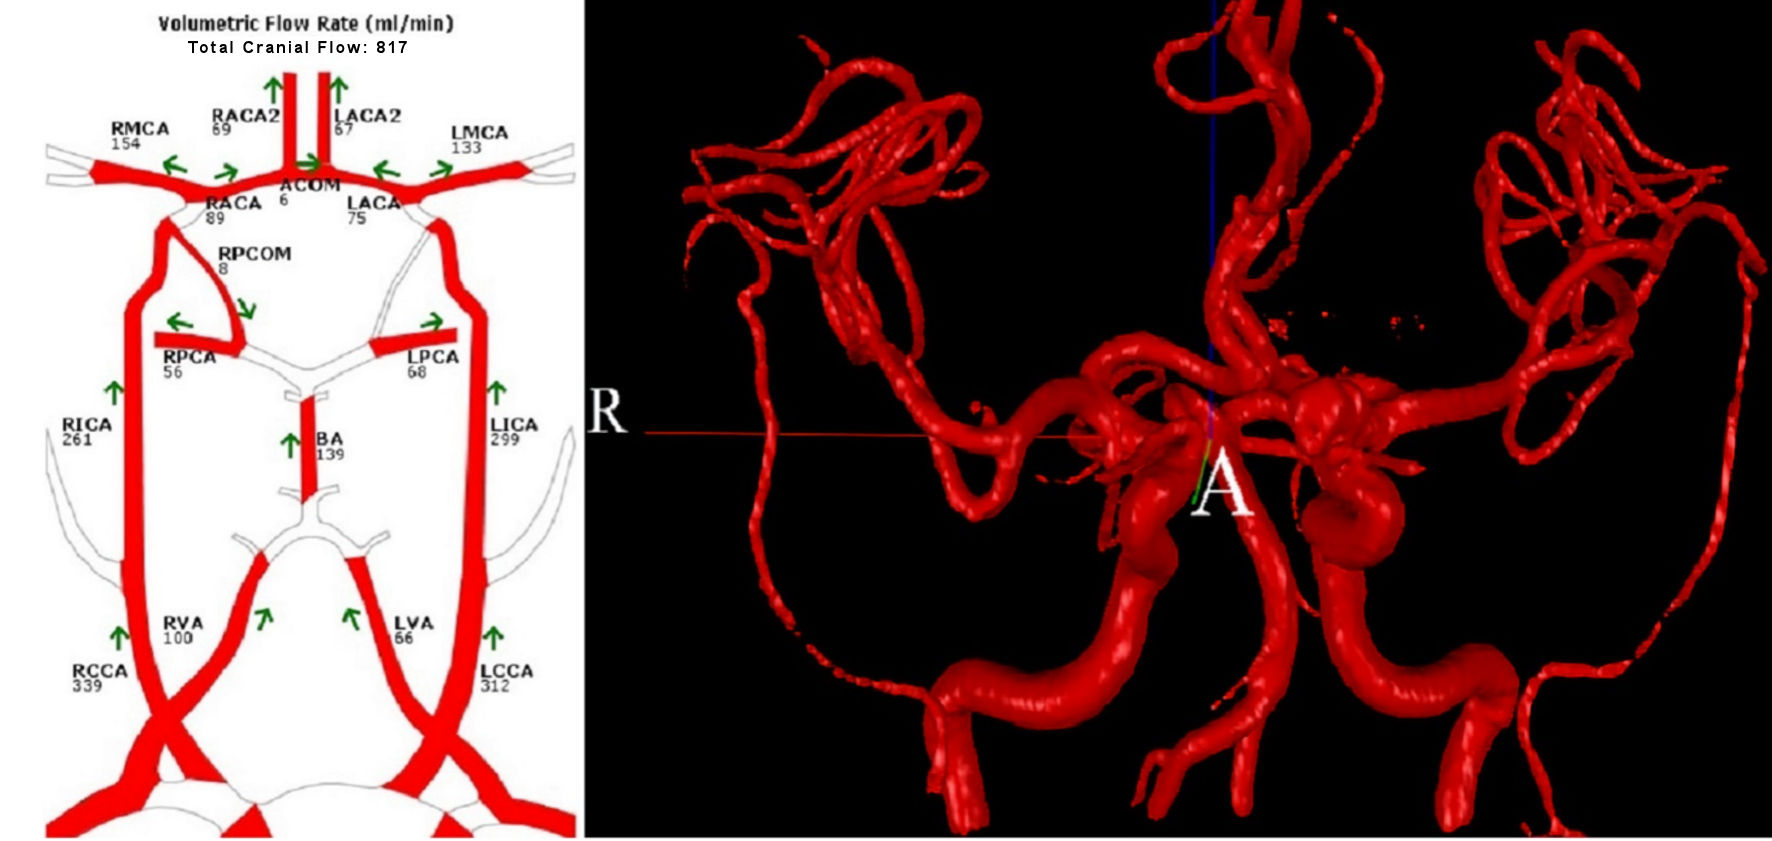
The models were applied to patient 2 in the same way. For patient 3 and 4, different topologies and equations were applied because of their different vascular morphologies from the first two patients. The NOVA flow charts for both patient 3 and 4 are shown in Figure 3. All calculated SPs are shown in Table 5.
 Click for large image | Figure 3. NOVA flow charts for patient 3 (left) and patient 4 (right). |
| Discussion | ▴Top |
The majority of the flow rates that were calculated using this model were close to the corresponding measurement by NOVA. There are 52 NOVA flow measurement for the four patients. Figure 4 shows the comparison between the model flows and NOVA flows of the four patients. The linear fitting R2 is 0.9832. The correlations coefficient between the model flows and NOVA flows is 0.9917. Comparing both model calculated flows and R2, our model has better accuracy than the previous model [22], which does not have pressure validation.
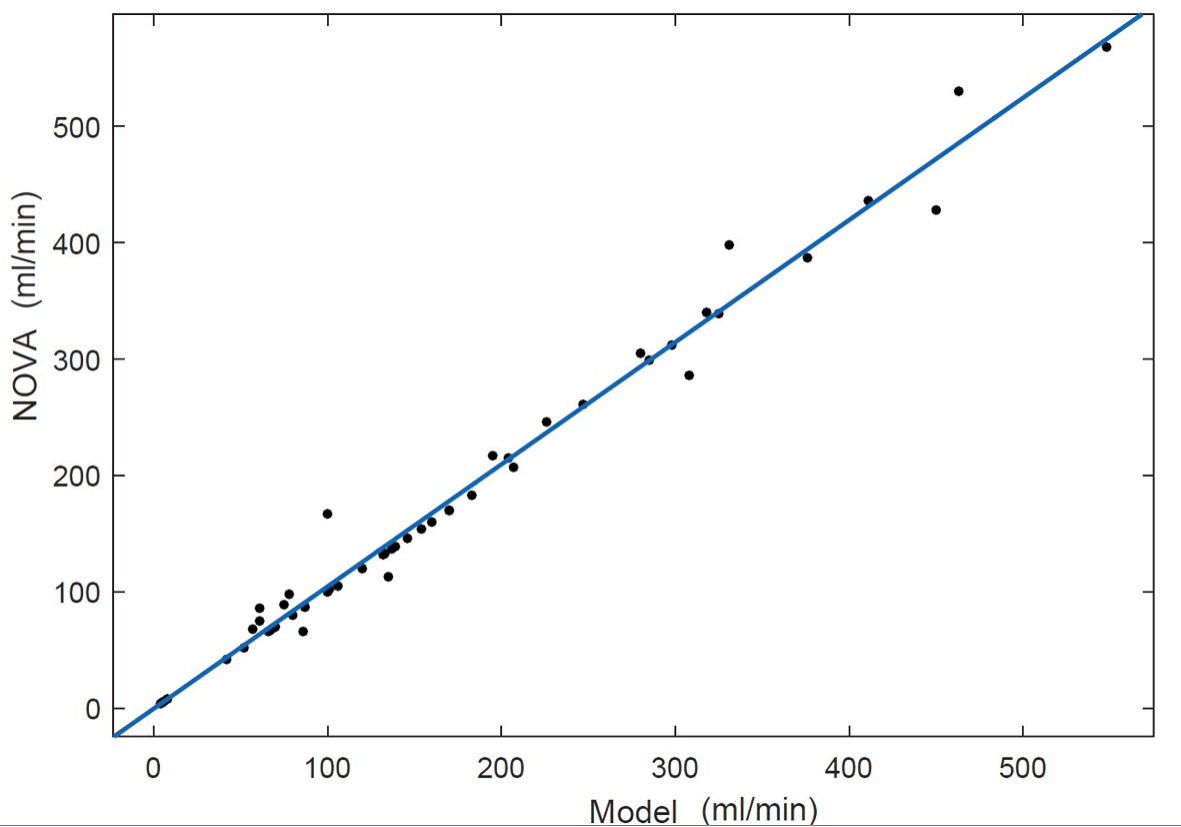 Click for large image | Figure 4. Scatter plot comparison between model flows and NOVA flows. The linear fitting R2 = 0.9832. NOVA: Noninvasive Optimal Vessel Analysis. |
The calculated flows using initial resistance (without optimization) have much wider error. For patient 1, the error is of -50% to +125%, versus -19% to 0% from using optimization (the new model), shown in Table 3. The flow calculation accuracy was improved by using optimization.
Poiseuille’s equation (31) is only an approximation of vessel resistance [34]. Poiseuille’s equation is based upon the assumption that blood is a Newtonian fluid with vessels being rigid tubes. In physiologic circulation, however, blood behaves in a non-Newtonian fashion, and vessels are flexible and distensible. In addition, using a uniformed diameter to represent the taped and curved vessel also introduces error. However, Poiseuille’s equation (31) was used in this model simply to estimate the initial resistance in the optimization, and was not required in the optimization process. The proposed model calculates optimal resistances that may or may not align with those calculated using Poiseuille’s equation.
Optimization requires an initial point, i.e., the initial estimation of vessel resistances. The closer the initial point is to the optimal point, the better the result. According to Poiseuille’s equation (31), vessel diameter is the dominant factor of vessel resistance because of its exponential property, while both blood viscosity and vessel length play a minor role because of their linear properties. By using the measured vessels’ diameters, the key patient-specific information was used in estimation of vessel resistances. Using generic blood viscosity, standard vessel length and the three 2.5% simplifications have a minor impact on the accuracy of vessel resistance’s estimation. Because NOVA flows were closed matched by the model flows and the calculated SPs are close to the measured SPs, the optimization was thus able to filter some errors in estimation of vessel resistances from the several factors mentioned above.
Venous pressure was first used to calculate peripheral regional pressure drop, then it was added back to calculate the SP. Therefore, using the generic venous pressure also has minor impact to the model.
The used aortic pressure was measured invasively. However, aortic pressure can be measured noninvasively using a sensor on the wrist [35]. Less invasively measured direct arterial blood pressure is closer to aortic pressure than cuff pressure [36]. If cuff pressures are used as approximation for aortic pressures, the corresponding calculated SPs are shown in Table 5. The results from both groups are similar.
The aortic pressures used in the model were invasively measured. From the data in Table 5, aortic pressures can be approximated by cuff pressures. Both noninvasively measured cuff pressures and cerebral blood flows can be used to estimate all pressures and flows of the major cerebral vessels under both baseline and ICA occlusion conditions. Physicians may use the data such as the estimated SPs to decide if clinical procedure ICA occlusion or shunting is feasible.
The model could be expanded to a variety of clinical scenarios, including patients with a complete COW, or any other anatomical variation. The model can also be used to corroborate other cerebral circulation models to improve vessel resistance estimation.
The model’s validation was limited to the data from four available patients. More patient data would be helpful. Our model did not consider the possible anastomoses between different blood flow regions, nor the effects of vessel auto-regulation. The non-Newtonian characteristics of blood flow, or the pulsatile nature of vessels was also unaccounted for, although we hope to investigate these properties in future studies.
Conclusions
A new and simple patient-specific cerebral flow model was proposed based upon both regional flows and multi-objective optimization. Regional flows were used to build the basic governing equations of the baseline flow model. Optimization utilized the basic governing equations to find the optimal vessel resistances. Then the obtained optimal vessel resistances were used to build the ICA occlusion flow model.
The model was validated by both clinically measured blood flows and SPs. Cuff pressure can be used to replace aortic pressure in the model. All pressures and flows of the major cerebral vessels under both baseline and ICA occlusion conditions can be estimated using both noninvasively measured cuff pressures and cerebral blood flows. Both estimated cerebral blood flows and pressures may help physicians to make clinical decisions.
| Supplementary Material | ▴Top |
Suppl 1. Equations of regional pressure drop at baseline for patient 1 and 2.
Suppl 2. Equations of regional flow model at ICA occlusion for patient 1 and 2.
Acknowledgments
The work was supported by University of Illinois at Chicago Clinical Translational Science Awards. The authors gratefully acknowledge Christa Wellman for her art work in Figure 1.
Financial Disclosure
The work was supported by the University of Illinois at Chicago Clinical Translational Science Awards.
Conflict of Interest
All authors have no conflict of interest to report.
Informed Consent
All informed consents were obtained.
Author Contributions
Daniel Li: model building, codes writing and article writing. Meide Zhao: guiding the project, model checking and article editing. Robert Kufahl: collecting patient data. Xinjian Du: collecting patient data. Ali Alaraj: collecting patient data. Jianmin Li: article editing. Sepideh Amin-Hanjani: article editing. Fady T. Charbel: guiding the project and article editing.
Data Availability
The authors declare that data supporting the findings of this study are available within the article.
Abbreviations
SP: stump pressure; COW: circle of Willis; R/LEC: right/left external carotid artery; R/LPC: right/left posterior cerebral artery; R/LMC: right/left middle cerebral artery; R/LAC: right/left anterior artery; SCE: superior cerebellar artery; ICE: inferior cerebellar artery; R/LCCA: right/ left common carotid artery; R/LVA: right/left vertebral artery; BA: basilar artery; R/LPCoA: right/left posterior communicating artery; ACoA: anterior cerebral communicating artery; BTO: balloon test occlusion; R/LICA: right/left internal carotid artery; R/LACA1: right/left anterior cerebral artery section 1; R/LICA1: right/left internal carotid artery section 1; R/LPCA1: right/left posterior artery section 1; RECr: right extra cranial regional flow; ROPr and LOPr: right and left ophthalmic regional flows; RMCr and LMCr: right and left middle cerebral regional flows; RACr and LACr: right and left anterior cerebral arteries regional flows; RPCr and LPCr: right and left posterior cerebral artery regional flows; ICEr: anterior inferior cerebella regional flow; SCEr: superior cerebella regional flow
| References | ▴Top |
- Amin-Hanjani S, Charbel FT. Flow-assisted surgical technique in cerebrovascular surgery. Surg Neurol. 2007;68(Suppl 1):S4-11.
doi pubmed - Amin-Hanjani S, Du X, Zhao M, Walsh K, Malisch TW, Charbel FT. Use of quantitative magnetic resonance angiography to stratify stroke risk in symptomatic vertebrobasilar disease. Stroke. 2005;36(6):1140-1145.
doi pubmed - Amin-Hanjani S, Shin JH, Zhao M, Du X, Charbel FT. Evaluation of extracranial-intracranial bypass using quantitative magnetic resonance angiography. J Neurosurg. 2007;106(2):291-298.
doi pubmed - Calligaro KD, Dougherty MJ. Correlation of carotid artery stump pressure and neurologic changes during 474 carotid endarterectomies performed in awake patients. J Vasc Surg. 2005;42(4):684-689.
doi pubmed - Aburahma AF, Stone PA, Hass SM, Dean LS, Habib J, Keiffer T, Emmett M. Prospective randomized trial of routine versus selective shunting in carotid endarterectomy based on stump pressure. J Vasc Surg. 2010;51(5):1133-1138.
doi pubmed - Aburahma AF, Mousa AY, Stone PA. Shunting during carotid endarterectomy. J Vasc Surg. 2011;54(5):1502-1510.
doi pubmed - Cossman D, Rosenthal D, Callow AD. A simplified technique for ICA back pressures. Stroke. 1977;8(6):717-718.
doi pubmed - Duros J, Clark ME, Kufahl RH, Nadvornik P. On the rupture of an aneurysm. Neurol Res. 1991;13(4):217-223.
doi pubmed - Clark ME, et al. A patient-specific computer model for prediction of clinical outcomes in the cerebral circulation using mr flow measurements, in Medical Image Computing and Computer-Assisted Intervention - MICCAI'99: Second International Conference, Cambridge, UK, September 19-22, 1999. Proceedings, Taylor C, Colchester A, Editors. Springer Berlin Heidelberg: Berlin, Heidelberg. 1999; p. 368-377.
- Charbel FT, Zhao M, Amin-Hanjani S, Hoffman W, Du X, Clark ME. A patient-specific computer model to predict outcomes of the balloon occlusion test. J Neurosurg. 2004;101(6):977-988.
doi pubmed - Shi Y, Lawford P, Hose R. Review of zero-D and 1-D models of blood flow in the cardiovascular system. Biomed Eng Online. 2011;10:33.
doi pubmed - Kokalari I. Review on lumped parameter method for modeling the blood flow in systemic arteries. Biomedical Science and Engineering. 2013;06:92-99.
doi - Dickey PS, Kailasnath P, Bloomgarden G, Goodrich I, Chaloupka J. Computer modeling of cerebral blood flow following internal carotid artery occlusion. Neurol Res. 1996;18(3):259-266.
doi pubmed - Charbel F, Shi J, Quek F, Zhao M, Misra M. Neurovascular flow simulation review. Neurol Res. 1998;20(2):107-115.
doi pubmed - Zhao M, et al. An Enhanced Patient-Specific Computer Model Using an Iterative Multi-Staged Algorithm. Neurol Res. 2017;7(3):25-38.
doi - Devault K, Gremaud PA, Novak V, Olufsen MS, Vernieres G, Zhao P. Blood Flow in the Circle of Willis: Modeling and Calibration. Multiscale Model Simul. 2008;7(2):888-909.
doi pubmed - David T, Brown M, Ferrandez A. Auto-regulation and blood flow in the cerebral circulation. International Journal for Numerical Methods in Fluids. 2003;43(6-7):701-713.
doi - Cebral J, Mut F, Sforza D, Lohner R, Scrivano E, Lylyk P, Putman C. Clinical application of image-based CFD for cerebral aneurysms. Int J Numer Method Biomed Eng. 2011;27(7):977-992.
doi pubmed - Sutalo ID, et al. Modeling of flow through the Circle of Willis and cerebral vasculature to assess the effects of changes in the peripheral small cerebral vasculature on the inflows. Engineering Applications of Computational Fluid Mechanics. 2014;8(4):609-622.
doi - Liu X, Gao Z, Xiong H, Ghista D, Ren L, Zhang H, Wu W, et al. Three-dimensional hemodynamics analysis of the circle of Willis in the patient-specific nonintegral arterial structures. Biomech Model Mechanobiol. 2016;15(6):1439-1456.
doi pubmed - Lin W, Ma X, Deng D, Li Y. Hemodynamics in the circle of willis with internal carotid artery stenosis under cervical rotatory manipulation: a finite element analysis. Med Sci Monit. 2015;21:1820-1826.
doi pubmed - Helthuis JHG, van Doormaal TPC, Amin-Hanjani S, Du X, Charbel FT, Hillen B, van der Zwan A. A patient-specific cerebral blood flow model. J Biomech. 2020;98:109445.
doi pubmed - Kufahl RH, Clark ME. A circle of Willis simulation using distensible vessels and pulsatile flow. J Biomech Eng. 1985;107(2):112-122.
doi pubmed - Olufsen MS. Structured tree outflow condition for blood flow in larger systemic arteries. Am J Physiol. 1999;276(1):H257-268.
doi pubmed - Rustemi O, Amin-Hanjani S, Shakur SF, Du X, Charbel FT. Donor selection in flow replacement bypass surgery for cerebral aneurysms: quantitative analysis of long-term native donor flow sufficiency. Neurosurgery. 2016;78(3):332-341; discussion 341-332.
doi pubmed - Zhao M, Charbel FT, Alperin N, Loth F, Clark ME. Improved phase-contrast flow quantification by three-dimensional vessel localization. Magn Reson Imaging. 2000;18(6):697-706.
doi - Zhao M, Amin-Hanjani S, Ruland S, Curcio AP, Ostergren L, Charbel FT. Regional cerebral blood flow using quantitative MR angiography. AJNR Am J Neuroradiol. 2007;28(8):1470-1473.
doi pubmed - Chong EKP, Zak SH. An introduction to optimization. Second ed. John Willey & Sons, Inc. 2001.
- Gisolf J. Postual changes in humans: effects of gravity on the circulation. Enschede, the Netherlands: Febodruk. 2004.
- Kamath S. Observations on the length and diameter of vessels forming the circle of Willis. J Anat. 1981;133(Pt 3):419-423.
- Ribeiro RAR, JAS, Rodrigues Filho OA, Caetano GA, Fazan VPS. Common carotid artery bifurcation levels related to clinical relevant anatomical landmarks. Int J Morphol. 2006;24(3):413-416.
doi - Sikka A, Jain A. Bilateral variation in the origin and course of the vertebral artery. Anat Res Int. 2012;2012:580765.
doi pubmed - Alastruey J, Parker KH, Peiro J, Byrd SM, Sherwin SJ. Modelling the circle of Willis to assess the effects of anatomical variations and occlusions on cerebral flows. J Biomech. 2007;40(8):1794-1805.
doi pubmed - Nichols WW, O'Rourke MF, Vlachopoulos C. McDonald's blood flow in Arteries, theoretical, experimental and clinical principles. Sixth ed. Boca Raton, FL: CRC Press. 2011.
- Williams B, Lacy PS, Yan P, Hwee CN, Liang C, Ting CM. Development and validation of a novel method to derive central aortic systolic pressure from the radial pressure waveform using an n-point moving average method. J Am Coll Cardiol. 2011;57(8):951-961.
doi pubmed - Ribezzo S, et al. Noninvasive techniques for blood pressure measurement are not a reliable alternative to direct measurement: a randomized crossover trial in ICU. The Scientific World Journal. 2014;2014:8.
doi pubmed
This article is distributed under the terms of the Creative Commons Attribution Non-Commercial 4.0 International License, which permits unrestricted non-commercial use, distribution, and reproduction in any medium, provided the original work is properly cited.
Journal of Neurology Research is published by Elmer Press Inc.