

| Journal of Neurology Research, ISSN 1923-2845 print, 1923-2853 online, Open Access |
| Article copyright, the authors; Journal compilation copyright, J Neurol Res and Elmer Press Inc |
| Journal website http://www.neurores.org |
Original Article
Volume 6, Number 1, February 2016, pages 1-7
Selective Laser Stimulation of Aδ- or C-Fibers Through Application of a Spatial Filter: A Study in Healthy Volunteers
Renske M. Hoebena, d, Imre P. Krabbenbosb, d, e, Eric P. A. van Dongenb, Selma C. Trompc, Eduard H. J. F. Boezemanc, Christiaan F. P. van Swola
aDepartment of Medical Physics and Instrumentation, St. Antonius Hospital Nieuwegein, The Netherlands
bDepartment of Anaesthesiology, Intensive Care and Pain Medicine, St. Antonius Hospital Nieuwegein, The Netherlands
cDepartment of Clinical Neurophysiology, St. Antonius Hospital Nieuwegein, The Netherlands
dThese authors contributed equally to this article.
eCorresponding Author: Imre P. Krabbenbos, Department of Anaesthesiology, Intensive Care and Pain Medicine, St. Antonius Hospital Nieuwegein, Koekoekslaan 1, 3435 CM Nieuwegein, The Netherlands
Manuscript accepted for publication November 11, 2015
Short title: Laser Stimulation of Aδ- or C-Fibers
doi: http://dx.doi.org/10.14740/jnr361w
| Abstract | ▴Top |
Background: Pain is perceived through different pathways involving thinly myelinated Aδ-fibers and unmyelinated C-fibers. Aδ-fibers are responsible for a quick, sharp pain, whereas C-fibers relate to a late-onset, burning sensation. Several studies suggest that it is essential to investigate nociceptive fibers separately and in relation to each other. The aim of this study was to selectively stimulate Aδ- and C-fibers using a 980-nm diode laser by varying the laser settings and the stimulated surface area in healthy subjects.
Methods: Selective activation of Aδ- and C-fibers is possible using their distinctive physiological characteristics. We used the differences in heat activation threshold and surface density to selectively activate Aδ- and C-fibers. Stimuli from a 980-nm diode laser were applied to 44 healthy volunteers. Two different laser settings were applied for selective stimulation of Aδ-fibers (20 ms at 2.7 W) and C-fibers (50 ms at 0.8 W). A spatial titanium filter, containing 40 holes with varying diameters (0.4, 0.6, 1, and 2 mm), was used to apply the stimuli with varying surface areas. The test subjects received 80 stimuli in total and were asked to press a button when the stimulation was felt. Reaction times between 300 and 650 ms indicate Aδ-fiber activation, whereas reaction times between 650 and 2,000 ms indicate C-fiber activation.
Results: First, the usage of response time to discriminate between Aδ- and C-fiber activation was validated. Then, the combined use of the two different stimulation protocols and a spatial filter turned out to be effective to achieve different probabilities of stimulating Aδ- or C-fibers. With the Aδ-protocol and a grid diameter of 2 mm, an Aδ:C response ratio of 1.17:1 was reached, and with the C-protocol and a grid diameter of 0.4 mm, the Aδ:C ratio was 0.05:1.
Conclusions: Our results indicate that cutaneous heat stimuli applied with a 980-nm diode laser, using a specific stimulation paradigm and a spatial filter, allow us to selectively activate Aδ- and C-fibers. These findings could serve as a basis for clinical investigation of different involvements of Aδ- and C-fibers in patients suffering from small fiber neuropathies.
Keywords: Epidermal nerve fibers; Laser; Selective stimulation; Nerve fiber density
| Introduction | ▴Top |
Pain is perceived through different pathways involving thinly myelinated Aδ-fibers and unmyelinated C-fibers. Aδ-fibers are thought to be responsible for first or fast pain described as pin-pricking, whereas activity of C-fibers causes late-onset, burning pain [1].
Several methods have been utilized to investigate nociceptive fibers separately and in relation to each other. Measurement data on the condition of Aδ- and/or C-fibers combined with patient’s sensations could possibly show objective changes in the nervous system. This is desired to diagnose patients more specifically regarding different nerve diseases.
The two nociceptive pathways (Aδ- and C-fibers) have distinct anatomical and physiological characteristics. By exploiting the differences in heat activation threshold [2-4] and epidermal nerve fiber density [2, 5, 6], it is possible to conceive experimental conditions that allow selective activation of Aδ- and C-fibers.
In this study, we experimentally investigated the feasibility of a spatial filter to selectively stimulate Aδ-fibers and C-fibers using a 980-nm diode laser in healthy subjects. Furthermore, the usage of response time to discriminate between Aδ- and C-fiber activation is validated and the experimentally determined probability of stimulating Aδ- or C-fibers is compared to the theory.
| Materials and Methods | ▴Top |
Aδ- and C-fibers have distinctive anatomical and physiological characteristics. These differences are used to selectively stimulate Aδ- or C-fibers in healthy adults (differences in epidermal nerve fiber density and heat activation threshold), and to discriminate between primary Aδ- and C-fiber activation (difference in response times).
Differences in epidermal nerve fiber density
Due to the difference in density distribution, the probability of stimulation differs between C- and Aδ-fibers. The epidermal nerve fiber density of Aδ-fibers is approximately < 1/mm2 and of C-fibers 2 - 8/mm2 [5, 7, 8].
When assuming that the spatial distribution of Aδ- and C-fiber receptors has a Poisson distribution with average occurrence of ρAδ = 0.5/mm2 and ρC = 5/mm2, respectively, then, the probability that Aδ- of C-fibers are stimulated is given by Equation (1) [2].
P[N(A)] = exp(-ρA) (Equation (1))
where ρ is the fiber density and A is the stimulation surface.
For instance, when the laser diameter is infinitely small, the probability of stimulation is zero, while a very large laser diameter will result in a stimulation probability of 1. When calculating the probability of nerve fiber stimulation for different stimulation surfaces, it becomes evident that for certain diameters, the probability of stimulating a C-fiber differs from the probability of Aδ-fiber stimulation. Plaghki and Mouraux [2] have used this relation to determine the probability of not activating Aδ-fibers, while in this study, the focus is on the probability of activating Aδ- or C-fibers. As can be seen in Figure 1, when stimulating with a small surface area (diameter < 1 mm), the chance of stimulating C-fibers is theoretically higher than the chance of stimulating Aδ-fibers. This curve is experimentally validated in this study. To increase the probability of selective Aδ- or C-fiber activation, the application of a spatial filter seems a feasible method based on the differences in epidermal nerve fiber distribution [2, 6].
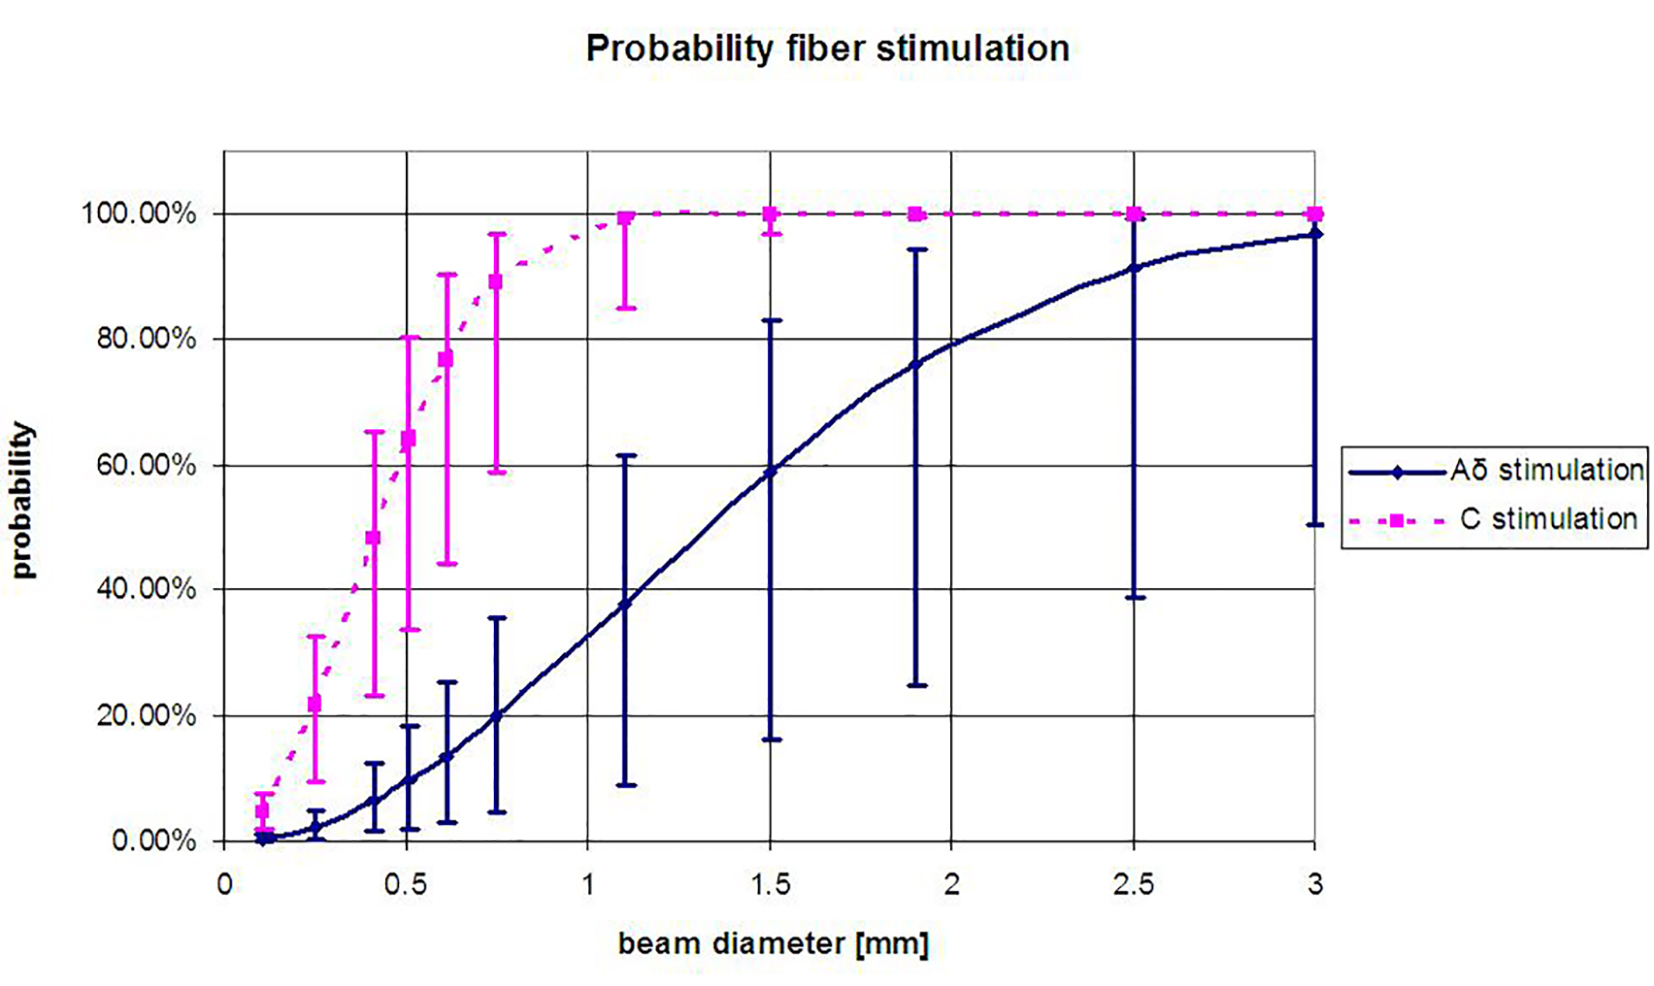 Click for large image | Figure 1. Probability of Aδ- or C-fiber activation at varying laser beam diameters (D), (Equation (1)), derived for the average spatial distribution of Aδ- and C-fibers (ρAδ = 0.5/mm2 and ρC = 5/mm2 [2]. The error bars represent the probability for the upper and lower limit of the fiber density Aδ-fibers 0.1 - 1/mm2 and of C-fibers 2 - 8/mm2 [5]. When the density of the nerve fibers changes due to disease, the curve is expected to shift (e.g., response rates drop). |
Spatial filter design
In order to stimulate at varying diameters we designed a spatial filter. This spatial filter, a 0.1-mm thin titanium plate, measured 40 mm in length and 90 mm in width, and contained 40 holes with diameters of 0.4, 0.6, 1, and 2 mm (surfaces of 0.13, 0.28, 0.79, and 3.14 mm2, respectively, Fig. 2). The spatial filter was placed close to the skin (< 1 mm) to reduce the effect of diffraction. The laser beam (2.5 mm diameter) was directed to the skin, through the holes of the plate. For each stimulation, the laser beam was directed through one hole at a time.
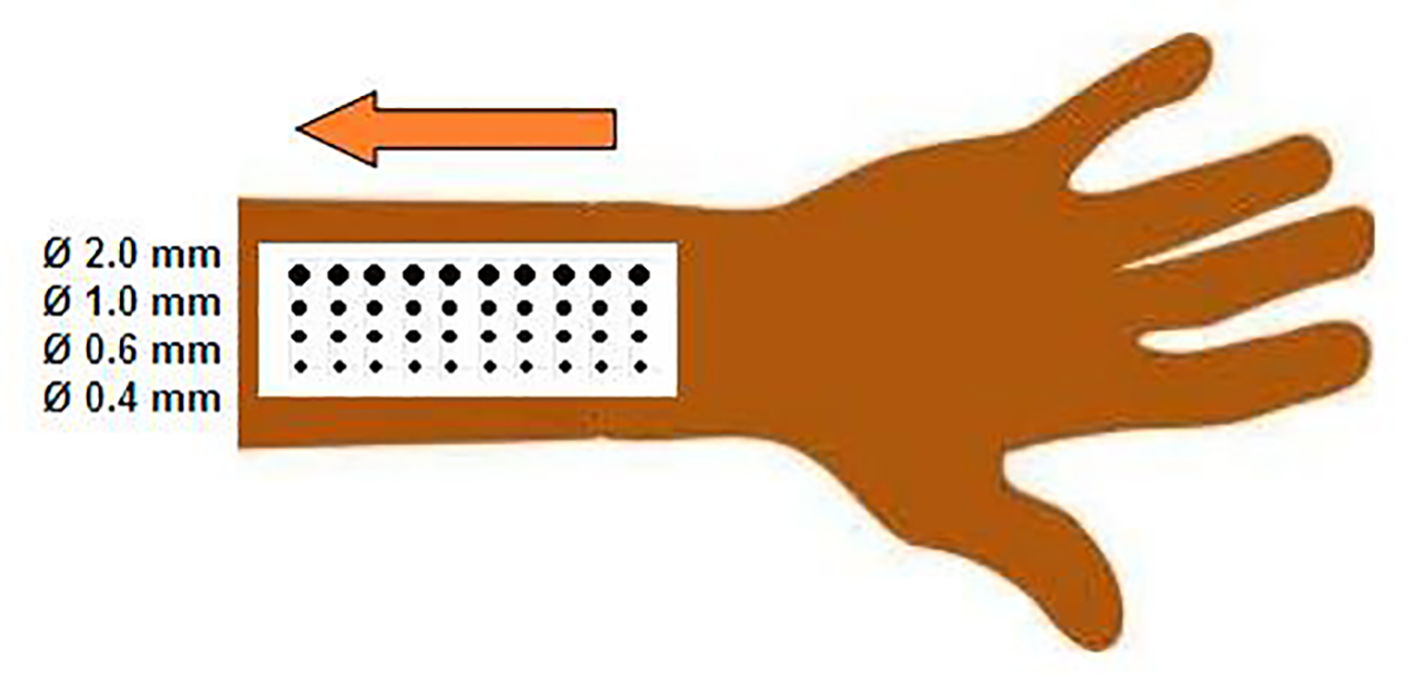 Click for large image | Figure 2. Schematic display of the grid design and measurement set-up. |
Heat threshold and laser settings
In this study, a diode laser is used to achieve thermal activation. Diode lasers have been used in several studies and shown to reliably activate nociceptive Aδ- and C-fibers [2, 9, 10]. The thermal activation threshold of C-fibers is known to be lower (± 40 °C) than that of Aδ-nociceptors (± 46 °C) [3, 4]. Mouraux and Plaghki showed the absolute detection threshold (7.6 ± 2.8 mJ/mm2) can be assumed to reflect the detection threshold of C-fiber elicited sensations, whereas the average thermal activation threshold of Aδ-nociceptors was 10.0 ± 1.6 mJ/mm2 [11]. Therefore, low intensity laser stimuli can be used to selectively activate C-fibers, whereas high intensity laser stimuli activate Aδ-fibers [3]. We used two different laser settings to increase the probability of selectively stimulating Aδ- and C-fibers: 20 ms at 2.7 W (11 mJ/mm2) for Aδ-fiber stimulation (Aδ-protocol), and 50 ms at 0.8 W (8 mJ/mm2) for C-fiber stimulation (C-protocol). In both protocols, a short stimulus duration (≤ 50 ms) was used to minimize the effect of temporal summation and heat conduction to surrounding tissue.
Population
Experiments were performed at the clinical neurophysiology outpatient department on a group of 44 healthy volunteers (21 men and 23 women) aged 28 - 66 (average 40.3 ± 12.2 years). None of the volunteers were taking medications or reported a (neurological) disease that might affect pain perception. Written informed consent was obtained before entering the study and all subjects were free to withdraw at any time. Participation in this study was in accordance with the Local Ethics Committee (NL48358.100.14).
Measurement protocol
The healthy volunteers were subjected to cutaneous stimuli from a 980-nm diode laser (Ceralas D15, Biolitec AG) with a 2.5-mm spot size hand piece (Biolitec, Ceramoptec, Germany). Subjects were positioned on a comfortable bed in a quiet room kept at 21 - 23 °C, while the light was dimmed. The skin of the left lower arm (C6 dermatoma) was blackened with East Indian ink (Pelikan, Hannover, Germany) to reduce superficial light reflectance of the skin, to reduce light scattering in the skin, to increase absorption of the laser light and to rule out bias by difference in skin pigmentation [9, 12]. The laser onset was triggered manually and in silence. Subjects were asked to relax but focus on the sensation of the laser stimulus. Interstimulus duration randomly varied between 3 and 6 s. Subjects were asked to press a button held in the right hand as soon as they perceived any sensation (pin-prick, burning) within the area of stimulation. Laser safety glasses were worn by everyone in the room.
Laser stimuli were delivered 40 times (10 laser stimuli for each of the four specific diameters) per protocol. First, stimulations were applied using laser settings according to the C-protocol, followed by the Aδ-protocol.
Response time
The time between the laser stimulus and perception of the stimulus was recorded as response time. The response time was used to discriminate between Aδ- and C-fiber mediated detections. Myelinated Aδ-fibers are known to have faster conduction velocities (± 10 m/s) than unmyelinated C-fibers (± 1 m/s). Aδ- or C-fiber related activity was defined as a response time less than 650 ms or between 650 and 2,500 ms, respectively [2, 13, 14]. Response times longer than 2,500 ms were classified as stimulus not detected. From the number of responses in relation to the amount of stimuli, the response rate was derived.
Derivation of epidermal nerve fiber density
The equation described by Plaghki (Equation (1)) is not only used to determine the optimal laser diameter for selective stimulation. As was previously explained, the shape and position of the curve depend on the fiber density (Fig. 1). By fitting the exponential function to the experimentally determined response rate, the fiber density was derived.
| Results | ▴Top |
First, the usage of response time to discriminate between Aδ- and C-fiber activation is validated. Second, the impact of using two different stimulation protocols is presented, and the optimal diameter for selective stimulation is determined. Third the experimentally determined probability of stimulating Aδ- or C-fibers is compared to the theory.
Validation of the response time cut-off
In Figure 3, a histogram of all response times is shown. A mixture of two Gaussian distributions can be seen, with peak responses at 500 and 1,000 ms. The cut-off point lies at 650 ms, which corresponds to the cut-off between Aδ- and C-fiber response times described in literature [2, 13, 14].
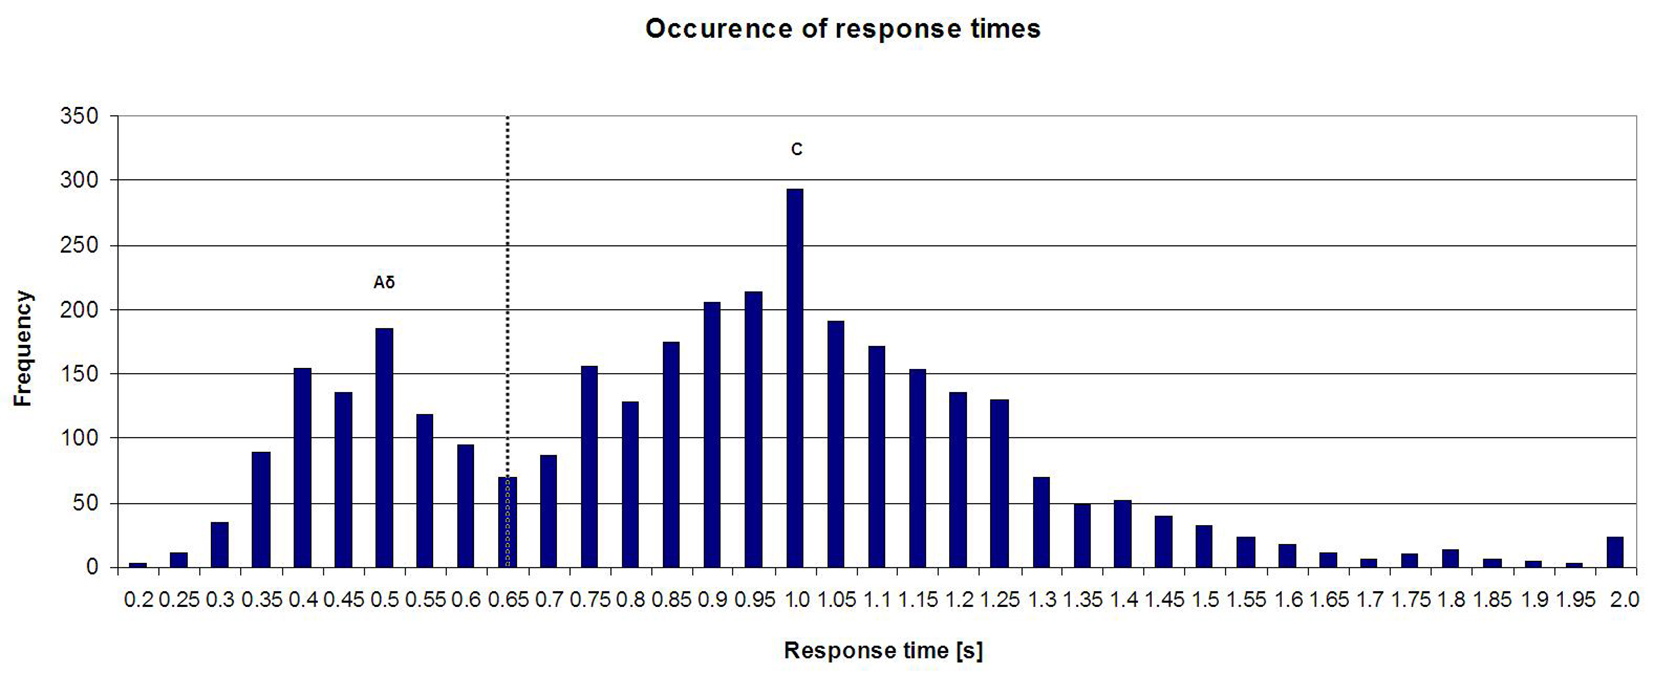 Click for large image | Figure 3. Histogram of all response times (Aδ-protocol and C-protocol). |
Impact of Aδ- and C-fiber stimulation protocol and grid diameter
The overall ratio between Aδ- and C-fiber responses is 0.38:1.0 (Fig. 3). When separating the data obtained with the two stimulation protocols, the ratio of Aδ- and C-fiber responses changes. During C-protocol stimulation, the ratio is 0.29:1.0. During Aδ-protocol stimulation, it is 0.52:1.0. Thus, the Aδ-protocol increases the probability of selective Aδ-fiber stimulation.
Besides differences in heat activation threshold, differences in fiber density were used to achieve selective stimulation (Table 1). The highest probability of stimulating Aδ-fibers is obtained with the Aδ-protocol combined and a grid diameter of 2 mm. The highest probability of C-fiber stimulation was obtained with the C-protocol and 0.4 mm grid diameter.
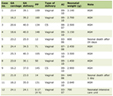 Click to view | Table 1. Ratio Between Aδ- and C-Fiber Stimulation at Different Grid Diameters per Stimulation Protocol |
As can be seen in Figure 4, the probability of fiber stimulation changes with a changing diameter. With a grid diameter of 0.4 mm, the highest probability of stimulating a C-fiber (and no Aδ-fiber) was reached.
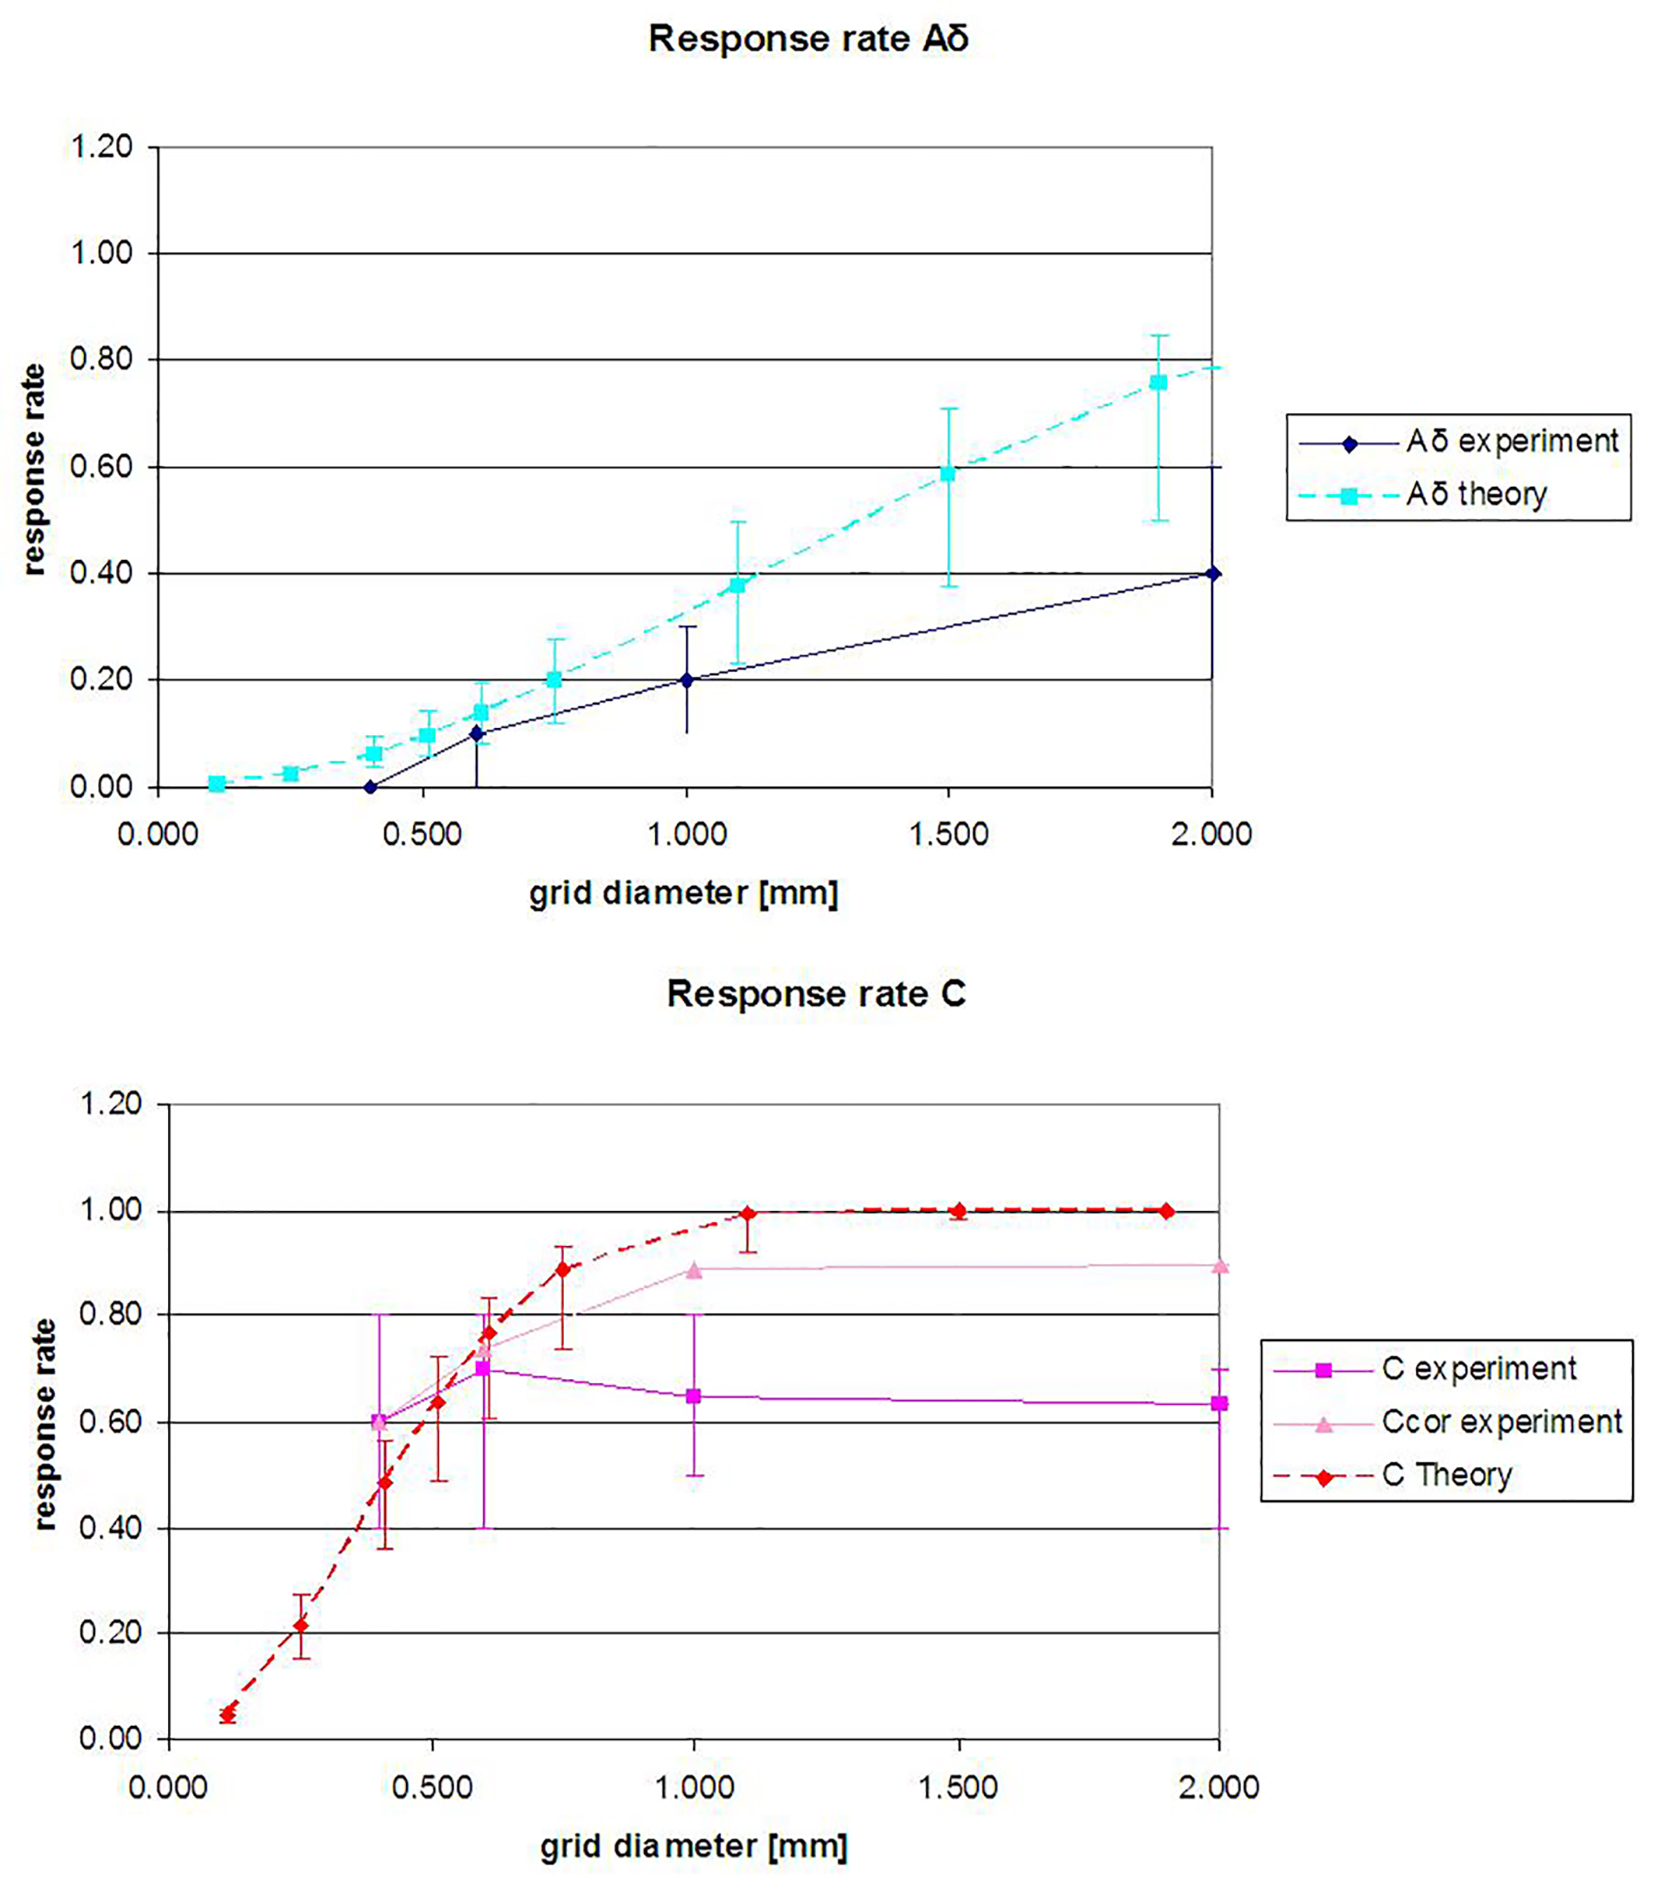 Click for large image | Figure 4. The theoretically (Equation (1)) and experimentally determined response rate at varying grid diameters. (Top) Aδ and (bottom) C-fibers. Aδ response rates are determined for the Aδ-protocol, and C response rates are for the C-protocol. Ccor stands for Ccorrected (Aδ responses are excluded). The median response rates are shown, and the error bars represent the quartiles. |
Experimental validation of the probability of fiber stimulation
A comparison between the theoretical probability of fiber stimulation and the results of our experiments is shown in Figure 4. The curve of Aδ stimulation results from stimulation with the Aδ-protocol and the C-curve from the C-protocol.
The Aδ response rate is lower than the theoretical response rate curve. At higher diameters, an increase in the amount of Aδ-fiber stimulations can be seen.
The C response rate is also lower than the theory curve. The experimentally determined C response rate only slightly varies with the variation in grid diameter. The 100% response rate was not reached.
When Aδ- and C-fibers are simultaneously stimulated, only the quickest sensation is recorded, which belongs to the Aδ-fiber. To compensate, the C-fiber response rate was also calculated when all Aδ responses were excluded (Ccor), thus indicating the lower (C) and higher limit (Ccor) of the C response rate. As can be seen in Figure 4, the Ccor line lies between the C experiment and C theory curve.
By fitting Equation (1) to the data shown in Figure 4, the fiber density was derived (Table 2). These density estimations are in the same order of magnitude as described in literature (Aδ < 1/mm2 and C 2 - 8/mm2), and the derived density varies with the grid diameter. The Aδ fiber density at 0.4 mm was not determined as most test subjects had a response rate of zero at this diameter.
Click to view | Table 2. Derived Density of Aδ- and C-Fibers From the Median Response Rate to Stimulation at Different Grid Diameters |
| Discussion | ▴Top |
Selective stimulation of Aδ- and C-fibers was achieved by using differences in response time, heat sensitivity and fiber density. Our results indicate that using 650 ms as a cut-off point to discriminate between Aδ- and C-responses is valid (Fig. 3). This matches the cut-off described in literature, which is also 650 ms [2, 13, 14]. When examining the response times per individual in general, two clusters can be seen that represent Aδ-and C-fiber responses. In some individuals, the cut-off point of 650 ms does not correctly separate these clusters, and the argument could be made that for these individuals, the cut-off point should be higher or lower. The cause of these individual differences and the benefit of choosing individual cut-off points need to be studied in more detail.
The usage of the two different stimulation protocols combined with the spatial filter has increased the probability of selective stimulation of the Aδ- or C-fibers. Especially, the usage of the C-protocol (50 ms, 0.8 W) combined with a grid diameter of 0.4 mm ensures that the majority of responses result from C-fiber stimulation (Aδ:C response ratio 0.05:1.0). It has to be noted that four of the 44 test subjects sensed only one or two stimulations with the C-protocol at 0.4 mm. The usage of the Aδ-protocol (20 ms at 2.7 W) and 2 mm grid diameter achieves the largest number of Aδ responses (Aδ:C ratio 1.17:1.0). The Aδ response rate can likely be further increased by increasing the grid diameter as was demonstrated in other studies [6, 7].
In this study, the theory presented by Plaghki and Mouraux [2] to determine the probability of not stimulating fibers was used to determine the probability of selective Aδ- or C-fiber activation.
The results of this study show that the detection rate of fiber stimulation does not solely depend on the fiber density and stimulation surface (Fig. 4). Although the fiber density is instrumental in the detection rate, as was demonstrated by our success in selectively stimulating Aδ- or C-fibers, it is not the only parameter involved. For instance, the detection rate of C-fibers is influenced by the presence of Aδ-fibers. When both are stimulated simultaneously, only the Aδ-fiber was registered as the button is only pressed when the first pain was felt. The actual C-fiber response rate could not be determined with the current set-up and the results indicate the lower limit of the C-fiber response rate. By excluding all Aδ-responses, we were also able to show the higher limit (Ccor) of the C response rate.
The derivation of the density from the response rate at varying grid diameters resulted in an estimated density of 0.2 - 0.4/mm2 for the Aδ-fibers and 0.7 - 7.3/mm2 for the C-fibers. This range in densities occurs because the exponential function (Equation (1)) used to determine the density does not fit the experimentally determined curve (Fig. 4). This indicates that there are additional factors influencing the response rate. For the C-fibers, the decline in derived density with increasing laser diameters is also evident in the case where all Aδ responses were excluded (Table 2). A possible explanation is the existence of an inhibiting effect when multiple nerve endings are simultaneously stimulated. As the perceived intensity of the stimulation was not measured, we cannot predict if the sensation could also be enhanced when several nerve endings are stimulated simultaneously. In order to use the response rate and stimulation surface to accurately derive the nerve fiber density, the other parameters that influence the response rate need to be known.
Additionally, the predicted response rate of one was not reached in the experiments. This might be the result of the limited focus of the test subjects, or due to desensitization or habituation caused by the amount of subsequent stimulations.
The response rates and ratios of normal healthy test subjects at varying laser settings and varying grid diameters can be used to determine changes in the epidermal nerve fibers (Aδ and/or C) of a patient population.
Conclusions
The aim of this study was to selectively stimulate Aδ- and C-fibers using a 980-nm diode laser by varying the stimulated surface area in healthy subjects.
Our results indicate that cutaneous heat stimuli applied with a 980-nm diode laser, using a specific stimulation paradigm and a spatial filter, allow us to selectively activate Aδ- and C-fibers. We recommend using a 50 ms pulse of 0.8 W and 0.4 mm beam diameter for selective stimulation of C-fibers. For Aδ-fibers, a 20 ms pulse, 2.7 W and 2 mm diameter or larger is recommended. By using these protocols, the highest probability of selective stimulation was reached with Aδ:C response ratios of 0.05:1.0 and 1.17:1.0, respectively.
We suspect involvement of other factors influencing the probability of detection (additional to the fiber density). We will continue to investigate age- and gender-related differences.
Furthermore, this study will serve as a basis for an upcoming clinical investigation in the differential involvement of Aδ- and C-fibers in small fiber neuropathies.
Conflict of Interest
The authors declare that no funding was received for this research.
| References | ▴Top |
- Lewis T, Ponchin E. The double pain response of the human skin to a single stimulus. Clin Sci. 1937;3:67-76.
- Plaghki L, Mouraux A. How do we selectively activate skin nociceptors with a high power infrared laser? Physiology and biophysics of laser stimulation. Neurophysiol Clin. 2003;33(6):269-277.
doi pubmed - Magerl W, Ali Z, Ellrich J, Meyer RA, Treede RD. C- and A delta-fiber components of heat-evoked cerebral potentials in healthy human subjects. Pain. 1999;82(2):127-137.
doi - Treede RD, Meyer RA, Raja SN, Campbell JN. Evidence for two different heat transduction mechanisms in nociceptive primary afferents innervating monkey skin. J Physiol. 1995;483(Pt 3):747-758.
doi pubmed - Ochoa J, Mair WG. The normal sural nerve in man. II. Changes in the axons and Schwann cells due to ageing. Acta Neuropathol. 1969;13(3):217-239.
doi pubmed - Bragard D, Chen AC, Plaghki L. Direct isolation of ultra-late (C-fibre) evoked brain potentials by CO2 laser stimulation of tiny cutaneous surface areas in man. Neurosci Lett. 1996;209(2):81-84.
doi - Mouraux A, Rage M, Bragard D, Plaghki L. Estimation of intraepidermal fiber density by the detection rate of nociceptive laser stimuli in normal and pathological conditions. Neurophysiol Clin. 2012;42(5):281-291.
doi pubmed - Willis WD, Jr. Central nervous system mechanisms for pain modulation. Appl Neurophysiol. 1985;48(1-6):153-165.
pubmed - Krabbenbos IP, Swol van CFP, Dongen van EPA, Tromp SC, Boezeman EHJF. Stimulating Ad and C-Fibers in the Lower Limb With a 980 nm Diode Laser. J Neurol Res. 2013;3(2):56-61.
- Tzabazis AZ, Klukinov M, Crottaz-Herbette S, Nemenov MI, Angst MS, Yeomans DC. Selective nociceptor activation in volunteers by infrared diode laser. Mol Pain. 2011;7:18.
doi pubmed - Mouraux A, Plaghki L. Are laser-evoked brain potentials modulated by attending to first or second pain? Pain. 2007;129(3):321-331.
doi pubmed - Arendt-Nielsen L, Bjerring P. Reaction times to painless and painful CO2 and argon laser stimulation. Eur J Appl Physiol Occup Physiol. 1988;58(3):266-273.
doi pubmed - Opsommer E, Masquelier E, Plaghki L. Determination of nerve conduction velocity of C-fibres in humans from thermal thresholds to contact heat (thermode) and from evoked brain potentials to radiant heat (CO2 laser). Neurophysiol Clin. 1999;29(5):411-422.
doi - Truini A, Galeotti F, Cruccu G, Garcia-Larrea L. Inhibition of cortical responses to Adelta inputs by a preceding C-related response: testing the "first come, first served" hypothesis of cortical laser evoked potentials. Pain. 2007;131(3):341-347.
doi pubmed
This is an open-access article distributed under the terms of the Creative Commons Attribution-NonCommercial 4.0 International License, which permits unrestricted non-commercial use, distribution, and reproduction in any medium, provided the original work is properly cited.
Journal of Neurology Research is published by Elmer Press Inc.