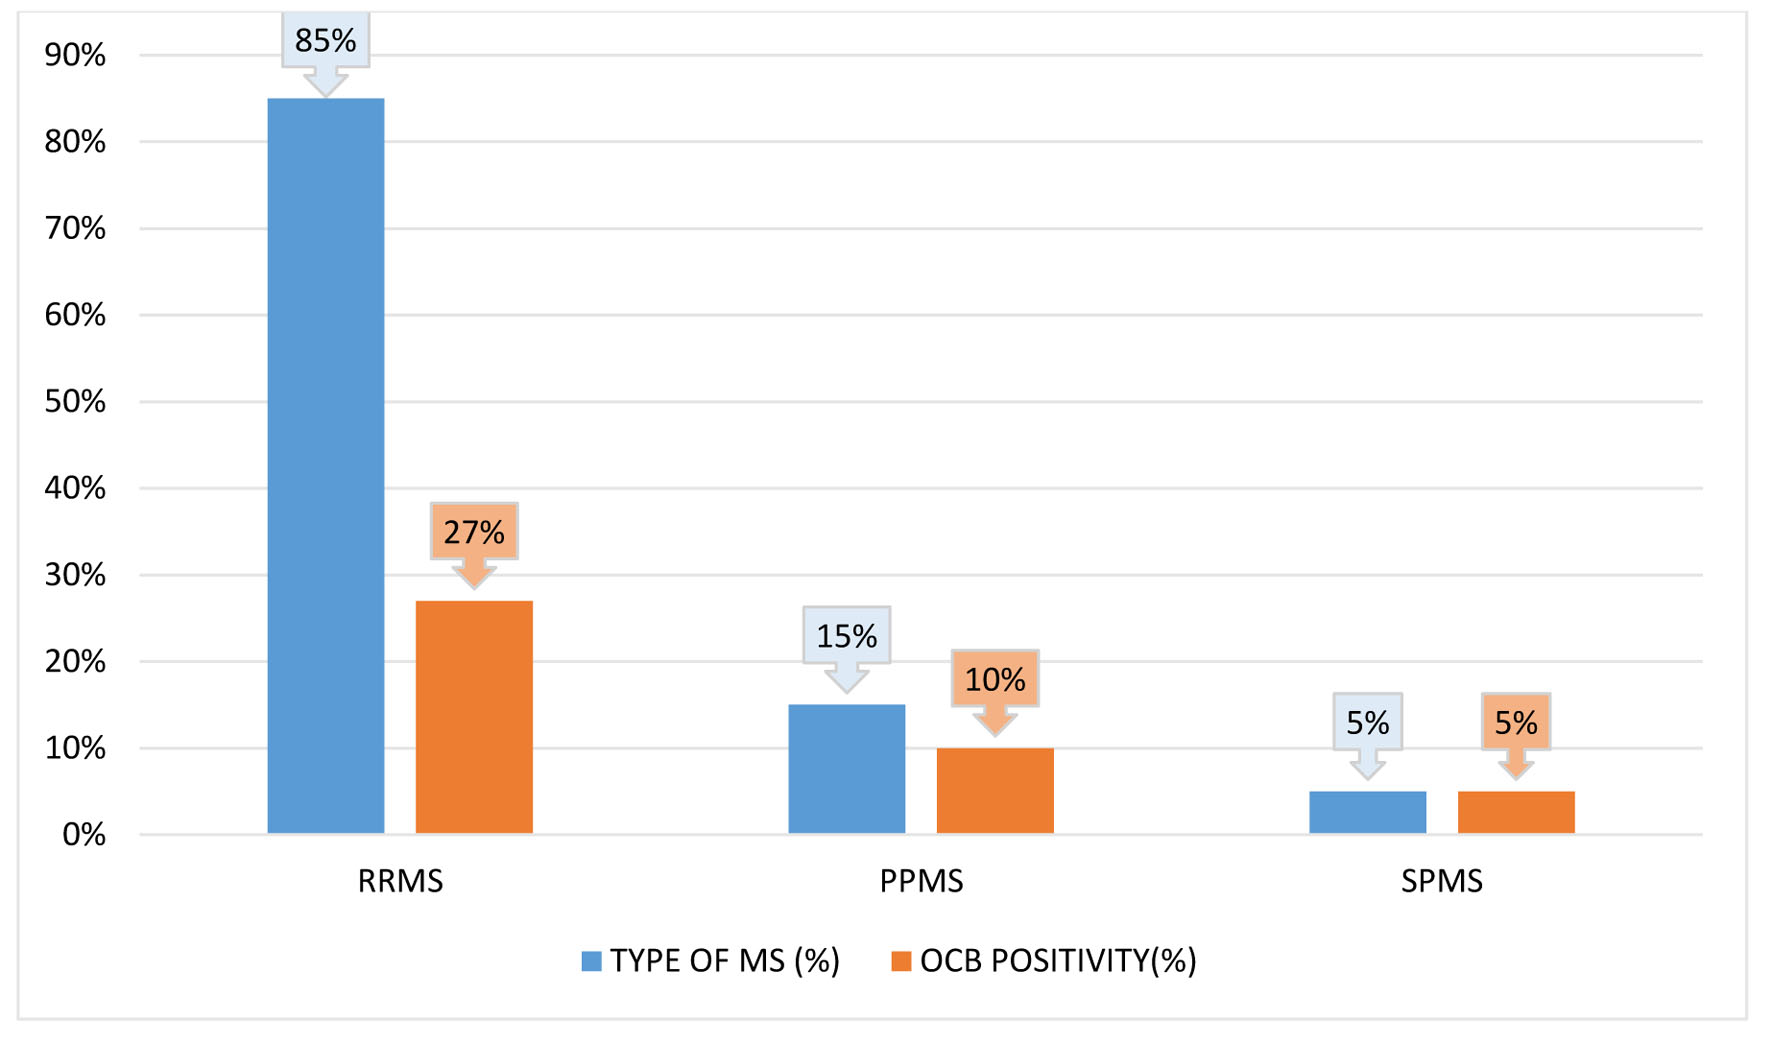
Figure 1. Relapsing-remitting multiple sclerosis (RRMS), secondary-progressive multiple sclerosis (SPMS), and primary-progressive multiple sclerosis (PPMS) are each represented in a bar diagram with respect to the relative frequency of oligoclonal bands (OCBs) positive status.
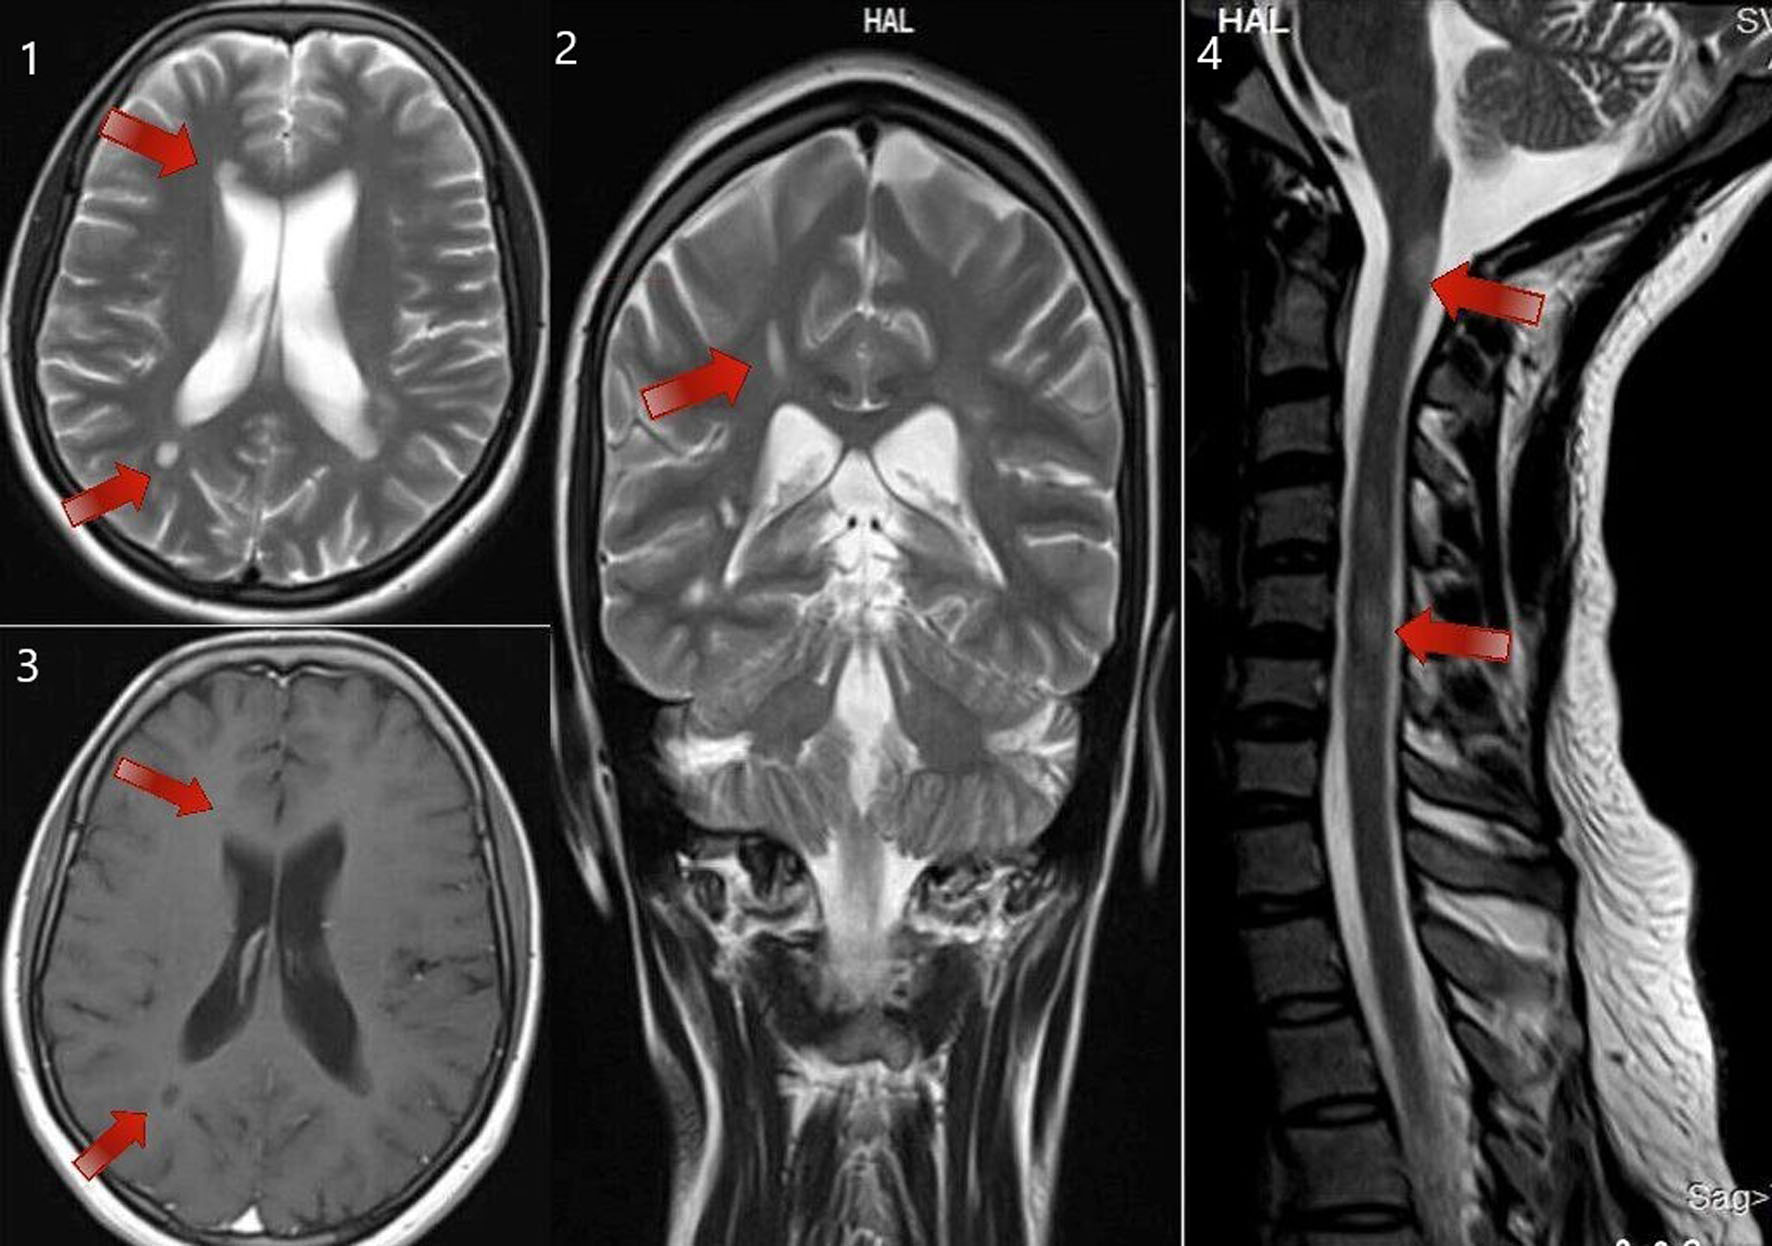
Figure 3. MRI of brain T2 sequence axial section showing periventricular deep white matter lesions (as shown by the arrows in the sequence labeled as 1). MRI of brain T2 sequence coronal section in the corresponding regions shows an abnormal hyperintense signal (as shown by the arrows in the sequence labeled as 2). MRI of brain post-contrast T1 sequence in the corresponding regions shows a hypointense signal (as shown by the arrows in the sequence labeled as 3). MRI of the cervical spine sagittal section shows short segment abnormal cord hyperintensity (as shown by the arrows in the sequence labeled as 4). These images correspond to a 24-year-old woman who presented with right-hand monoplegia. She also had a recent history of sudden onset decreased vision in the right eye which has subsided spontaneously. MRI: magnetic resonance imaging.
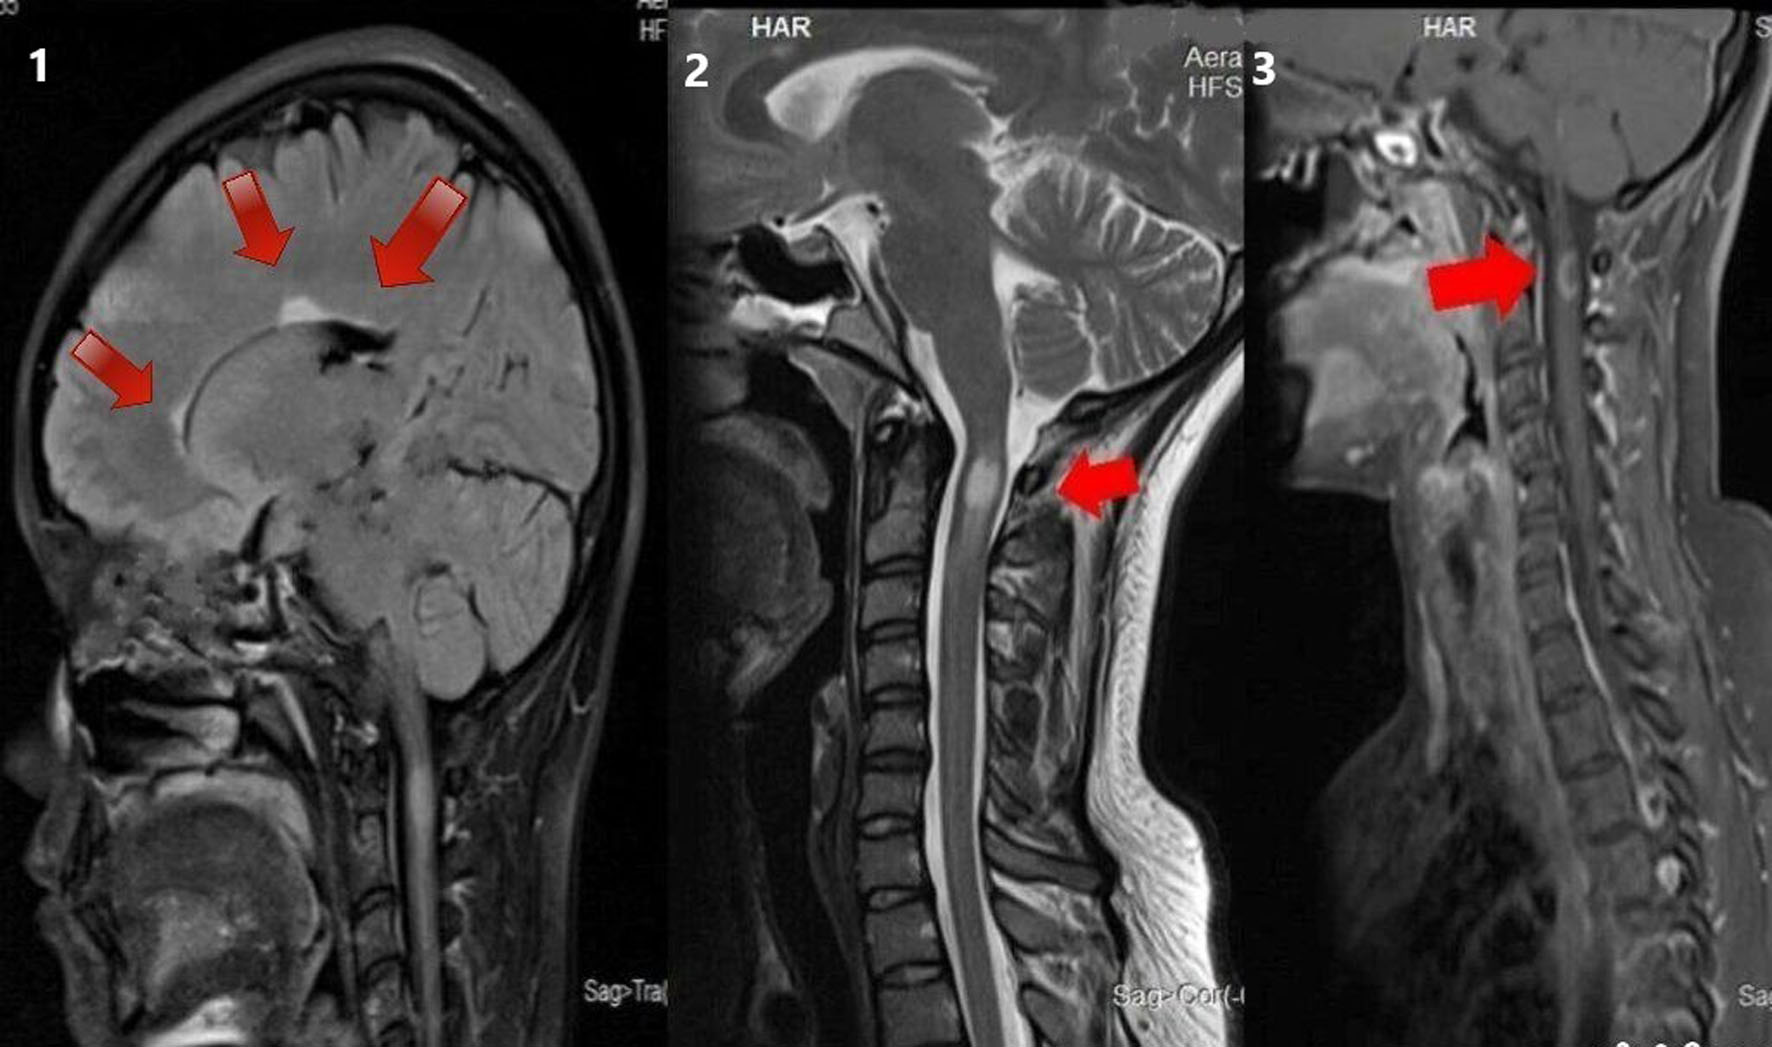
Figure 4. MRI of brain T2 sagittal sequence showing three periventricular lesions (as shown by the arrows in the sequence labeled 1). MRI of cervical spine T2 sagittal sequence showing short segment hyperintensity (as shown by the arrows in the sequence labeled 2). MRI of cervical spine T1 post-contrast sagittal sequence showing contrast enhancement in the corresponding region (as shown by arrows in the sequence labeled 3) in a 28-year-old woman with a 10-day history of pain and paraesthesia in the occipital and neck region. MRI: magnetic resonance imaging.