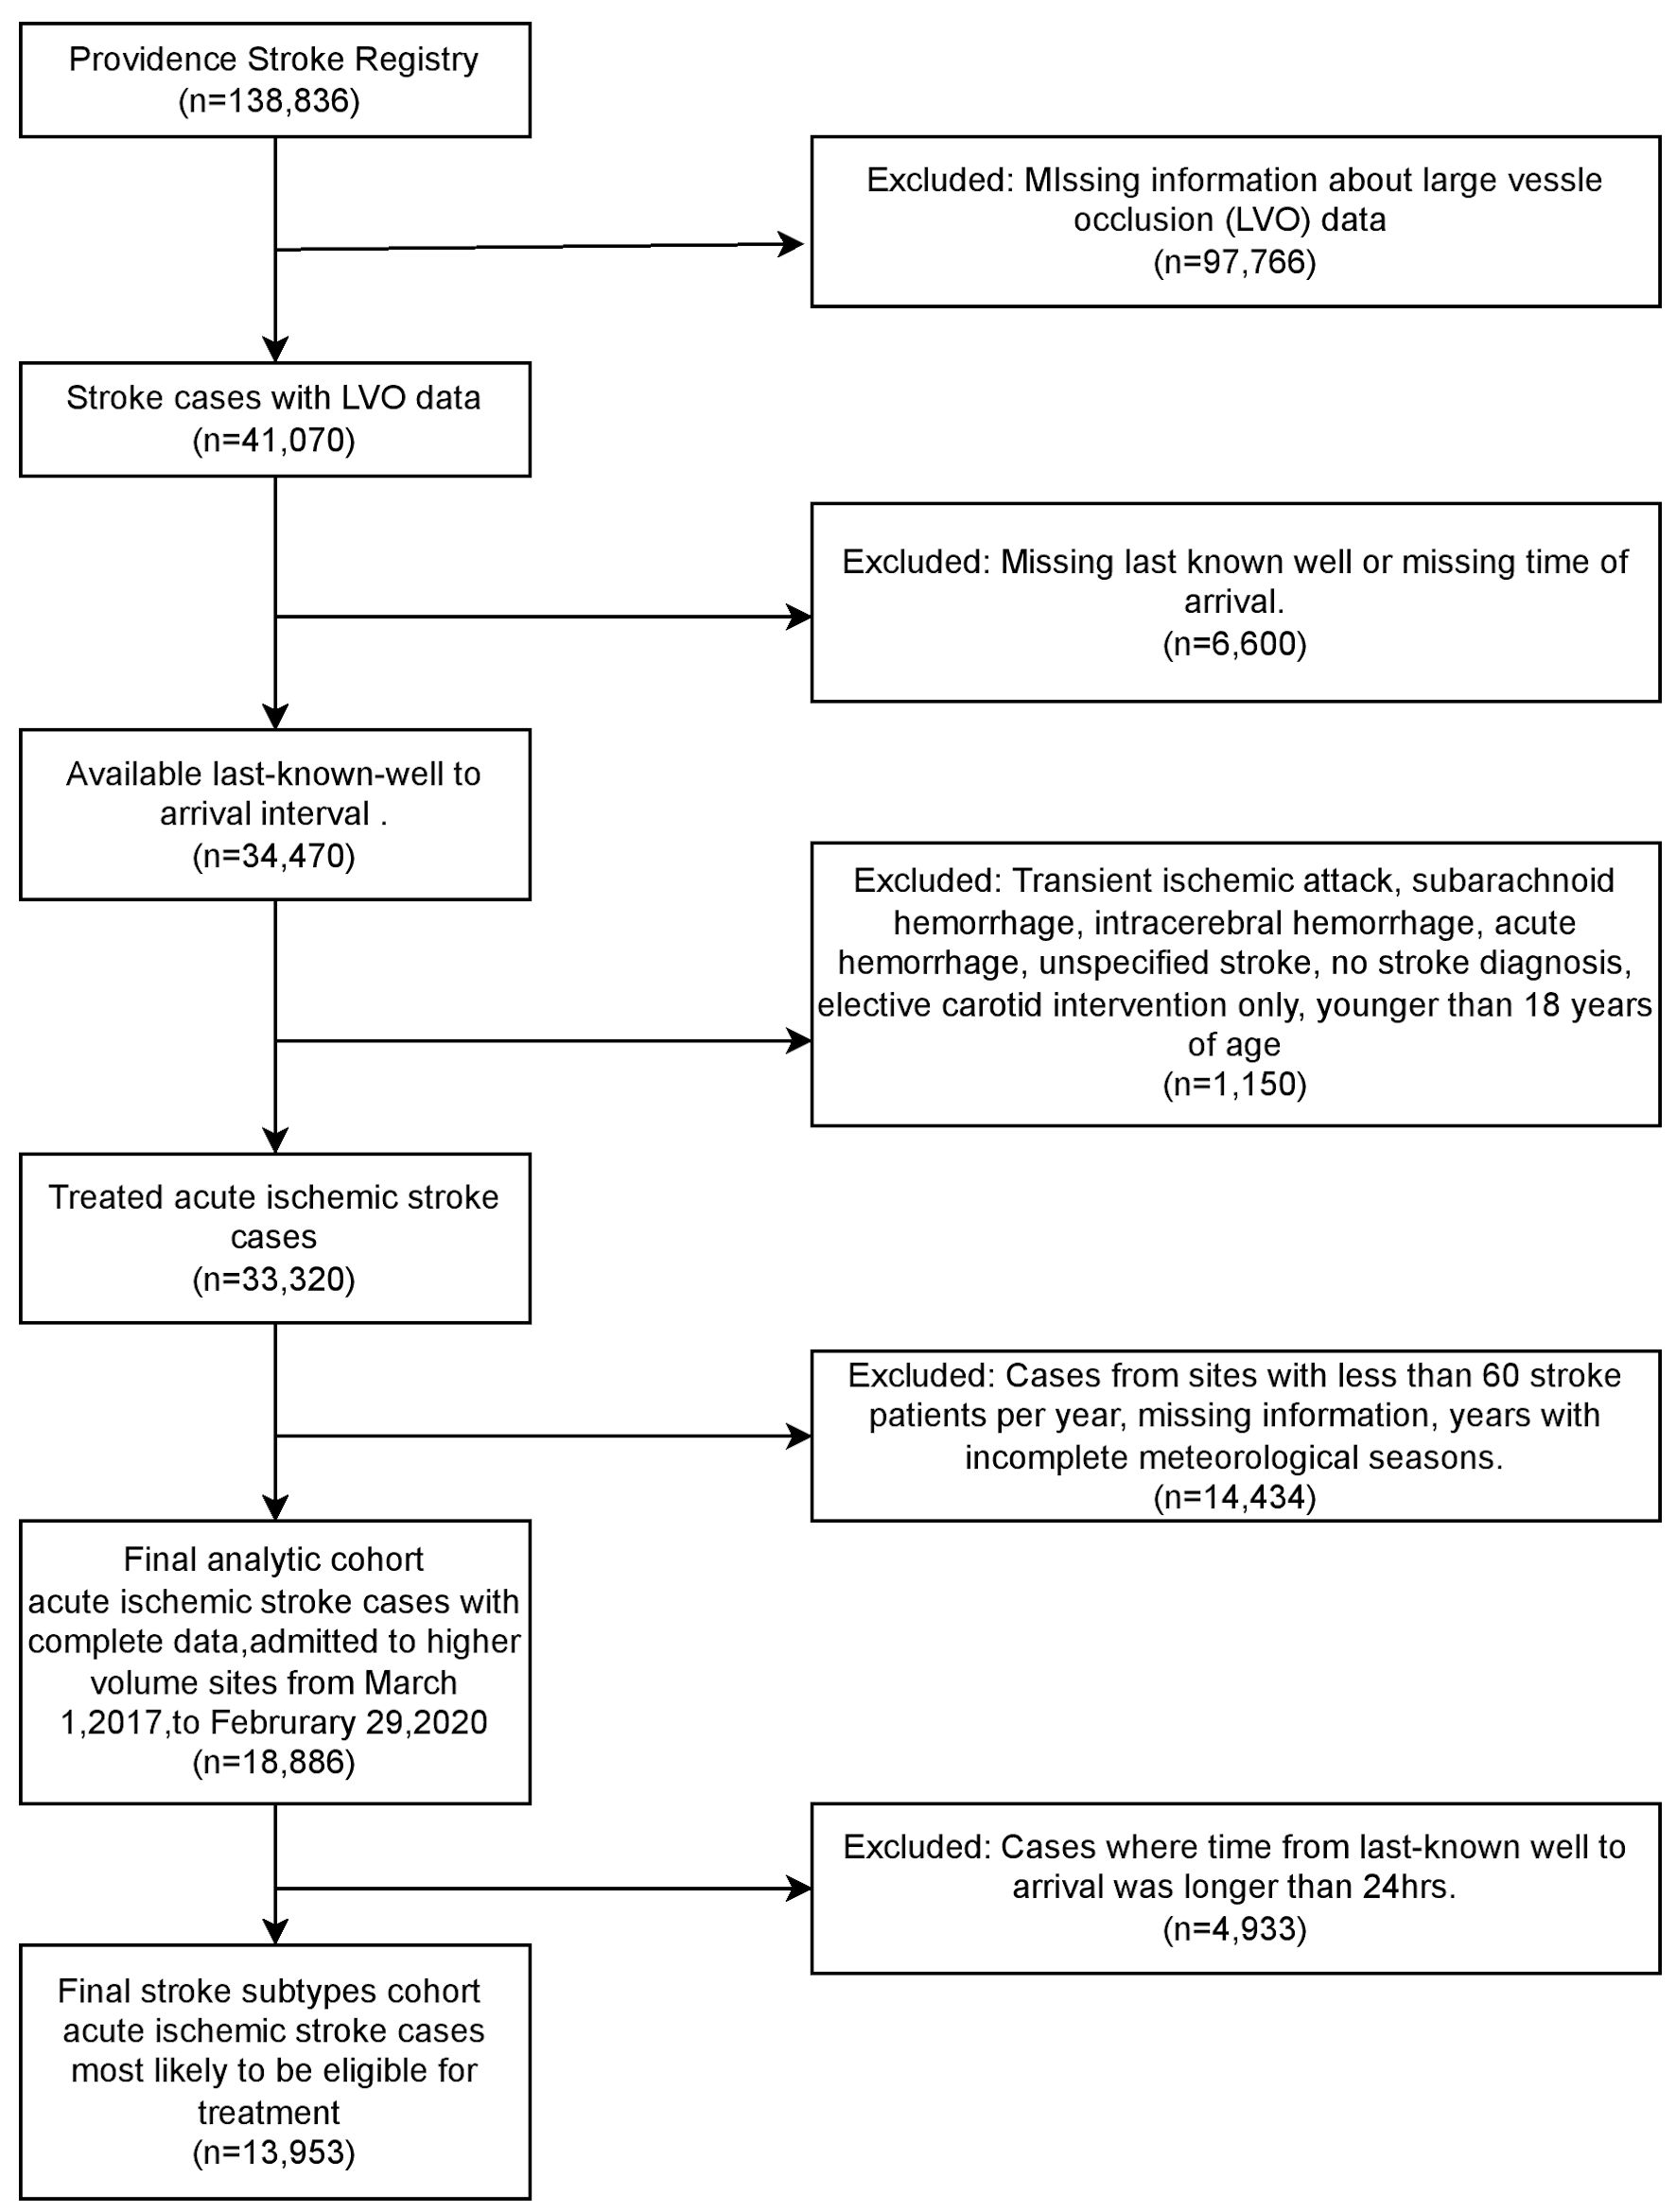
Figure 1. Flow chart of cohort selection. LVO: large vessel occlusion.
| Journal of Neurology Research, ISSN 1923-2845 print, 1923-2853 online, Open Access |
| Article copyright, the authors; Journal compilation copyright, J Neurol Res and Elmer Press Inc |
| Journal website https://www.neurores.org |
Original Article
Volume 13, Number 1, September 2023, pages 33-42
Seasonal Variation in Ischemic Stroke Hospitalization: Results From a Large Health System in Six Western States of the United States
Figures


Tables
| Variables | LVO | Non-LVO | Total population | Spring | Summer | Fall | Winter | P |
|---|---|---|---|---|---|---|---|---|
| 4,382 | 9,571 | 18,886 (100) | 4,565 (24.2) | 4,482 (23.7) | 4,692 (24.8) | 5,247 (27.3) | ||
| aMultiple comorbidities allowed. IQR: interquartile range; LVO: large vessel occlusion. | ||||||||
| Age (years), median (IQR) | 74.0 (20, 103) (21) | 73.0 (18, 108) (21) | 73.0 (18, 108) (21) | 73.0 (18, 106) (20) | 72.0 (21, 108) (20) | 73.0 (19, 103) (21) | 73.0 (19, 107) (21) | 0.25 |
| Sex (female), n (%) | 2,182 (49.8%) | 4,585 (47.9%) | 9,192 (48.7%) | 2,207 (48.3%) | 2,145 (47.9%) | 2,291 (48.8%) | 2,549 (49.5%) | 0.40 |
| Race, n (%) | ||||||||
| Native American/Alaska Native | 39 (0.9%) | 79 (0.8%) | 166 (0.9%) | 52 (1.1%) | 28 (0.6%) | 42 (0.9%) | 44 (0.9%) | 0.22 |
| Asian | 285 (6.5%) | 523 (5.5%) | 1,069 (5.7%) | 267 (5.8%) | 274 (6.1%) | 237 (5.1%) | 291 (5.7%) | |
| Black/African American | 168 (3.8%) | 397 (4.1%) | 771 (4.1%) | 178 (3.9%) | 189 (4.2%) | 192 (4.1%) | 212 (4.1%) | |
| Native Hawaiian/Pacific Islander | 24 (0.5%) | 52 (0.5%) | 108 (0.6%) | 23 (0.5%) | 29 (0.6%) | 28 (0.6%) | 28 (0.5%) | |
| Unable to determine | 430 (9.8%) | 783 (8.2%) | 1,628 (8.6%) | 362 (7.9%) | 378 (8.4%) | 435 (9.3%) | 453 (8.8%) | |
| White | 3,436 (78.4%) | 7,737 (80.8%) | 15,144 (80.2%) | 3,683 (80.7%) | 3,584 (80.0%) | 3,758 (80.1%) | 4,119 (80.0%) | |
| Center certification, n (%) | ||||||||
| None | 340 (7.8%) | 687 (7.2%) | 1,214 (6.4%) | 289 (6.3%) | 255 (5.7%) | 305 (6.5%) | 365 (7.1%) | 0.27 |
| Comprehensive stroke center | 1,804 (41.2%) | 3,317 (34.7%) | 6,594 (34.9%) | 1,617 (35.4%) | 1,553 (34.6%) | 1,624 (34.6%) | 1,800 (35.0%) | |
| Primary stroke center | 1,217 (27.8%) | 3,495 (36.5%) | 6,864 (36.3%) | 1,627 (35.6%) | 1,677 (37.4%) | 1,701 (36.3%) | 1,859 (36.1%) | |
| Thrombectomy capable center | 1,021 (23.3%) | 2,072 (21.6%) | 4,214 (22.3%) | 1,032 (22.6%) | 997 (22.2%) | 1,062 (22.6%) | 1,123 (21.8%) | |
| Region, n (%) | ||||||||
| Alaska | 168 (3.8%) | 436 (4.6%) | 923 (4.9%) | 202 (4.4%) | 275 (6.1%) | 233 (5.0%) | 213 (4.1%) | < 0.001 |
| Montana/Washington/Oregon | 2,261 (51.6%) | 4,721 (49.3%) | 9,939 (52.6%) | 2,499 (54.7%) | 2,383 (53.2%) | 2,484 (52.9%) | 2,573 (50.0%) | |
| California/Texas | 1,953 (44.6%) | 4,414 (46.1%) | 8,024 (42.5%) | 1,864 (40.8%) | 1,824 (40.7%) | 1,975 (42.1%) | 2,361 (45.9%) | |
| Comorbiditya, n (%) | ||||||||
| Atrial fibrillation | 1,422 (32.5%) | 1,950 (20.4%) | 4,241 (22.5%) | 1,042 (22.8%) | 941 (21.0%) | 1,085 (23.1%) | 1,173 (22.8%) | 0.06 |
| Diabetes mellitus | 1,122 (25.6%) | 3,029 (31.6%) | 5,910 (31.3%) | 1,394 (30.5%) | 1,443 (32.2%) | 1,481 (31.6%) | 1,592 (30.9%) | 0.34 |
| Hypertension | 3,137 (71.6%) | 7,134 (74.5%) | 14,039 (74.3%) | 3,382 (74.1%) | 3,327 (74.2%) | 3,506 (74.7%) | 3,824 (74.3%) | 0.91 |
| Dyslipidemia | 2,161 (49.3%) | 5,002 (52.3%) | 9,828 (52.0%) | 2,394 (52.4%) | 2,325 (51.9%) | 2,401 (51.2%) | 2,708 (52.6%) | 0.49 |
| Previous stroke | 974 (22.2%) | 2,666 (27.9%) | 4,986 (26.4%) | 1,224 (26.8%) | 1,144 (25.5%) | 1,265 (27.0%) | 1,353 (26.3%) | 0.40 |
| Obesity/overweight | 2,175 (49.6%) | 4,842 (50.6%) | 9,606 (50.9%) | 2,287 (50.1%) | 2,274 (50.7%) | 2,391 (51.0%) | 2,654 (51.6%) | 0.55 |
| Variables | β | 95% CI | P |
|---|---|---|---|
| aMultiple comorbidities allowed. CI: confidence interval; β: beta coefficient. | |||
| Unadjusted model | |||
| Spring | Reference | ||
| Summer | -0.05 | -0.86, 0.76 | 0.94 |
| Fall | 0.84 | 0.05, 1.6 | 0.04 |
| Winter | 3.60 | 2.7, 4.4 | < 0.001 |
| Adjusted model | |||
| Age (years) | 0.00 | -0.01, 0.01 | 0.91 |
| Sex | |||
| Male | Reference | -0.16, 0.12 | 0.80 |
| Female | -0.02 | ||
| Race | |||
| Native American/Alaska Native | Reference | -1.3, 0.25 | 0.20 |
| Asian | -0.52 | -1.0, 0.49 | 0.50 |
| Black/African American | -0.27 | -1.9, 0.48 | 0.20 |
| Native Hawaiian/Pacific Islander | -0.69 | -0.69, 0.74 | 0.92 |
| Unable to determine | 0.02 | -1.1, 0.32 | 0.30 |
| White | -0.37 | -1.3, 0.25 | 0.20 |
| Center certification | |||
| None | Reference | ||
| Comprehensive stroke center | 0.11 | -0.21, 0.43 | 0.50 |
| Primary stroke center | 0.94 | 0.60, 1.3 | < 0.001 |
| Thrombectomy capable center | 0.59 | 0.23, 1.0 | 0.001 |
| Region | |||
| Alaska | Reference | ||
| Montana/Washington/Oregon | 0.41 | 0.05, 0.77 | 0.03 |
| California/Texas | 1.30 | 0.92, 1.7 | < 0.001 |
| Comorbiditya | |||
| Atrial fibrillation | -0.14 | -0.34, 0.05 | 0.20 |
| Diabetes mellitus | 0.02 | -0.13, 0.17 | 0.80 |
| Hypertension | -0.14 | -0.32, 0.03 | 0.11 |
| Dyslipidemia | 0.29 | 0.13, 0.46 | < 0.001 |
| Previous stroke | -0.24 | -0.40, -0.08 | 0.004 |
| Obesity/overweight | 0.53 | 0.36, 0.69 | < 0.001 |
| Seasons | |||
| Spring | Reference | ||
| Summer | -0.10 | -0.92, 0.71 | 0.80 |
| Fall | 0.66 | -0.14, 1.5 | 0.10 |
| Winter | 3.30 | 2.4, 4.1 | < 0.001 |
| Variables | Large vessel occlusion | Non-large vessel occlusion | ||||
|---|---|---|---|---|---|---|
| Adjusted model | Adjusted model | |||||
| β | 95% CI | P value | β | 95% CI | P value | |
| aMultiple comorbidities allowed. CI: confidence interval; β: beta coefficient. | ||||||
| Unadjusted model | ||||||
| Spring | Reference | Reference | ||||
| Summer | -0.11 | -0.94, 0.71 | 0.80 | -0.10 | -0.88, 0.68 | 0.80 |
| Fall | 0.73 | -0.10, 1.6 | 0.08 | 0.80 | 0.04, 1.6 | 0.04 |
| Winter | 3.40 | 2.6, 4.2 | < 0.001 | 3.50 | 2.6, 4.3 | < 0.001 |
| Adjusted model | ||||||
| Age (years) | 0.00 | -0.01, 0.01 | 0.91 | 0.01 | -0.00, 0.01 | 0.2 |
| Sex | ||||||
| Male | Reference | -0.16, 0.12 | 0.80 | Reference | ||
| Female | -0.02 | 0.10 | -0.11, 0.30 | 0.40 | ||
| Race, n (%) | ||||||
| Native American/Alaska Native | Reference | -1.3, 0.25 | 0.20 | Reference | ||
| Asian | -0.52 | -1.0, 0.49 | 0.50 | -0.43 | -1.45, 0.601 | 0.40 |
| Black/African American | -0.27 | -1.9, 0.48 | 0.20 | 0.06 | -1.06, 1.17 | 0.92 |
| Native Hawaiian/Pacific Islander | -0.69 | -0.69, 0.74 | 0.92 | -0.56 | -2.33, 1.22 | 0.50 |
| Unable to determine | 0.02 | -1.1, 0.32 | 0.30 | 0.42 | -0.62, 1.46 | 0.40 |
| White | -0.37 | -1.3, 0.25 | 0.20 | -0.23 | -1.22, 0.758 | 0.60 |
| Center certification | ||||||
| None | Reference | Reference | ||||
| Comprehensive stroke center | 0.11 | -0.21, 0.43 | 0.50 | -0.37 | -0.81, 0.08 | 0.11 |
| Primary stroke center | 0.94 | 0.60, 1.3 | < 0.001 | 0.62 | 0.16, 1.08 | 0.01 |
| Thrombectomy capable center | 0.59 | 0.23, 1.0 | 0.001 | 0.36 | -0.14, 0.86 | 0.20 |
| Region | ||||||
| Alaska | Reference | Reference | ||||
| Montana/Washington/Oregon | 0.41 | 0.05, 0.77 | 0.03 | 0.07 | -0.43, 0.58 | 0.80 |
| California/Texas | 1.30 | 0.92, 1.7 | < 0.001 | 1.25 | 0.72, 1.78 | < 0.001 |
| Comorbiditya | ||||||
| Atrial fibrillation | -0.14 | -0.34, 0.05 | 0.20 | -0.26 | -0.54, 0.02 | 0.06 |
| Diabetes mellitus | 0.02 | -0.13, 0.17 | 0.80 | -0.14 | -0.36, 0.09 | 0.20 |
| Hypertension | -0.14 | -0.32, 0.03 | 0.11 | -0.23 | -0.48, 0.02 | 0.07 |
| Dyslipidemia | 0.29 | 0.13, 0.46 | < 0.001 | 0.49 | 0.27, 0.72 | < 0.001 |
| Previous stroke | -0.24 | -0.40, -0.08 | 0.004 | -0.31 | -0.53, -0.08 | 0.007 |
| Obesity/overweight | 0.53 | 0.36, 0.69 | < 0.001 | 0.66 | 0.45, 0.87 | < 0.001 |
| Season | ||||||
| Spring | Reference | Reference | ||||
| Summer | -0.13 | -1.10, 0.81 | 0.80 | -0.14 | -0.95, 0.66 | 0.70 |
| Fall | 0.56 | -0.41, 1.5 | 0.30 | 0.712 | -0.084, 1.51 | 0.08 |
| Winter | 3.20 | 2.20, 4.10 | < 0.001 | 3.25 | 2.40, 4.10 | < 0.001 |