Figures
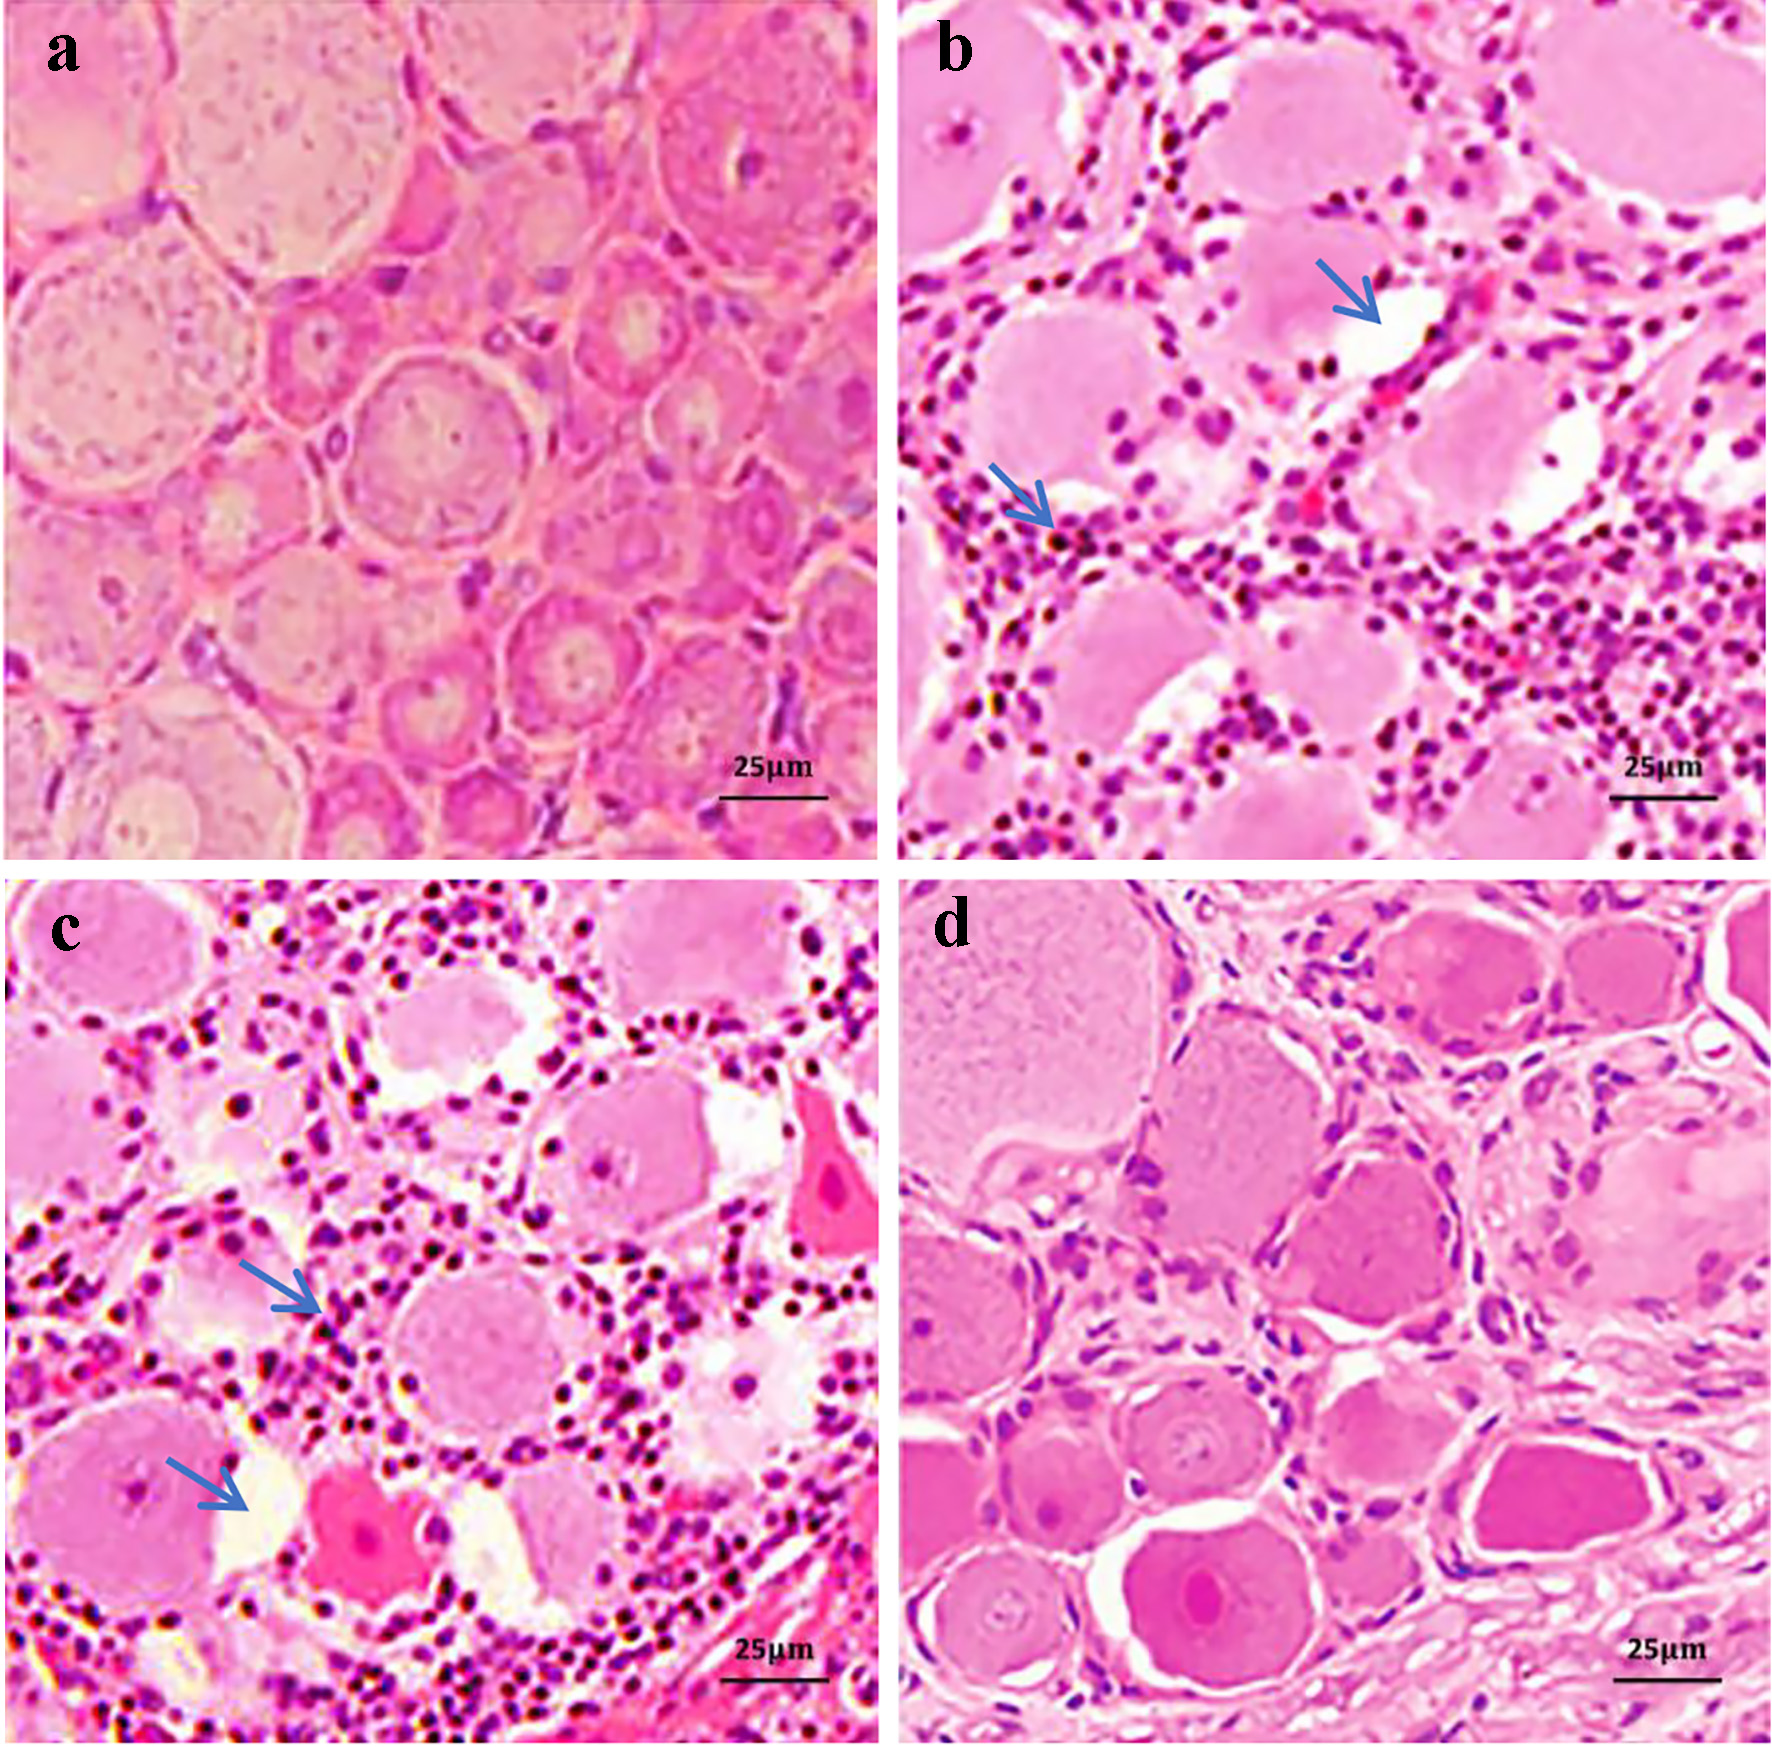
Figure 1. Hematoxylin-eosin (H&E) staining of L5 dorsal root ganglia (DRG) tissues in various treatment groups. In the sodium pyruvate (PYR) group, the DRG neurons showed only mild swelling and a small amount of cytoplasm vacuoles. In the suspension (SUS) and normal saline (SAL) groups, the neurons presented quite swelling, gap widened in varying degrees and some cytoplasmic vacuoles and there were numerous fine granular basophilic materials among the cells, as shown by arrows at cytoplasmic vacuoles and basophilic granules, respectively. The cell morphological appearance in group PYR was slightly changed in comparison with that in control (CON) group (scale bars 25 µm). (a) Group CON. (b) Group SUS. (c) Group SAL. (d) Group PYR.
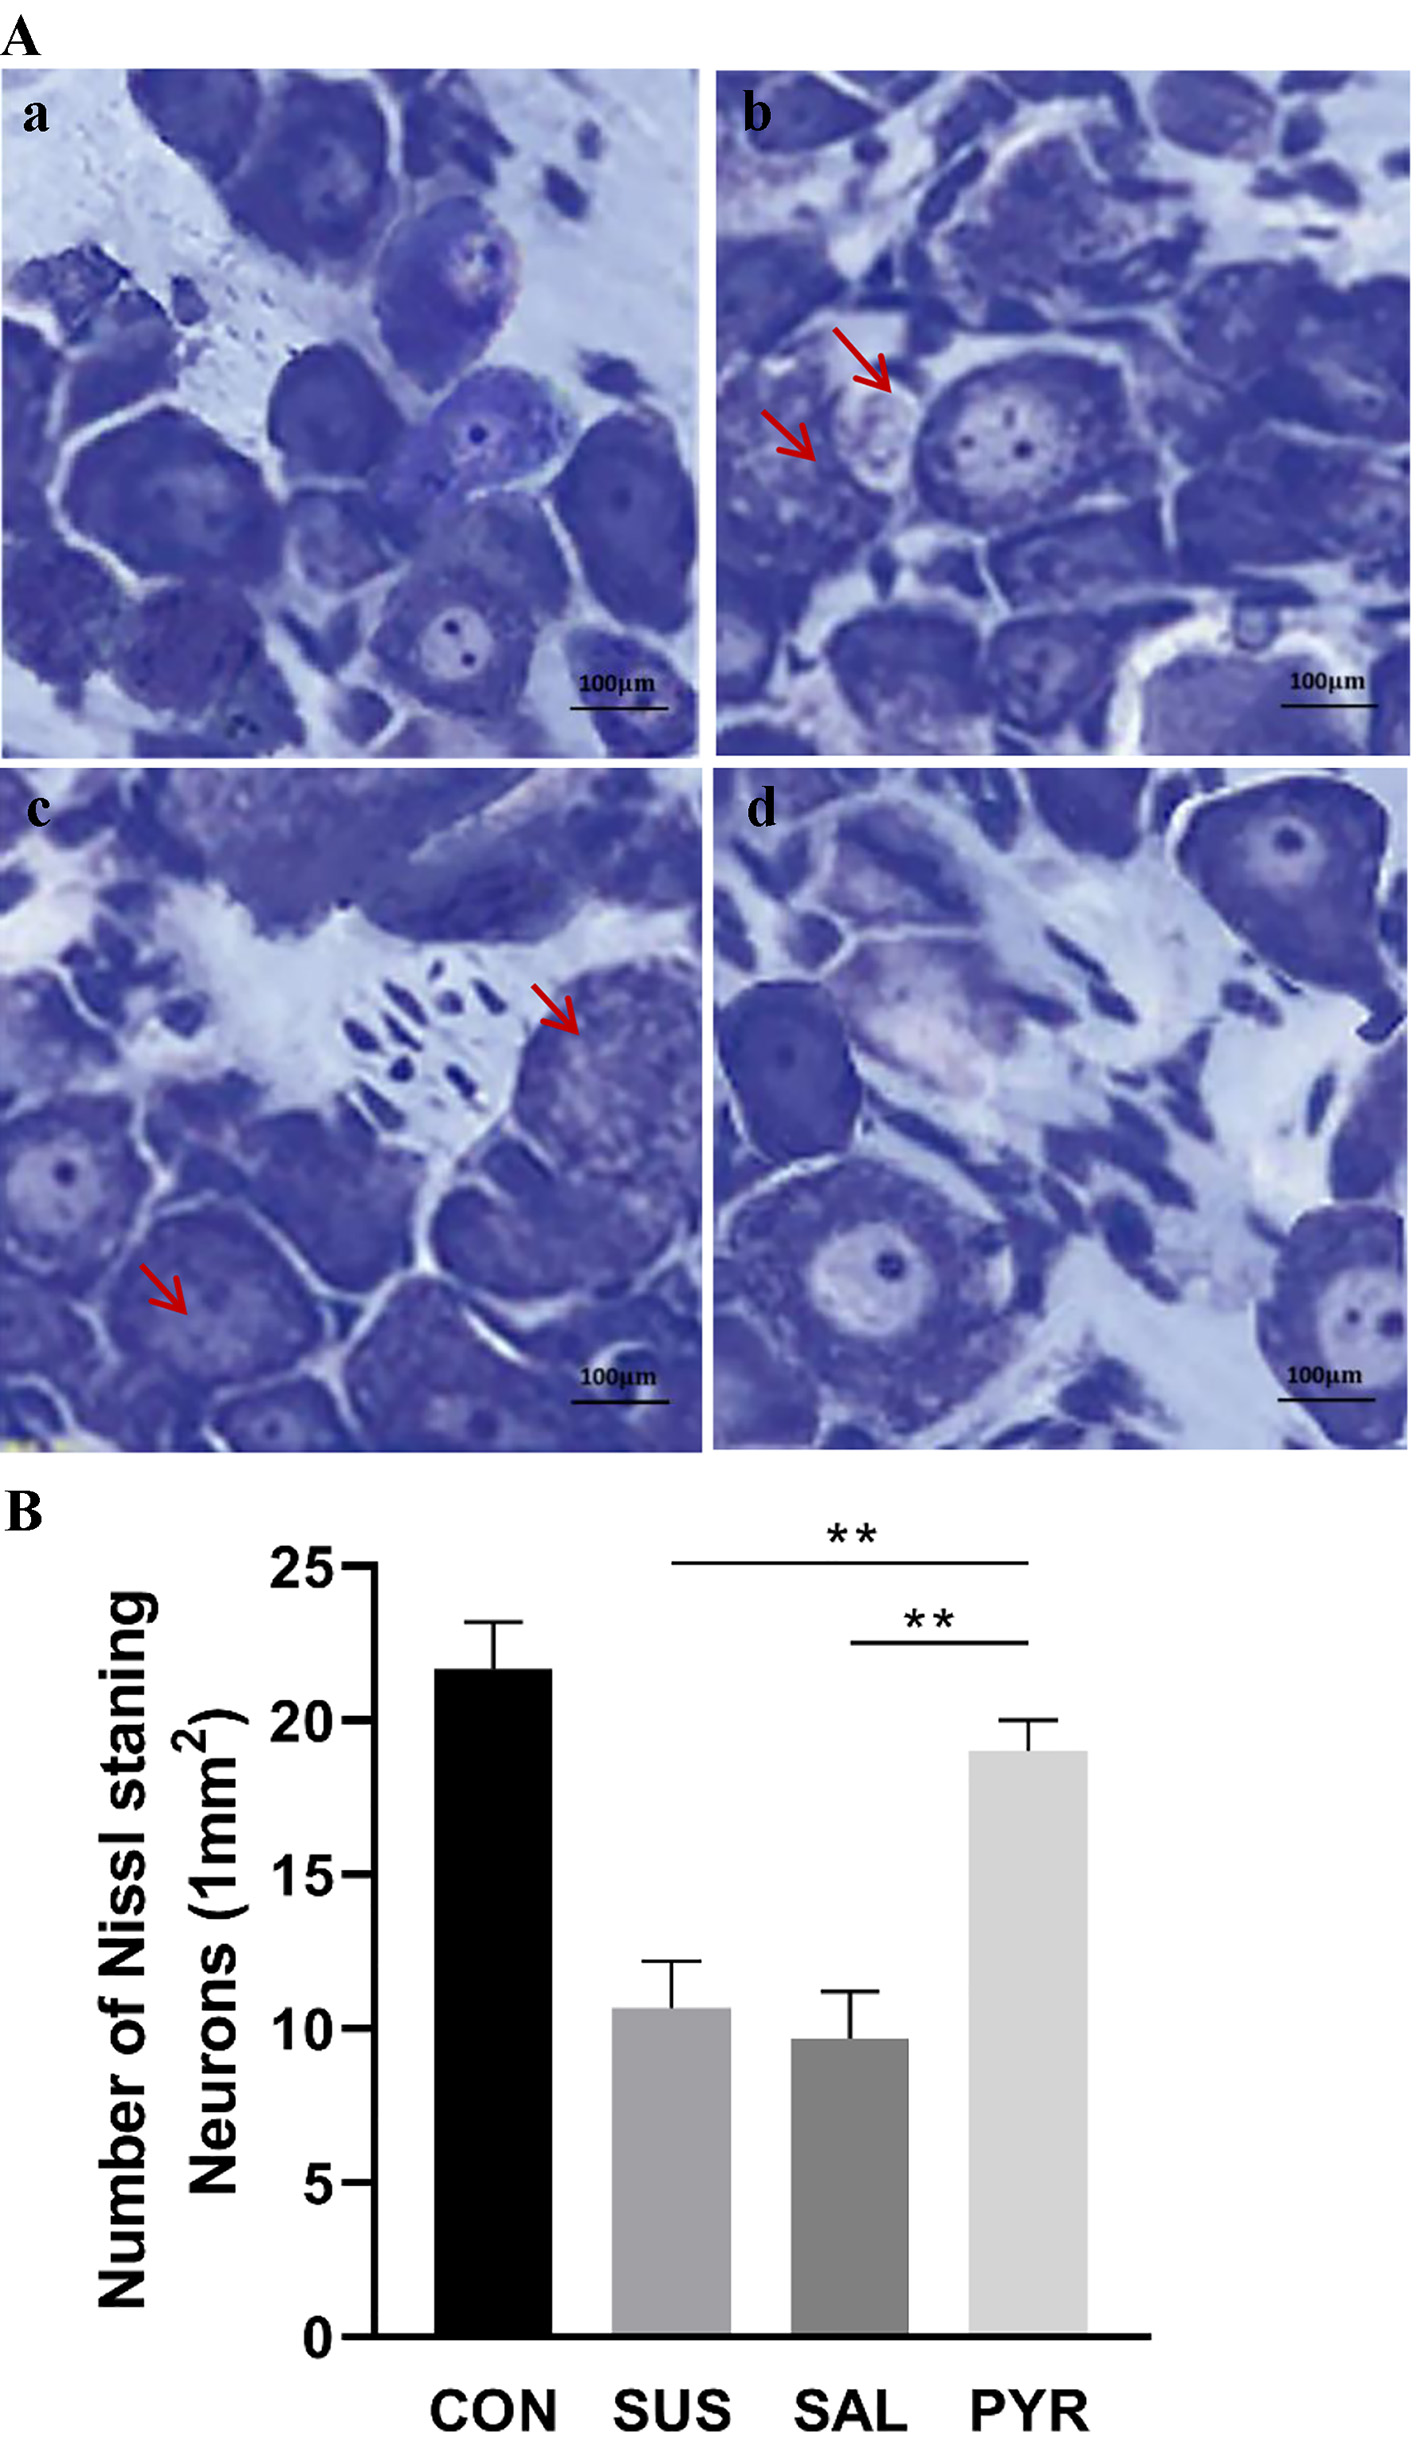
Figure 2. (A) Toluidine blue staining of Nissl bodies in L5 dorsal root ganglia (DRG) neurons in various treatment groups. In the control (CON) and sodium pyruvate (PYR) groups, Nissl basophilic granules were abundant with near normal appearance. However, in the suspension (SUS) and normal saline (SAL) groups, the Nissl bodies were lightly stained with smaller morphological sizes and scattered distribution. In some DRG neurons, the Nissl bodies also appeared disassociated in groups SUS and SAL, as shown by arrows (scale bars 100 µm). (a) Group CON. (b) Group SUS. (c) Group SAL. (d) Group PYR. (B) Quantified analysis of Nissl body staining in various treatment groups. The amounts of Nissl-stained neurons/1.0 mm2 in five random fields were semi-quantified by using a light microscope (× 400; five section slices were evaluated in average from bilateral DRG in each rat; N = 10 per group). The observed and quantified changes were more obvious in the SUS and SAL groups than in the CON and PYR groups and there was no significant difference in numbers of Nissl body staining neurons between groups CON and PYR. There were statistically significant differences between groups SUS and SAL from group PYR, respectively (**P < 0.01).
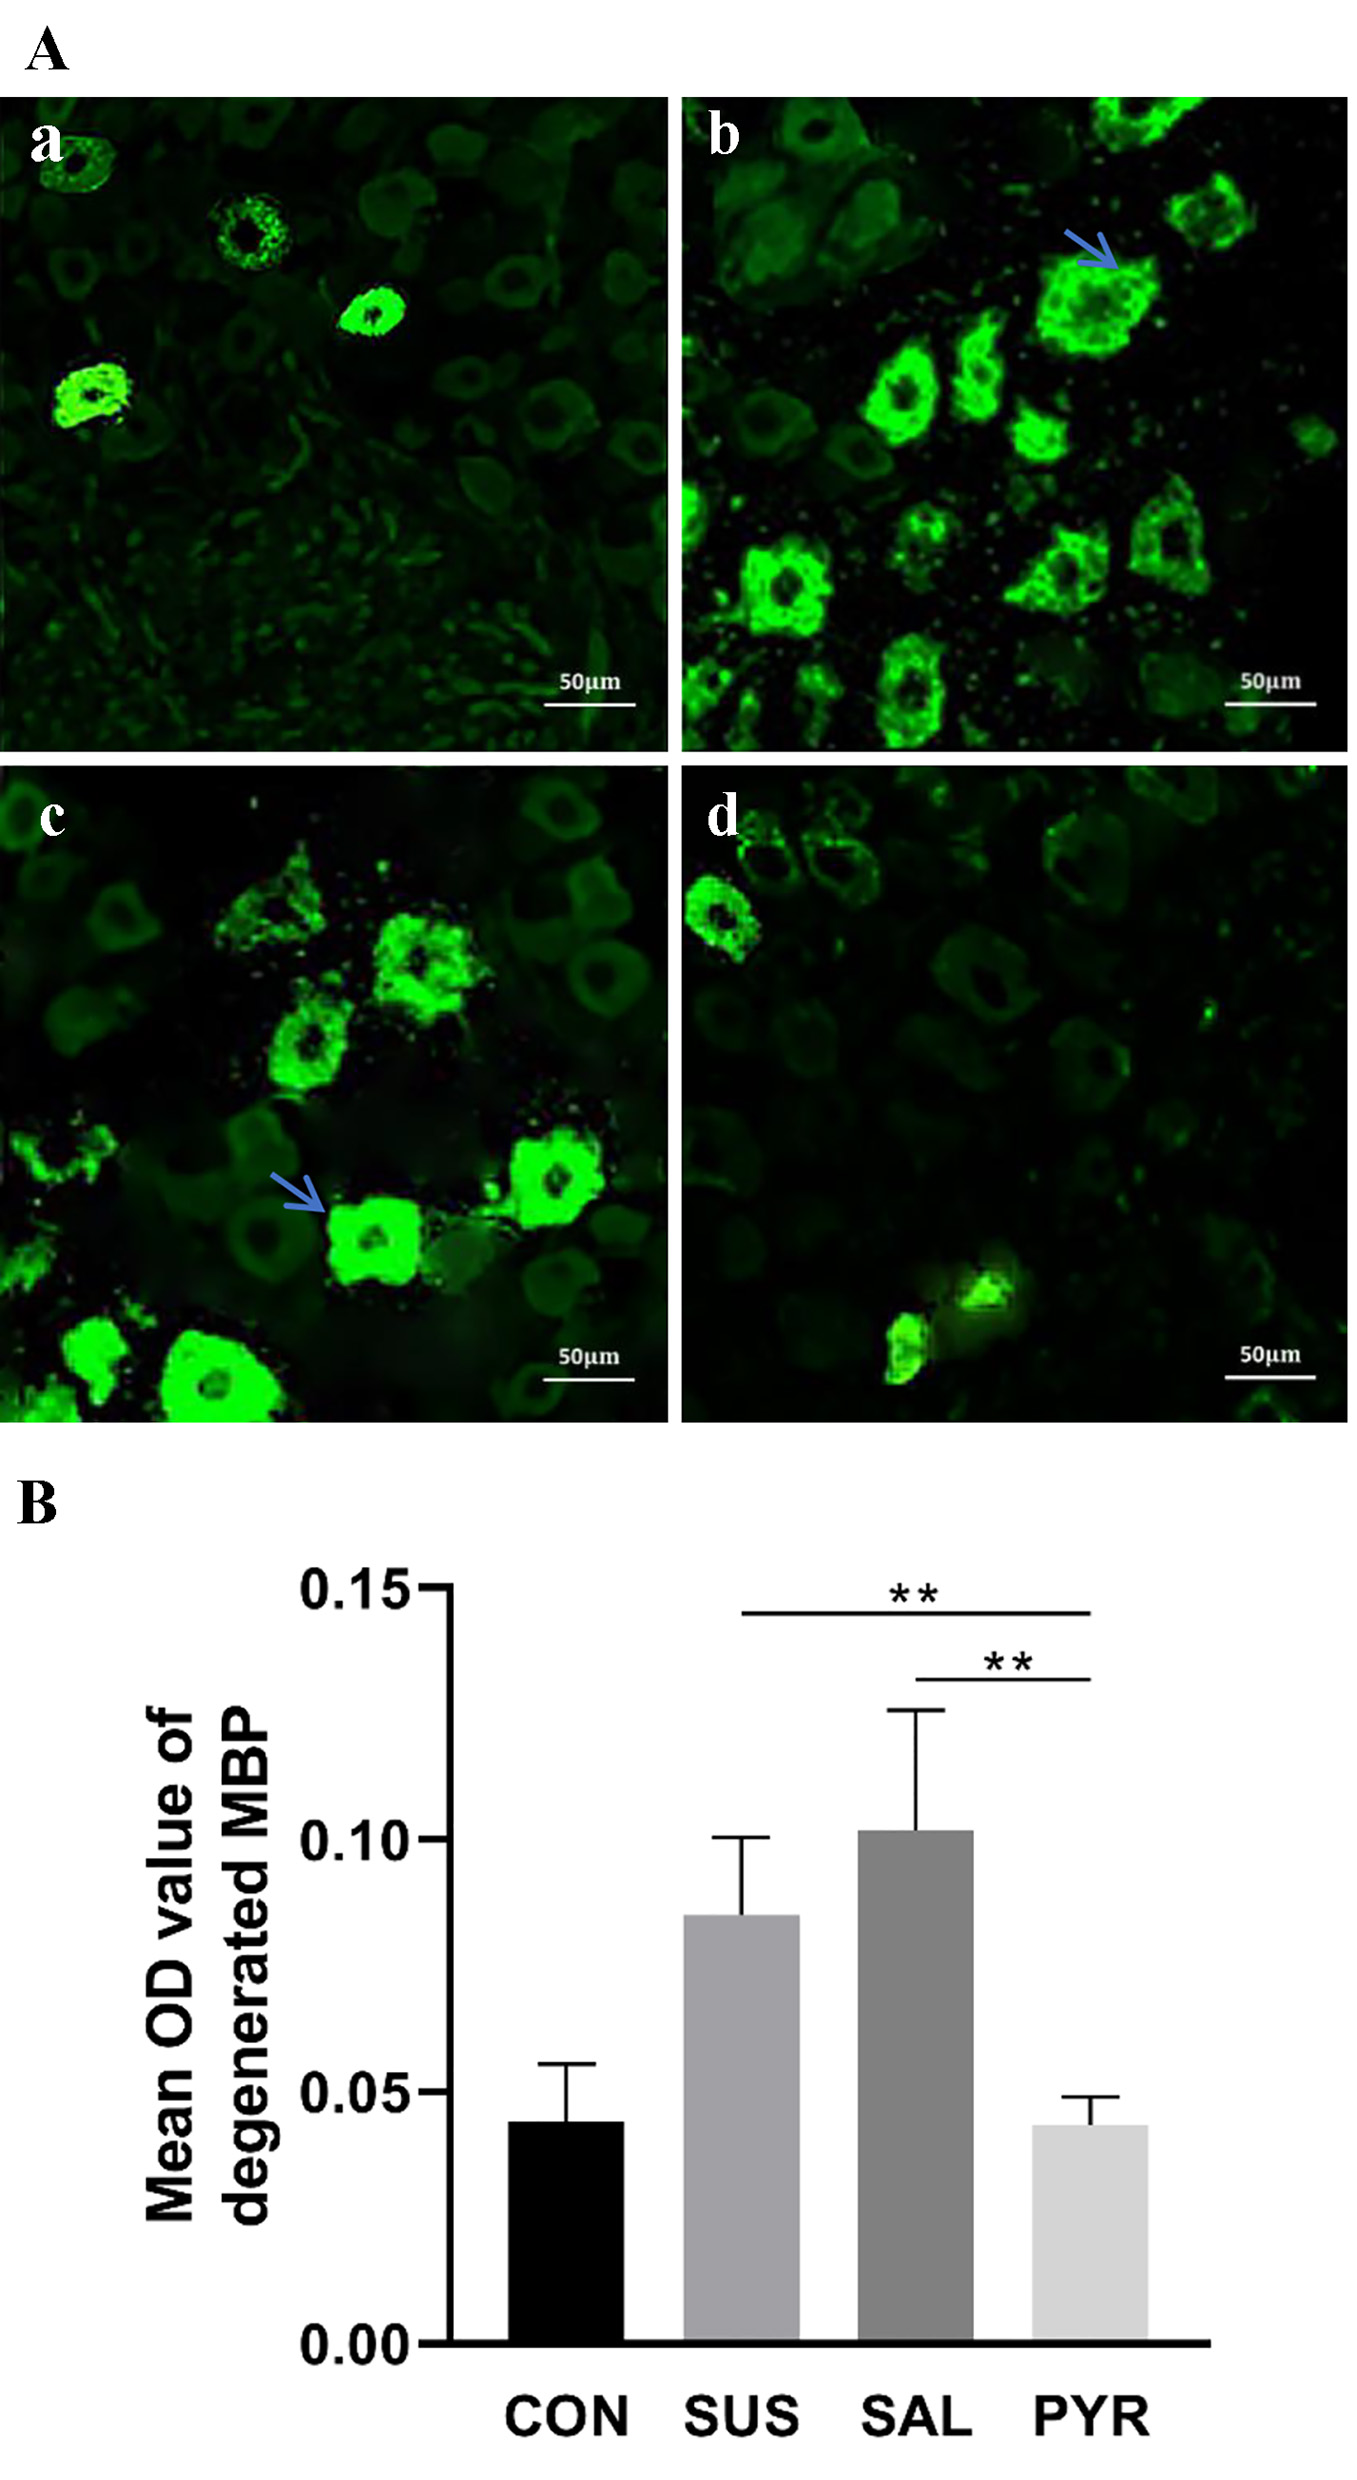
Figure 3. (A) Immunofluorescence detection of L5 dorsal root ganglia (DRG) degenerated myelin basic protein (dgen-MBP) in various treatment groups. The suspension (SUS) and normal saline (SAL) groups showed more expressions of immunofluorescent intensity of dgen-MBP than those in the control (CON) and sodium pyruvate (PYR) groups, as shown by arrows (scale bars 50 µm). (a) Group CON. (b) Group SUS. (c) Group SAL. (d) Group PYR. (B) Mean optical density (OD) value of dgen-MBP in various treatment groups. The immunofluorescent intensity of dgen-MBP was semi-quantitively determined in average from five slices with optimal staining randomly chosen from bilateral DRG per rat (N = 10 per group). Mean OD values of dgen-MBP immunofluorescence staining in L5 DRG were higher in groups SUS and SAL than in groups CON and PYR. There were statistically significant differences between groups SUS and SAL from group PYR, respectively (**P < 0.01).
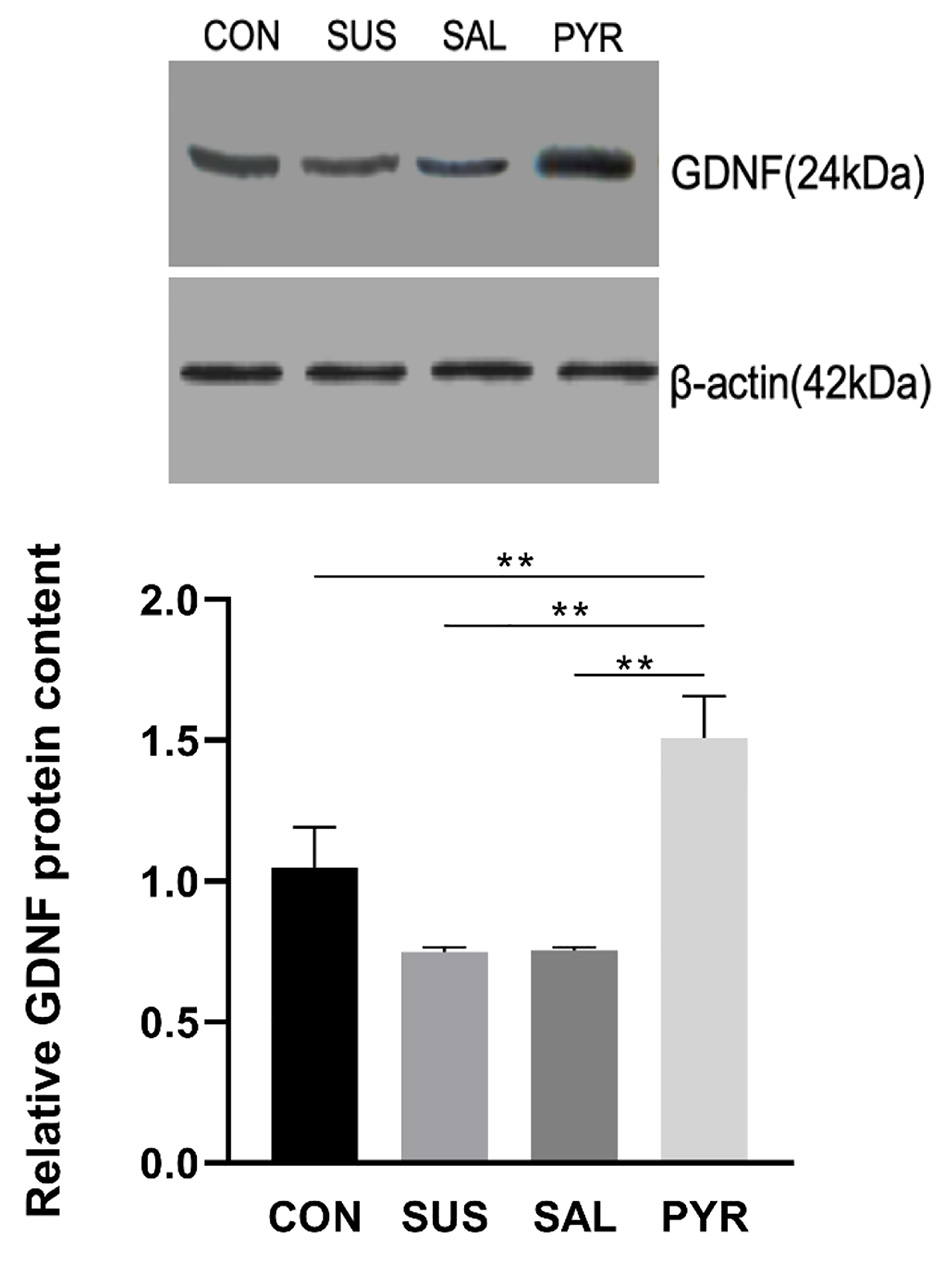
Figure 4. Relative glial cell line-derived neurotrophic factor (GDNF) expressions by Western blotting in L5 dorsal root ganglia (DRG) neurons in various treatment groups. Simulated microgravity induced significant reduction in GDNF expressions. There were statistically significant differences between the suspension (SUS) and normal saline (SAL) groups from the control (CON) and sodium pyruvate (PYR) groups (n = 20 per group). However, the protein content was significantly higher in group PYR than in group CON. There were statistically significant differences between groups CON, SUS and SAL from group PYR, respectively (**P < 0.01).
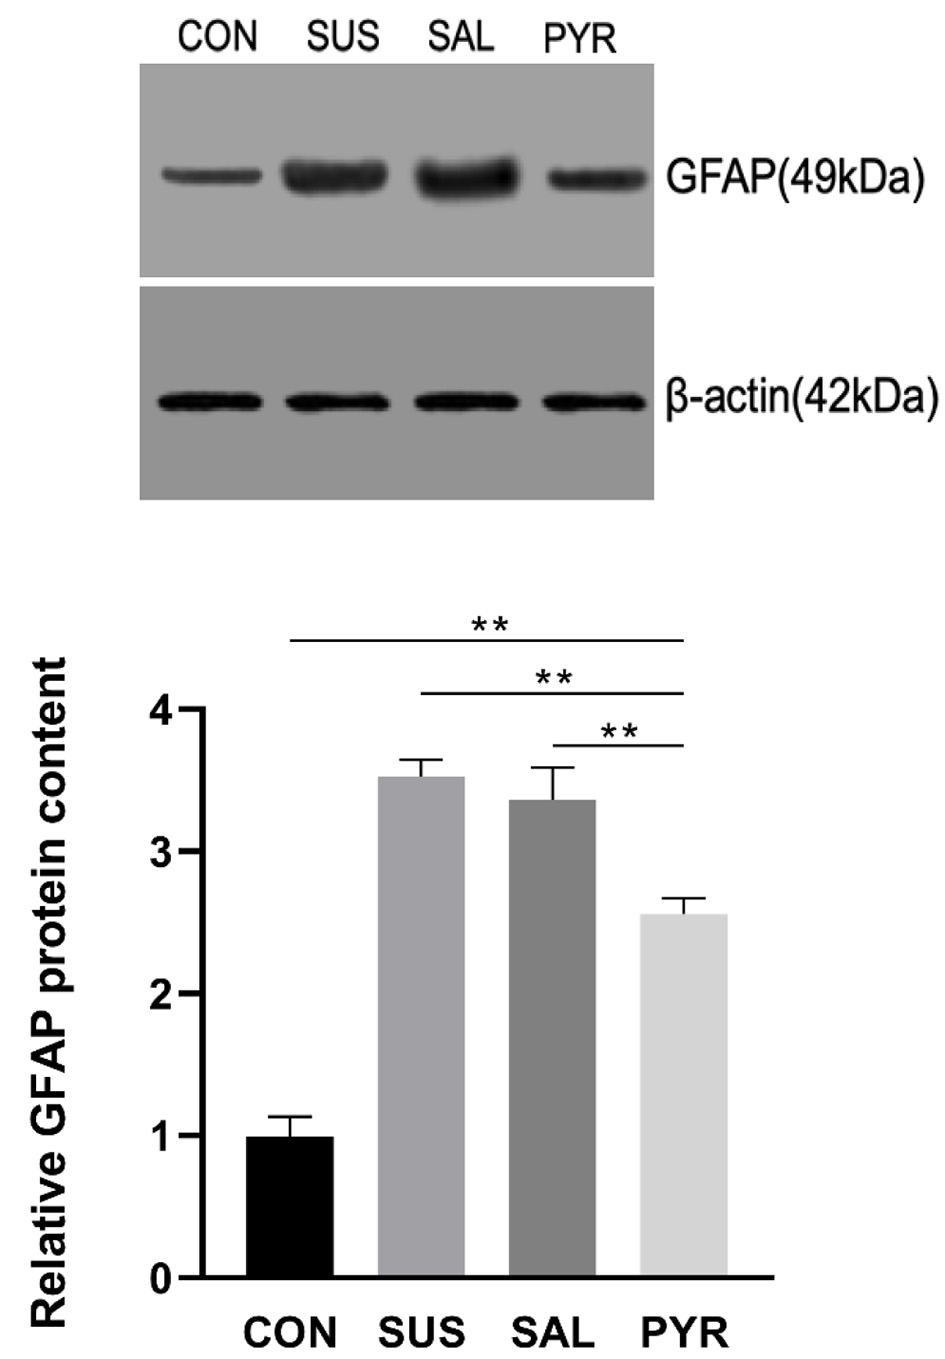
Figure 5. Relative glial fibrillary acidic protein (GFAP) expressions by Western blotting in L5 dorsal root ganglia (DRG) tissues in various treatment groups. The GFAP protein expressions were significantly increased in all three suspension groups. There were statistically significant differences between groups suspension (SUS) and normal saline (SAL) from groups control (CON) and sodium pyruvate (PYR) (n = 20 per group). Notably, the GFAP level was robustly reduced relative to groups SUA and SAL, but still significantly higher in group PYR than in group CON. There were statistically significant differences between CON, SUS and SAL from group PYR, respectively (**P < 0.01).
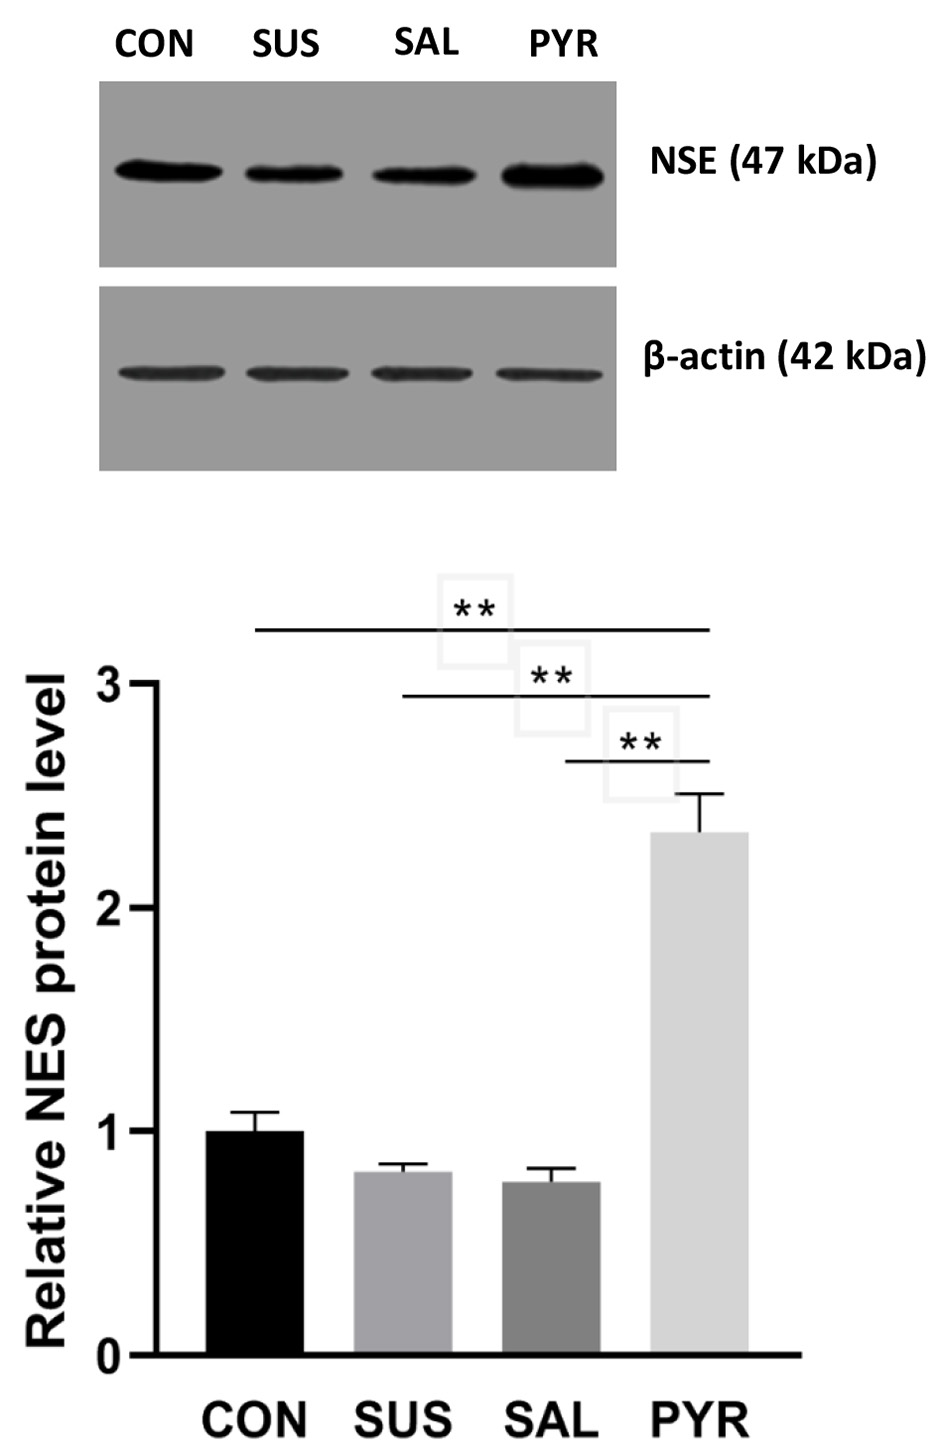
Figure 6. Relative neuron-specific enolase (NES) expressions by Western blotting in L5 dorsal root ganglia (DRG) nerve cells in various treatment groups. The NES protein expression was very significantly enhanced in group sodium pyruvate (PYR) relative to groups control (CON), suspension (SUS) and normal saline (SAL), respectively (n = 20 per group; **P < 0.01). There were not significant differences among group CON, SUS and SAL though the expressions were lower in groups SUS and SAL relative to group CON, respectively.
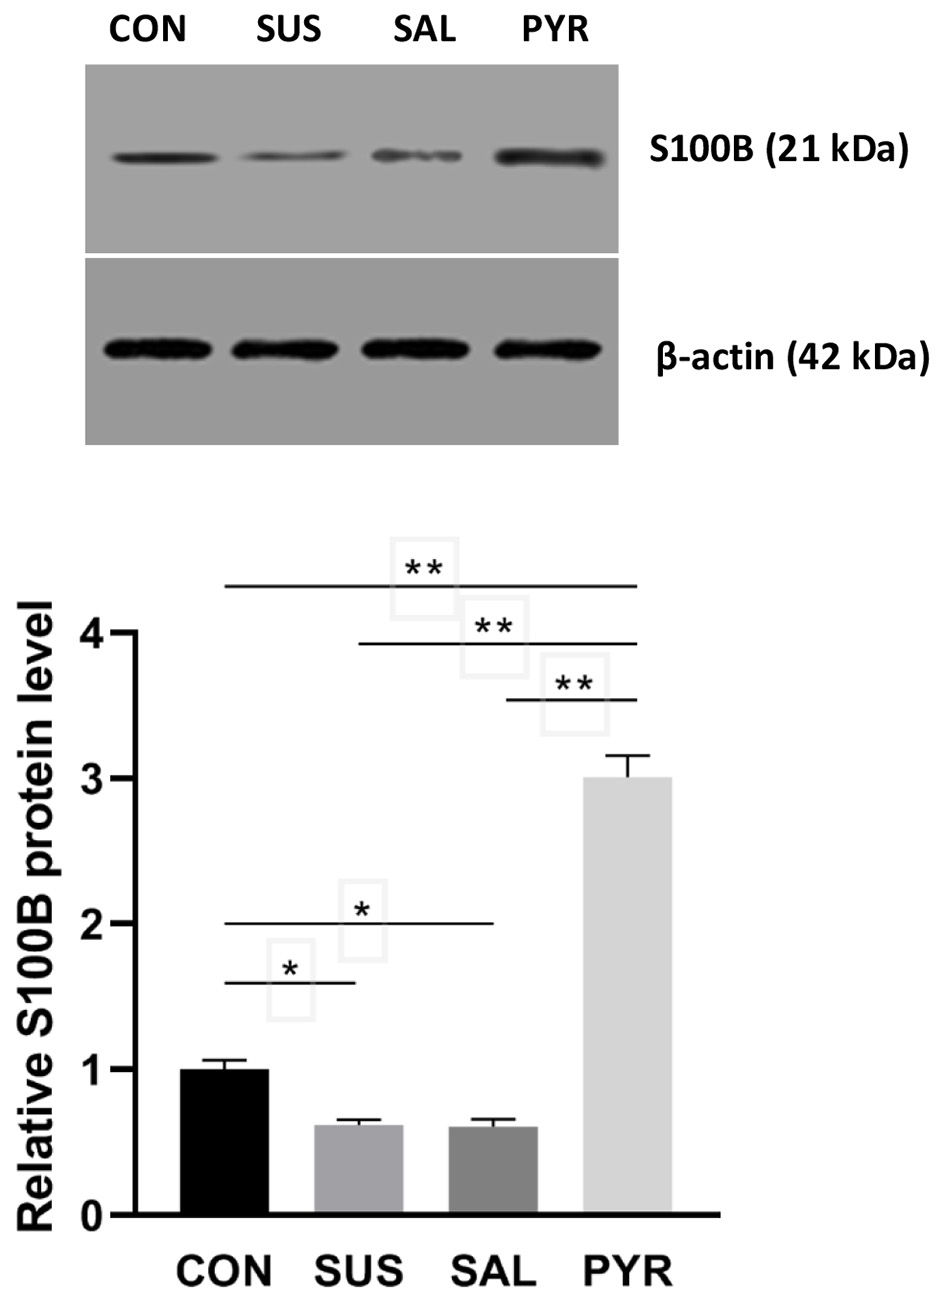
Figure 7. Relative S100 calcium-binding protein B (S100B) expressions by Western blotting in L5 dorsal root ganglia (DRG) nerve cells in various treatment groups. The S100B protein expression was very significantly increased in group sodium pyruvate (PYR) relative to groups control (CON), suspension (SUS) and normal saline (SAL), respectively (n = 20 per group; **P < 0.01), whereas the expressions in group SUS and SAL were significantly decreased relative to group CON, respectively (*P < 0.05), but no difference was seen between group SUS and group SAL.
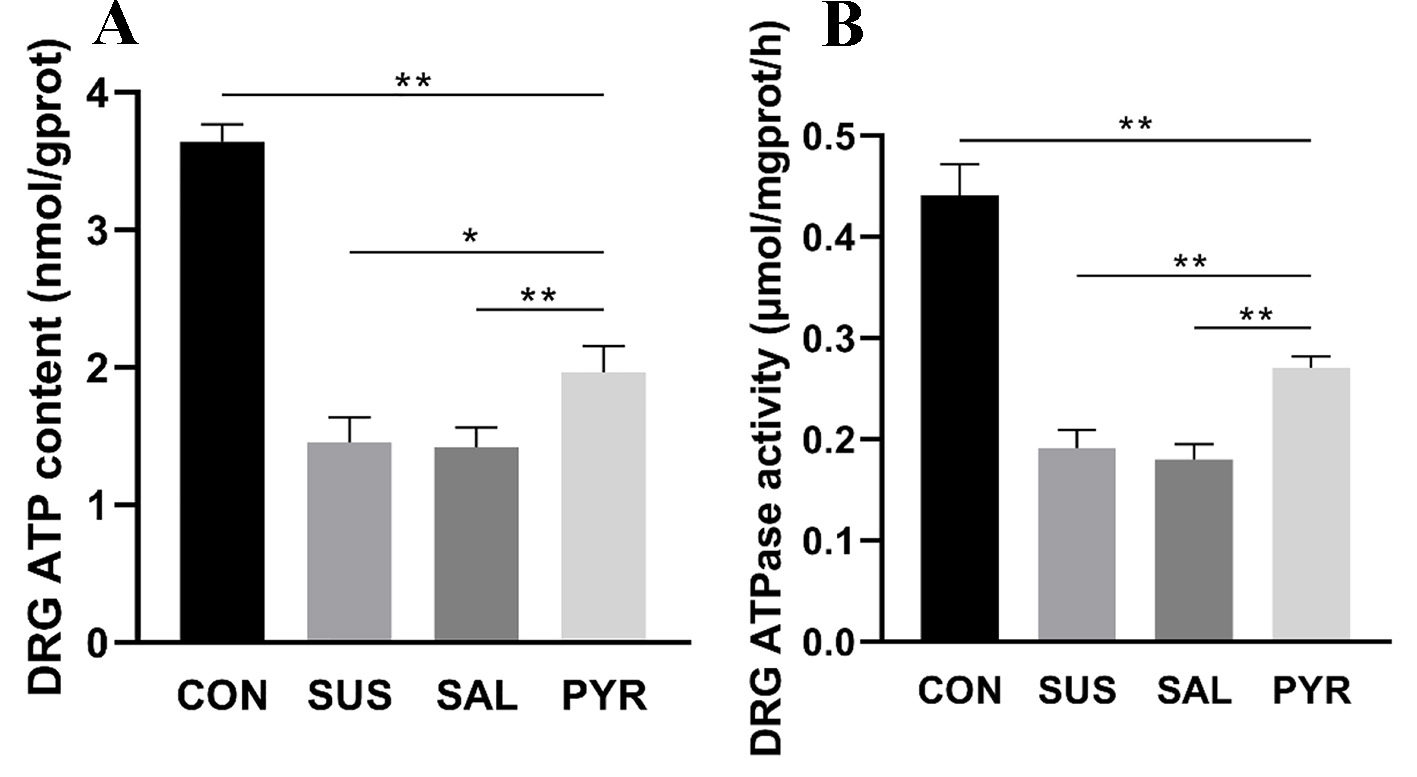
Figure 8. (A) Adenosine triphosphate (ATP) contents in L5 dorsal root ganglia (DRG) tissues in various treatment groups. The ATP contents were decreased in all three suspension groups. There were statistically significant differences between groups suspension (SUS) and normal saline (SAL) from groups control (CON) and sodium pyruvate (PYR) (n = 20 per group). However, the ATP level was still significantly lower in group PYR compared with group CON. There was a statistically significant difference between groups SUS and SAL from group PYR, respectively (*P < 0.05; **P < 0.01). (B) Adenosine triphosphatase (ATPase) activities in L5 DRG tissues in various treatment groups. The ATPase activity was reduced in all three suspension groups. There were statistically significant differences between the SUS and SAL groups from the CON and PYR groups (n = 20 per group). However, the ATPase activity in group PYR was still significantly reduced relative to group CON. There were statistically significant differences between groups CON, SUS and SAL from group PYR, respectively (**P < 0.01).