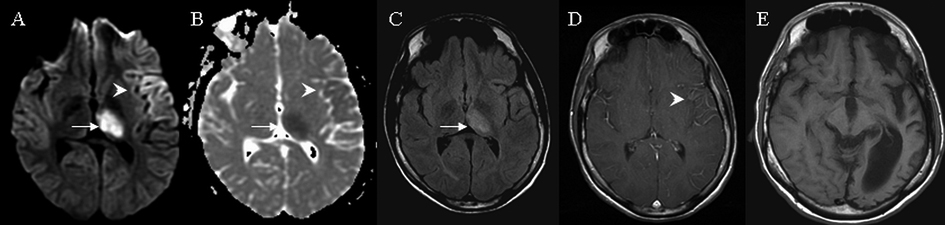
Figure 1. MRI brain findings on case 1. Arrows indicate signal abnormalities at the thalamus. Arrowheads indicate signal abnormalities at the cortex. On day 3 hyperintense signals were seen in the entire left thalamus and gyriform hyperintensities were seen at the left frontotemporal area on diffusion weighted image (A) with corresponding hypointensities on apparent diffusion coefficient (B). Subtle hyperintensities in the left thalamus was seen on fluid attenuated inversion recovery (C) and subtle leptomeningeal enhancement was observed in the left frontotemporal area on T1 weighted image with contrast (D). At nine months T1 weighted image indicated significant left hemispheric atrophy (E).
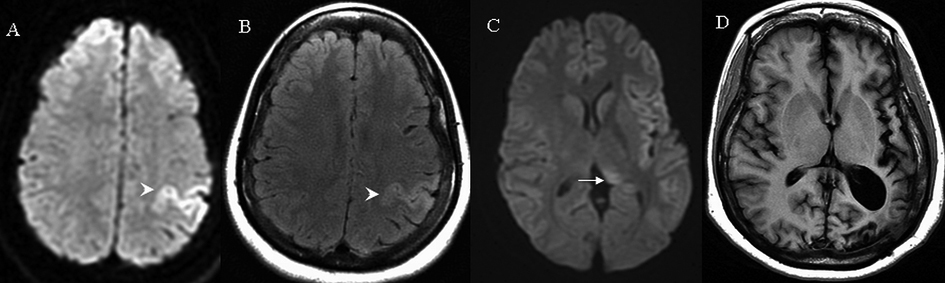
Figure 2. MRI brain findings on case 2. Arrows indicate signal abnormalities at the thalamus. Arrowheads indicate signal abnormalities at the cortical region. On day 1 hyperintensities in the left frontal and parietal cortex were seen on diffusion weighted image (A) and fluid attenuated inversion recovery (B). On day 14, subtle hyperintensities were seen at the left posterior thalamus on diffusion weight image (C). At two years T1 weighted image indicated significant left hemispheric atrophy (D).
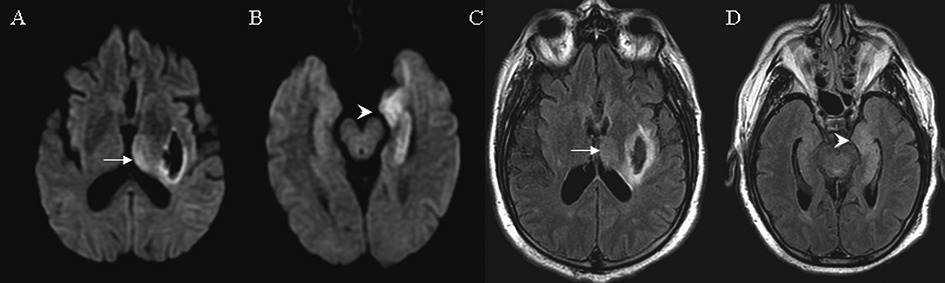
Figure 3. MRI findings on case 3. Arrows indicate signal abnormalities at the thalamus. Arrowheads indicate signal abnormalities at the cortical region. On day 3 diffusion weight image showed hyperintensities in the left thalamus (A) and left medial temporal lobe (B). Similar hyperintensities were seen on FLAIR in the left thalamus (C) and left medial temporal lobe (D). Signal changes in the left lenticular nucleus represent an acute hemorrhage (A, C).
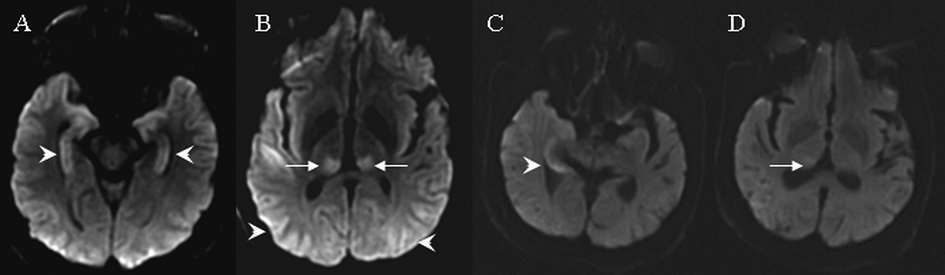
Figure 4. MRI findings on cases 4 and 5. Arrows indicate signal abnormalities at the thalamus. Arrowheads indicate signal abnormalities at the cortical region. In case 4, diffusion weight images showed hyperintensities in the bilateral hippocampus (A), bilateral parietooccipital cortex and bilateral posterior thalamus (B). In case 5, diffusion weighted images showed hyperintensities in the right medial temporal lobe (C) and right posterior thalamus (D).