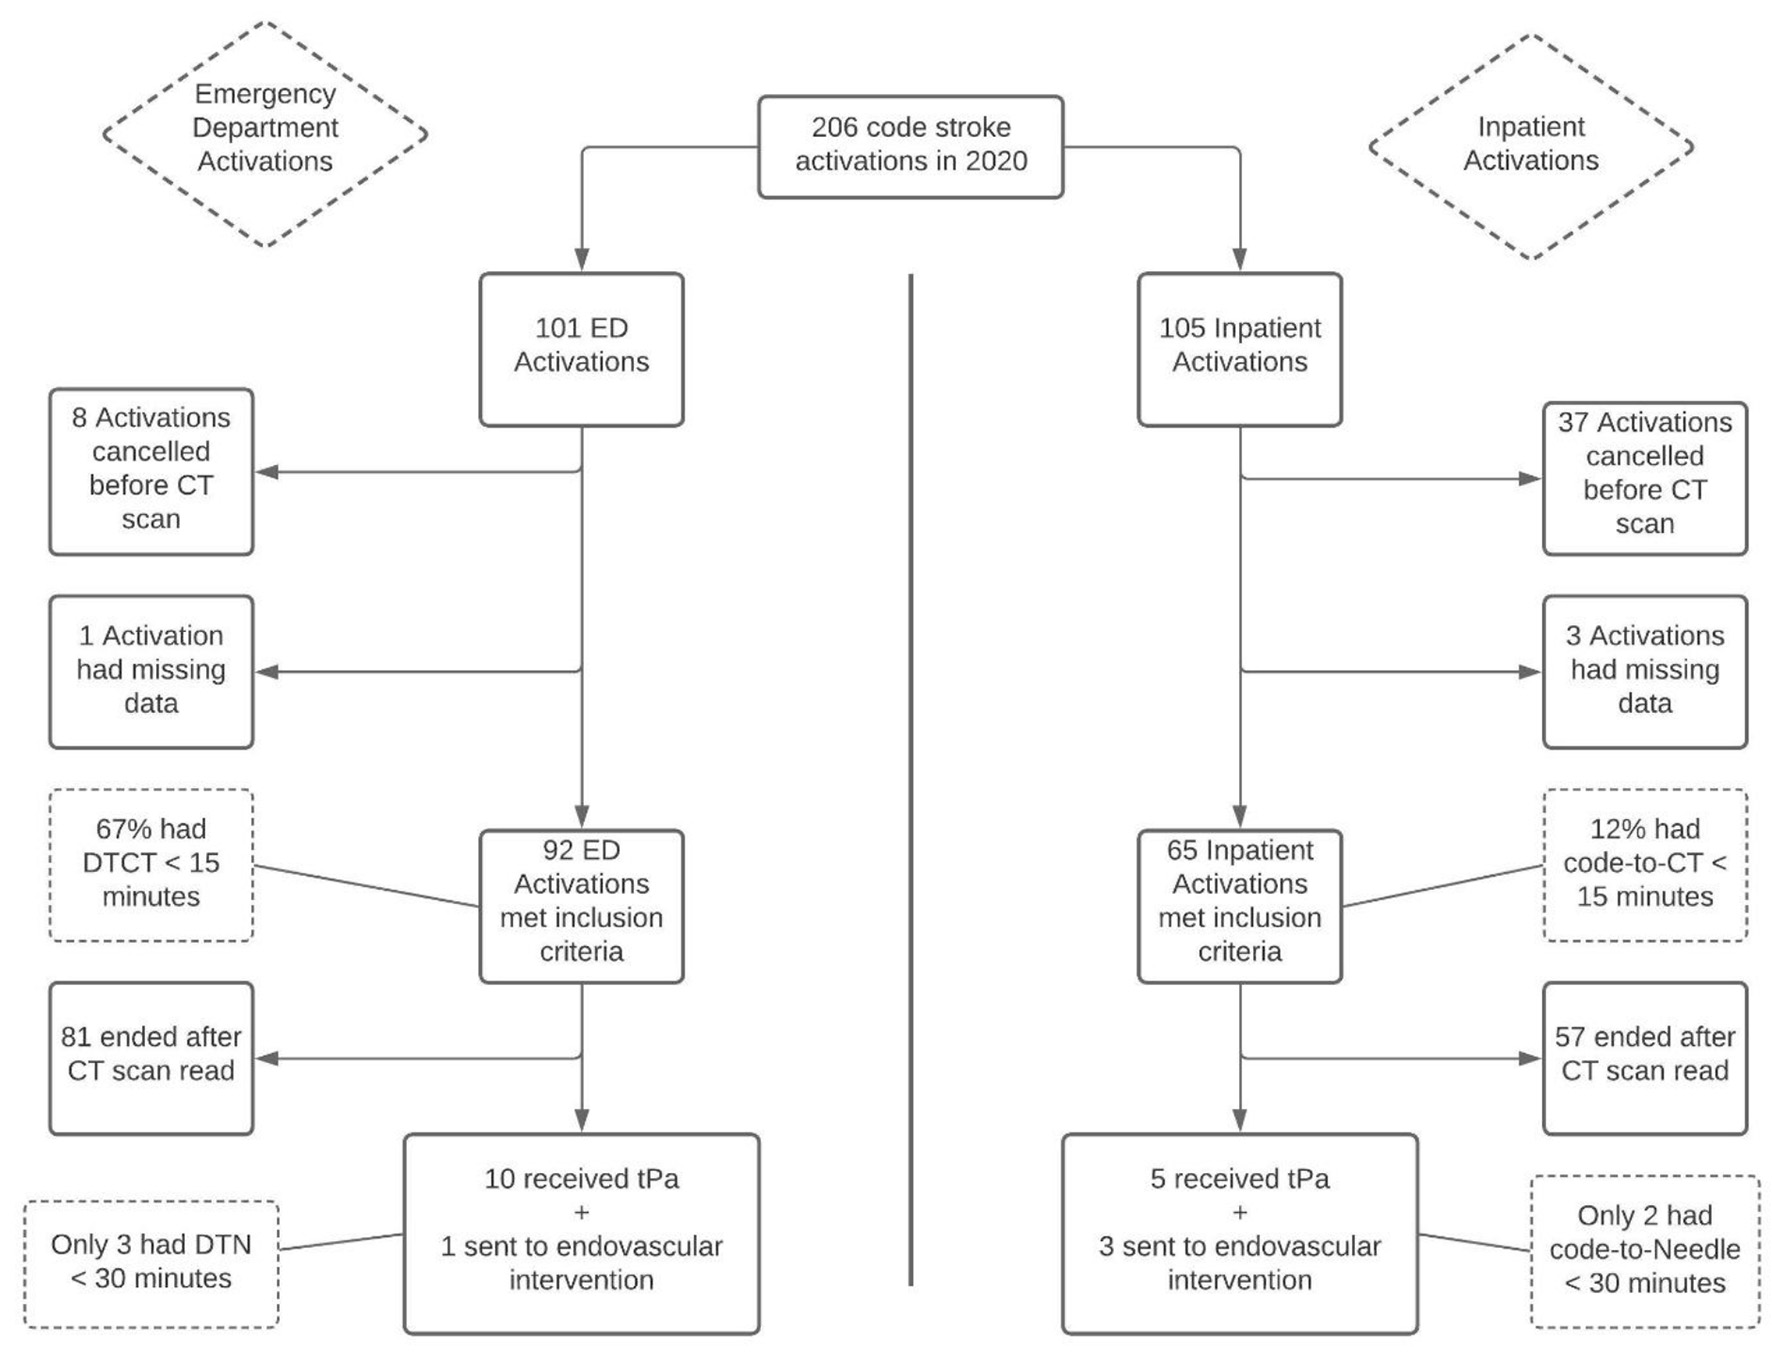
Figure 1. Flowchart of patients included in the study. DTCT: door-to-CT time; DTN: door-to-needle time; CT: computed tomography; tPA: tissue plasminogen activator; ED: emergency department.
| Journal of Neurology Research, ISSN 1923-2845 print, 1923-2853 online, Open Access |
| Article copyright, the authors; Journal compilation copyright, J Neurol Res and Elmer Press Inc |
| Journal website https://www.neurores.org |
Original Article
Volume 11, Number 3-4, August 2021, pages 47-53
Comparison of Code Stroke Response Times Between Emergency Department and Inpatient Settings in a Primary Stroke Center
Figure
Tables
| Time interval | Emergency department, mean (95% CI) | Inpatient setting, mean (95% CI) | P-value |
|---|---|---|---|
| All values are in minutes. DTCT: door-to-CT time; DTN: door-to-needle time; CI: confidence interval; CT: computed tomography; tPA: tissue plasminogen activator. | |||
| Code stroke to (start of) CT scan (DTCT) | 9.01 (5.74 - 12.3) | 24.99 (18.1 - 31.9) | 0.04 |
| Code stroke to tPA administration (DTN) | 61.75 (54.8 - 68.7) | 100.66 (93.7 - 108) | 0.17 |
| Time from (start of) CT scan to tPA administration | 52.75 (49.5 - 56) | 75.67 (68.7 - 82.6) | 0.41 |
| Time from completion of CT scan to tPA administration | 48.35 (45.1 - 51.6) | 61.66 (54.7 - 68.6) | 0.62 |
| Time interval | Emergency department, mean (95% CI) | Inpatient setting, mean (95% CI) | P-value |
|---|---|---|---|
| All values are in minutes. DTCT: door-to-CT time; CI: confidence interval; CT: computed tomography. | |||
| Code stroke to (start of) CT scan (DTCT) | 14.25 (10.8 - 17.7) | 30.74 (27 - 34.4) | 0.0003 |
| Code stroke to CT scan read | 34.25 (30.8 - 37.7) | 54.95 (51.3 - 58.7) | 0.0213 |
| Time from (start of) CT scan to CT scan read | 20.00 (16.5 - 23.5) | 26.99 (23.3 - 30.7) | 0.3099 |
| Time from completion of CT scan to CT scan read | 14.12 (10.4 - 17.8) | 19.76 (16.1 - 23.5) | 0.3808 |