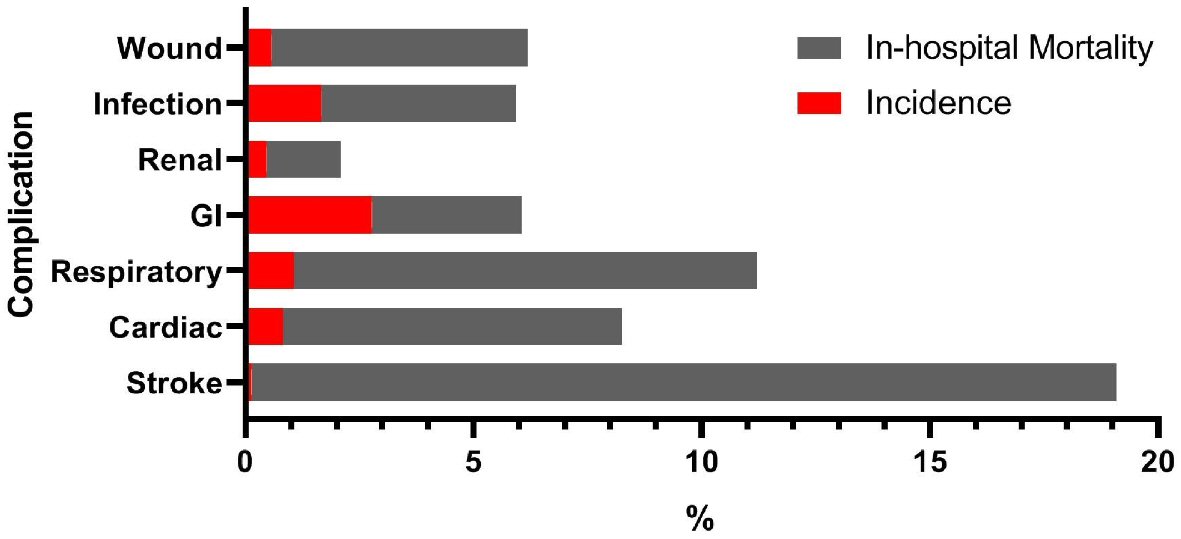
Figure 1. The incidence of perioperative complication and its corresponding in-hospital mortality. GI: gastrointestinal.
| Journal of Neurology Research, ISSN 1923-2845 print, 1923-2853 online, Open Access |
| Article copyright, the authors; Journal compilation copyright, J Neurol Res and Elmer Press Inc |
| Journal website https://www.neurores.org |
Original Article
Volume 11, Number 1-2, April 2021, pages 5-13
Perioperative Stroke Impact on Morbidity and In-Hospital Mortality in Non-Cardiovascular Non-Neurological Surgeries: State Inpatient Database Study
Figures
Tables
| Characteristic | Subjects without stroke (n, %) | Subjects with stroke (n, %) | Total (n, %) |
|---|---|---|---|
| SD: standard deviation; VWR: van Walraven score. | |||
| Perioperative stroke | 1,204,318 (99.86%) | 1,739 (0.14) | 1,206,057 (100) |
| Age (mean ± SD) | 57.88 (19.02) | 74.31 (13.83) | 57.9 ± 19.02 |
| Age | |||
| Under 65 | 712,080 (99.90) | 364 (0.10) | 712,444 (59.7) |
| 65 - 74 | 222,312 (99. 80) | 375 (0.20) | 222,687 (18.7) |
| 75 - 84 | 176,721 (99.70) | 543 (0.30) | 177,264 (14.9) |
| 85+ | 806,90 (99.40) | 457 (0.60) | 81,147 (6.8) |
| Gender | |||
| Male | 422,847 (99.8) | 716 (0.2) | 423,563 (36.6) |
| Female | 731,966 (99.9) | 1,021 (0.1) | 732,987 (63.4) |
| Race | |||
| White | 729,786 (99.80) | 1,172 (0.20) | 730,958 (60.6) |
| Black | 60,134 (99.84) | 97 (0.16) | 60,231 (5.5) |
| Hispanic | 223,043 (99.90) | 254 (0.10) | 223,297 (18.5) |
| Asian or pacific islander | 57,703 (99.79) | 124 (0.21) | 57,827 (4.8) |
| Native American | 861 (99.80) | 2 (0.20) | 863 (0.1) |
| Other | 17,872 (99.83) | 31 (0.17) | 17,903 (1.5) |
| Procedure | |||
| Hemicolectomy | 37,350 (99.95) | 189 (0.5) | 37,539 (3.1) |
| Appendectomy | 125,299 (99.98) | 27 (0.02) | 125,326 (10.4) |
| Cholecystectomy | 162,540 (99.91) | 145 (0.09) | 162,685 (13.5) |
| Hip replacement | 154,976 (99.98) | 338 (0.2) | 155,314 (12.9) |
| Knee replacement | 210,253 (99.92) | 169 (0.08) | 210,422 (17.4) |
| Treatment of fracture or dislocation of lower extremity | 92,217 (99.59) | 382 (0.41) | 92,599 (7.7) |
| Amputation of lower extremity | 37,654 (99.56) | 167 (0.44) | 37,821 (3.1) |
| Laminectomy | 172,324 (99.89) | 90 (0.11) | 81,089 (6.7) |
| Spine fusion | 130,768 (99.86) | 192 (0.14) | 130,960 (10.9) |
| Hysterectomy | 172,324 (99.98) | 40 (0.02) | 172,364 (14.3) |
| Admission type | |||
| Emergency | 408,149 (99.75) | 1,013 (0.25) | 409,162 (33.9) |
| Elective/other | 796,169 (99.91) | 726 (0.09) | 796,895 (66.1) |
| Van Walraven score category | |||
| Low risk (VWR < 5) | 989,888 (99.96) | 436 (0.04) | 990,324 (82.1) |
| Intermediate risk (VWR 5 - 14) | 180, 824 (99.56) | 792 (0.44) | 181,616 (15.1) |
| High risk (VWR > 14) | 33,668 (98.50) | 511 (1.50) | 34,179 (2.8) |
| Length of stay, mean | 16.04 (17.18) | 4.02 (5.14) | 4.04 (5.21) |
| In-hospital mortality | 6,481 (94.03) | 329 (5.07) | 6,810 (0.56) |
| Morbidity | 97,186 (99.1) | 920 (0.9) | 98,106 (8.1) |
| Characteristic | Morbidity | Mortality | ||
|---|---|---|---|---|
| OR (95% CI) | P value | OR (95% CI) | P value | |
| OR: odds ratio; CI: confidence interval; REF: reference. | ||||
| Age groups | ||||
| Under 65 | REF | - | REF | - |
| 65 - 74 | 1.40 (1.37, 1.43) | < 0.001 | 1.56 (1.43, 1.69) | < 0.001 |
| 75 - 84 | 1.60 (1.57, 1.64) | < 0.001 | 2.12 (1.96, 2.29) | < 0.001 |
| 85+ | 1.67 (1.63, 1.72) | < 0.001 | 3.30 (3.04, 3.58) | < 0.001 |
| Gender | ||||
| Male | REF | - | REF | - |
| Female | 0.82 (0.81, 0.83) | < 0.001 | 0.76 (0.72, 0.80) | < 0.001 |
| Race | ||||
| White | REF | < 0.001 | REF | - |
| Black | 1.26 (1.22, 1.30) | < 0.001 | 1.07 (0.96, 1.19) | 0.180 |
| Hispanic | 0.96 (0.94, 0.98) | < 0.001 | 1.02 (0.95, 1.10) | 0.467 |
| Asian or Pacific Islander | 1.15 (1.11, 1.18) | < 0.001 | 0.99 (0.89, 1.10) | 0.875 |
| Native American | 1.18 (0.93, 1.49) | 0.158 | 0.35 (0.08, 1.43) | 0.145 |
| Others | 1.11 (1.05, 1.17) | < 0.001 | 1.13 (0.93, 1.37) | 0.198 |
| Procedure | ||||
| Hemicolectomy | REF | - | REF | - |
| Appendectomy | 0.17 (0.16, 0.17) | < 0.001 | 0.11 (0.09, 0.14) | < 0.001 |
| Cholecystectomy | 0.16 (0.15, 0.16) | < 0.001 | 0.27 (0.24, 0.30) | |
| Hip replacement | 0.12 (0.12, 0.13) | < 0.001 | 0.30 (0.27, 0.33) | < 0.001 |
| Knee replacement | 0.11 (0.11, 0.12) | < 0.001 | 0.13 (0.11, 0.16) | < 0.001 |
| Treatment of fracture of lower extremity | 0.11 (0.11, 0.12) | < 0.001 | 0.34 (0.31, 0.37) | < 0.001 |
| Amputation of lower extremity | 0.39 (0.38, 0.43) | < 0.001 | 0.81 (0.74, 0.90) | < 0.001 |
| Laminectomy | 0.16 (0.15, 0.16) | < 0.001 | 0.36 (0.31, 0.42) | < 0.001 |
| Spine fusion | 0.33 (0.32, 0.34) | < 0.001 | 0.36 (0.31, 0.37) | < 0.001 |
| Hysterectomy | 0.22 (0.21, 0.23) | < 0.001 | 0.23 (0.19, 0.29) | < 0.001 |
| Admission type | ||||
| Elective | REF | - | REF | - |
| Emergency | 2.15 (2.11, 2.20) | < 0.001 | 2.98 (2.77, 3.22) | < 0.001 |
| Van Walraven groups | ||||
| < 5 | REF | - | REF | - |
| 5 - 14 | 2.52 (2.48, 2.56) | < 0.001 | 4.62 (4.28, 4.98) | < 0.001 |
| > 14 | 5.60 (5.45, 5.76) | < 0.001 | 13.09 (12.08, 14.19) | < 0.001 |
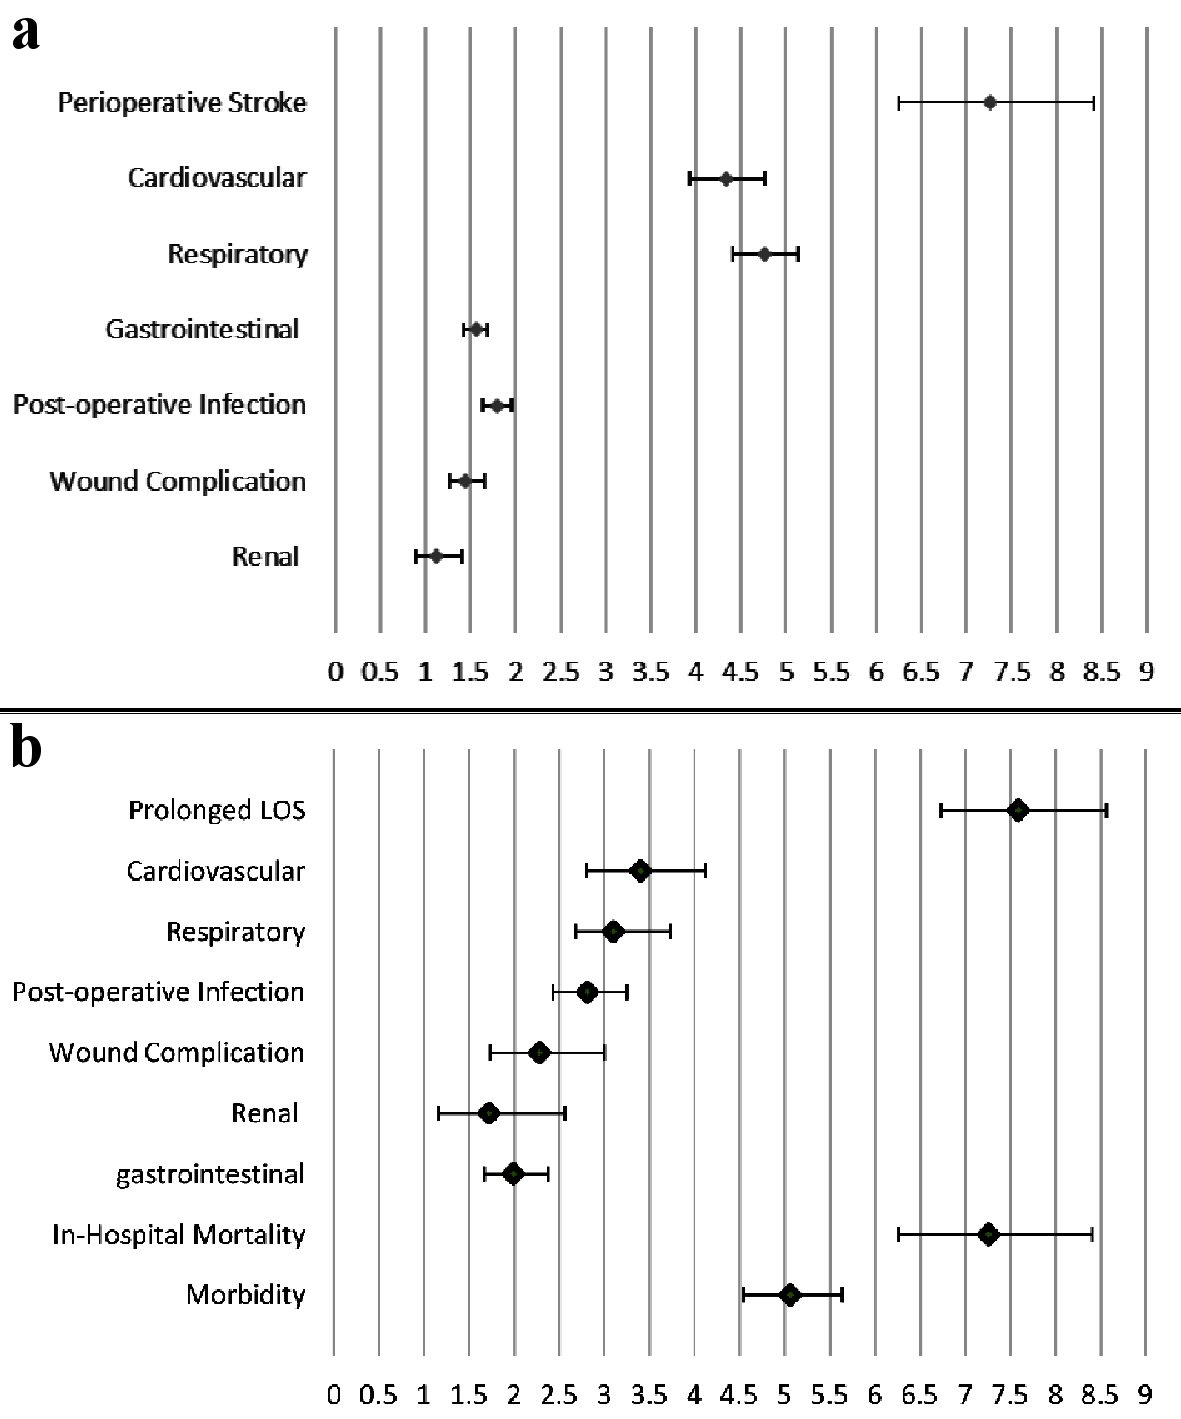
| Perioperative stroke | 5.06 (4.54, 5.64) | < 0.001 | 7.26 (6.26, 8.41) | < 0.001 |
| Cardiovascular complications | - | - | 4.33 (3.93, 4.77) | < 0.001 |
| Pulmonary complications | - | - | 4.76 (4.40, 5.14) | < 0.001 |
| Gastrointestinal complications | - | - | 1.56 (1.43, 1.69) | < 0.001 |
| Post-operative infection | - | - | 1.79 (1.64, 1.95) | < 0.001 |
| Wound complications | - | - | 1.45 (1.27, 1.66) | < 0.001 |
| Renal complications | - | - | 1.12 (0.90, 1.40) | 0.294 |