Journal of Neurology Research, ISSN 1923-2845 print, 1923-2853 online, Open Access
Article copyright, the authors; Journal compilation copyright, J Neurol Res and Elmer Press Inc
Journal website https://www.neurores.org

Original Article

Volume 10, Number 6, December 2020, pages 209-219


Ceramide Dynamics and Prognostic Value in Acute and Subacute Ischemic Stroke: Preliminary Findings in a Clinical Cohort

Figures

Figure 1.
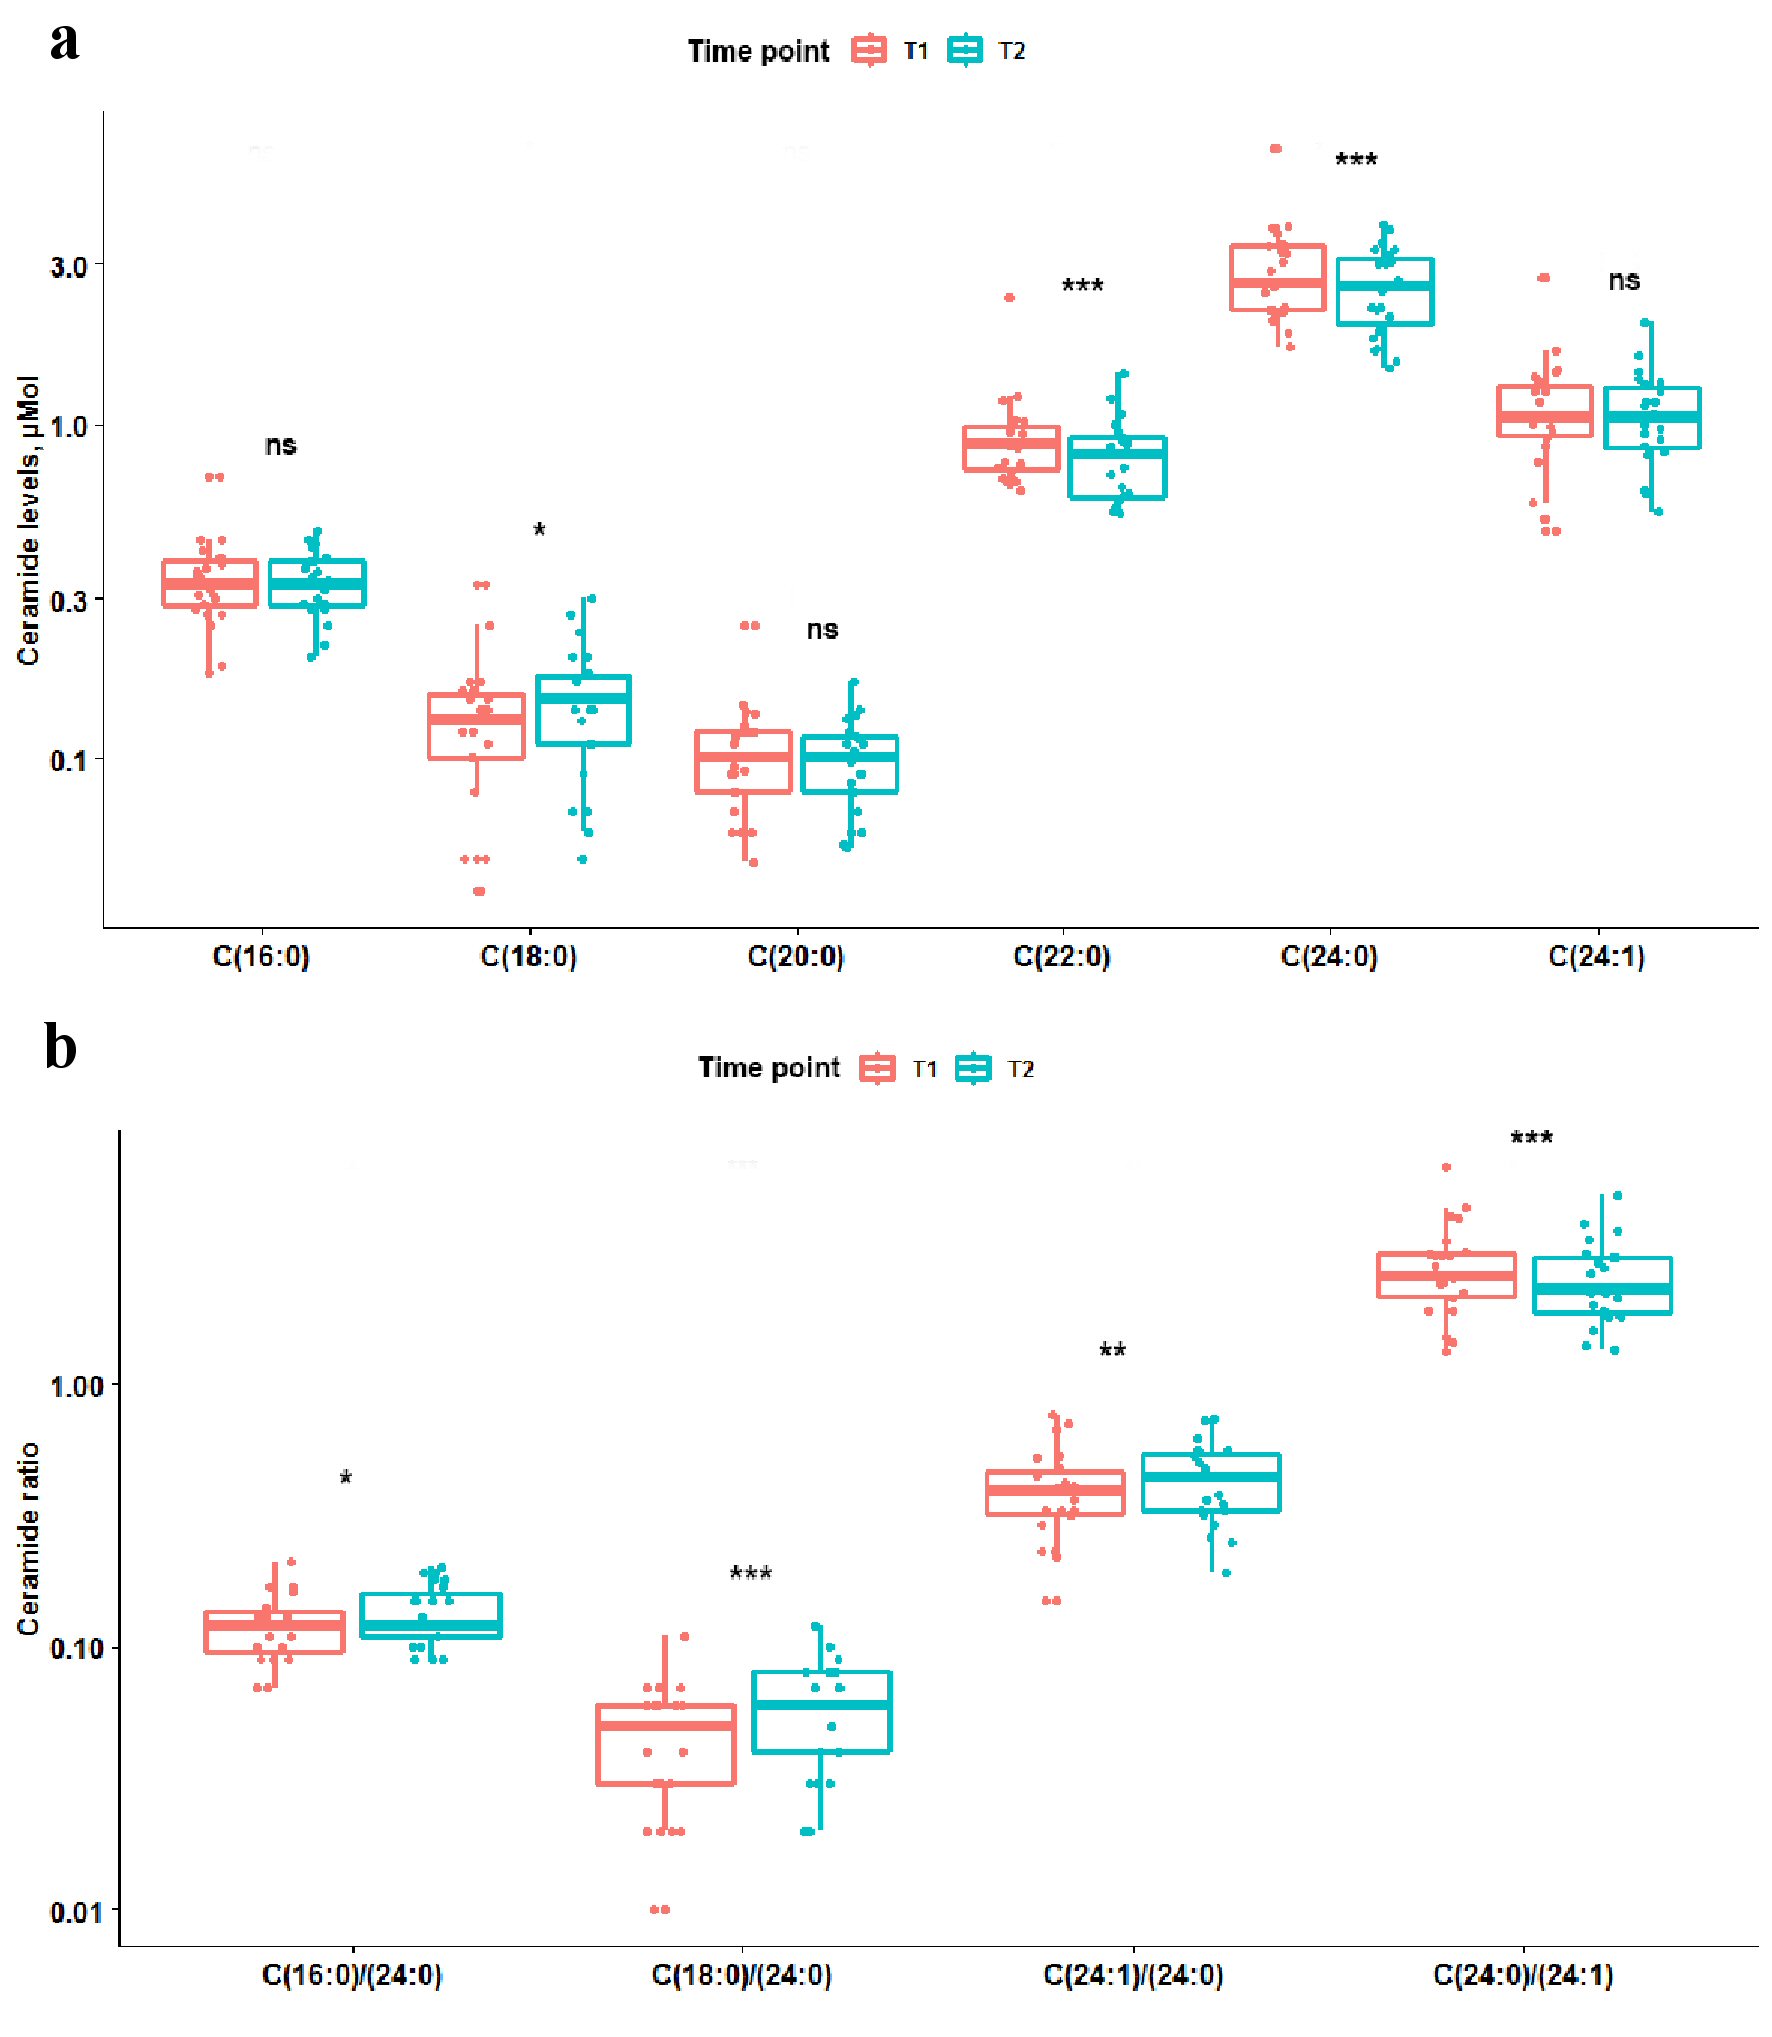
Figure 1. Box plots showing difference in ceramide levels and ratios between two time points. Coral box plots represent circulating plasma ceramide levels (a) or ratios (b) at time point 1 (< 12 h from the symptom onset), and teal box plots represent ceramide levels or ratios at time point 2 (> 24 h from the symptom onset). The line in box plots represents the median, interquartile range and the whiskers correspond to minimum and maximum values. Wilcoxon signed rank test results are displayed above each comparison. ns: not significant, P ≥ 0.05. *0.01≤ P <0.05. **0.001≤ P <0.01. *** P < 0.001.
Figure 2.
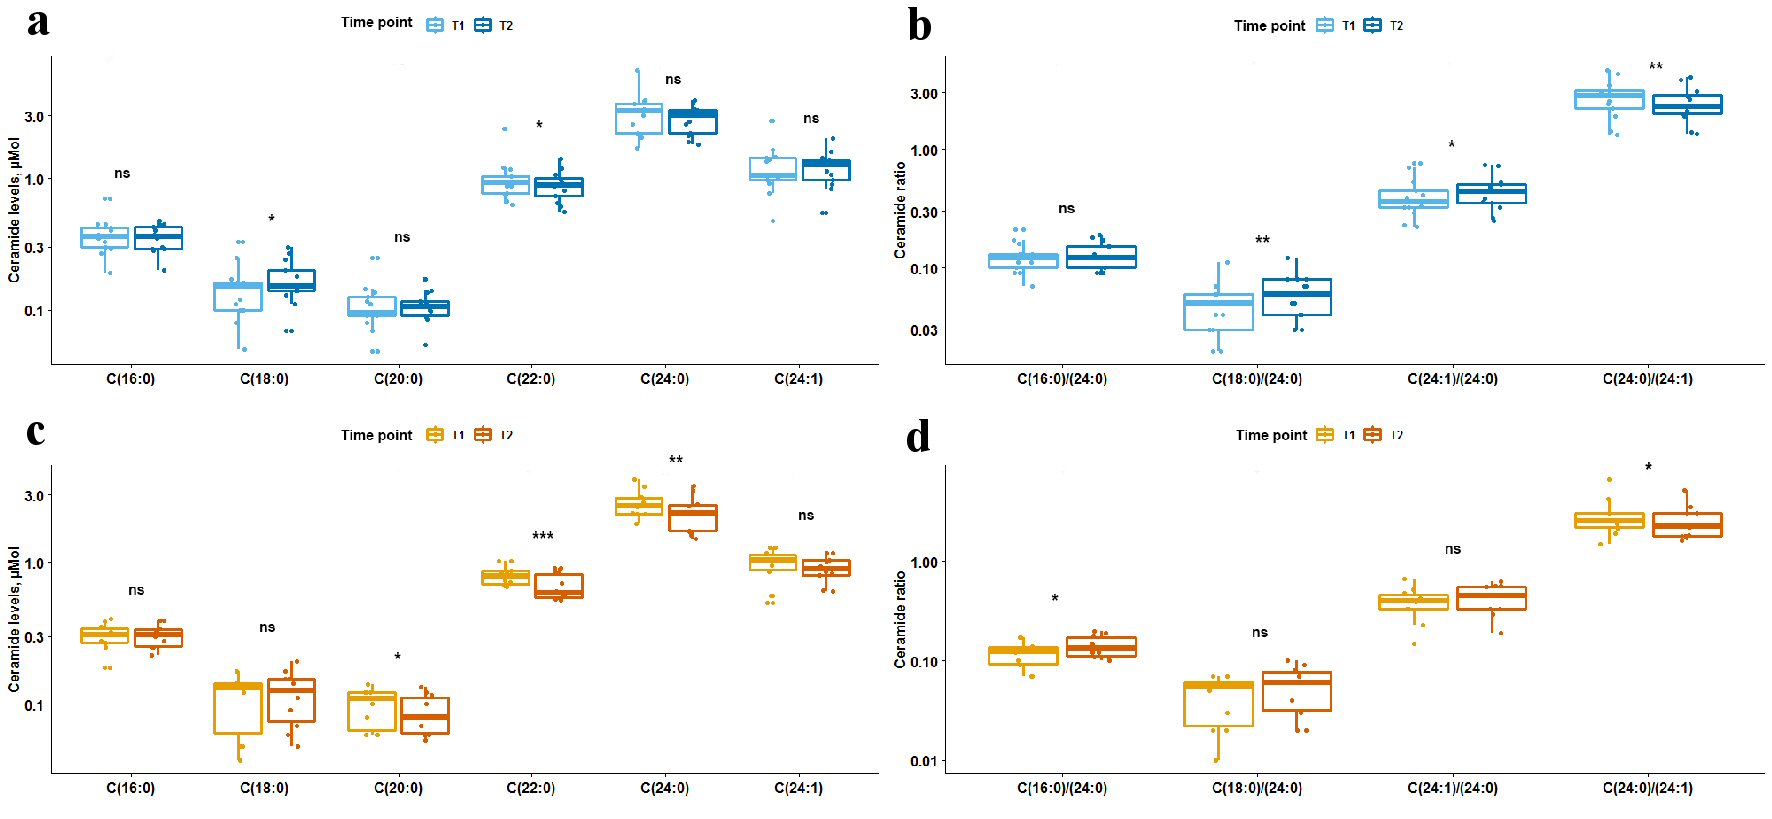
Figure 2. Box plots showing difference in levels of ceramides and ceramide ratios between two time points stratified by prior statin exposure. Light blue and orange box plots represent circulating plasma ceramide levels (a, c) or ratios (b, d) at time point 1, and dark blue and orange box plots represent ceramide levels or ratios at time point 2. Panels (a) and (b) show data for statin-naive participants; panels (c) and (d) show data for participants with prior statin exposure. The line in box plots represents the median, interquartile range and the whiskers correspond to minimum and maximum values. Wilcoxon signed rank test results are displayed above each comparison. ns: not significant, P ≥ 0.05. *0.01≤ P <0.05. **0.001≤ P <0.01. *** P < 0.001.

Tables

Table 1. Demographic, Clinical and Laboratory Characteristics of the Study Participants
 
N(%) or median (range)P valueb
All (n = 23)Statin-naive (n = 13)aStatin-exposed (n = 10)
LKW: last known well; BMI; body mass index; NIHSS: National Institutes of Health Stroke Scale; BP: blood pressure; IV-tPA: intravenous tissue plasminogen activator; ESUS: embolic stroke of undetermined source; LDL: low-density lipoprotein; HDL: high-density lipoprotein; T1: time point 1; T2: time point 2. aStatin-naive: participants were not on statin therapy prior to admission. bFor categorical variables, P values are from Fisher’s exact test; for continuous, from Wilcoxon rank sum test. cOther mechanisms: dissection (n = 1), hypotension (n = 1), transient ischemic attack (n = 1), small vessel occlusion (n = 1).
Demographic characteristics
  Female12 (52%)7 (54%)5 (50%)1.000
  Age, years76 (45 - 96)76 (45 - 96)77 (53 - 92)0.7093
  BMI, kg/m225.6 (20.5 - 46.6)28.9 (20.5 - 46.6)24.7 (20.9 - 38.4)0.2036
Risk factors
  Hypertension20 (87%)11 (85%)9 (90%)1.000
  Diabetes mellitus7 (30%)3 (23%)4 (40%)0.6500
  Hyperlipidemia19 (83%)9 (69%)10 (100%)0.1045
  Obstructive sleep apnea6 (26%)2 (15%)4 (40%)0.3413
  Cardiac disease15 (65%)8 (62%)7 (70%)1.000
  Prior stroke8 (35%)3 (23%)5 (50%)0.2213
  Deep vein thrombosis3 (13%)2 (15%)1 (10%)1.000
Medications prior to admission
  Antiplatelet therapy13 (57%)7 (54%)6 (60%)1.000
  Anticoagulation4 (17%)1 (8%)3 (30%)0.2806
Acute ischemic event characteristics
  NIHSS score5 (0 - 27)8 (0 - 27)4 (0 - 22)0.4541
  Infarct volume, cm31.4 (0.0 - 36.5)2.3 (0.04 - 36.5)1.2 (0.0 - 25.5)0.6418
  Systolic BP, mm Hg158 (98 - 190)149 (98 - 190)160 (136 - 175)0.4949
  Diastolic BP, mm Hg89 (47 - 127)89 (47 - 127)87 (64 - 109)0.8768
  IV-tPA administered10 (44%)7 (54%)3 (30%)0.4015
  Embolectomy5 (22%)4 (31%)1 (10%)0.3394
  Modified Rankin scale2 (0 - 6)2 (0 - 6)1.5 (0 - 3)0.6784
Mechanism of the acute ischemic event
  Cardioembolic8 (35%)6 (46%)2 (20%)0.3788
  Large vessel occlusion4 (17%)2 (15%)2 (20%)1.000
  ESUS7 (31%)2 (15%)5 (50%)0.1688
  Otherc4 (17%)3 (23%)1 (10%)0.6036
Laboratory results
  Total cholesterol, mg/dL161 (110 - 244)177(111 - 244)146 (110 - 240)0.0694
  LDL, mg/dL79 (55 - 162)120 (55 - 125)70 (55 - 162)0.0158a
  HDL, mg/dL45 (20 - 76)40 (20 - 67)51 (29 - 76)0.2758
  Triglycerides, mg/dL114 (59 - 355)132 (59 - 355)88 (70 - 171)0.9474
  Hemoglobin A1c, %5.7 (5.1 - 9.3)5.5 (5.1 - 9.3)5.9 (5.2 - 7.1)0.0964
  Ejection fraction, %60 (14 - 73)64 (14 - 73)55 (20 - 60)0.0742
Time from LKW to blood sample acquisition
  T1, hours8.5 ( 3.8 - 11.5)8.8 (3.8 - 11.0)8.4 (5.5 - 11.5)0.8515
  T2, hours44.5 (24.3 - 151)43.5 (29.0 - 183)46.9 (24.3 - 151)0.8768


Table 2. Median Difference in Levels of Circulating Ceramides Between the Two Time Points
 
Time point 1aTime point 2Median difference (95% CI)bP valuec
CI: confidence interval; C: ceramide. aData shown for time point 1 and 2 are median (range). bMedian difference and 95% confidence intervals are from smoothed empirical likelihood quantiles. cP values shown are from Wilcoxon signed rank test, P < 0.05 was considered statistically significant.
All study participants (n = 23)
  C(16:0), µmol0.33 (0.18 - 0.70)0.32 (0.20 - 0.48)-0.01 (-0.02, 0.01)0.5235
  C(18:0), µmol0.14 (0.04 - 0.33)0.14 (0.05 - 0.30)0.02 (0.00, 0.03)0.0243
  C(20:0), µmol0.10 (0.05 - 0.25)0.10 (0.05 - 0.17)-0.01 (-0.01, 0.00)0.0562
  C(22:0), µmol0.87 (0.63 - 2.38)0.81 (0.54 - 1.41)-0.10 (-0.14, -0.06)< 0.0001
  C(24:0), µmol2.63 (1.70 - 6.64)2.56 (1.47 - 3.95)-0.34 (-0.49, -0.14)0.0002
  C(24:1), µmol1.05 (0.48 - 2.73)1.04 (0.55 - 2.02)-0.02 (-0.09, 0.05)0.4591
  Total C, µmol5.32 (3.62 - 13.03)5.23 (3.22 - 8.16)-0.39 (-0.69, -0.14)0.0012
  C(16:0)/(24:0)0.12 (0.07 - 0.21)0.12 (0.09 - 0.20)0.01 (0.00, 0.02)0.0160
  C(18:0)/(24:0)0.05 (0.01 - 0.11)0.06 (0.02 - 0.12)0.01 (0.007, 0.012)< 0.0001
  C(24:1)/(24:0)0.39 (0.15 - 0.76)0.44 (0.19 - 0.74)0.04 (0.03, 0.05)0.0013
  C(24:0)/C(24:1)2.53 (1.32 - 6.57)2.28 (1.35 - 5.15)-0.25 (-0.42, -0.14)< 0.0001
  Ceramide score8 (0 - 12)9 (1 - 12)1 (0, 2)0.0543
Statin-naive participants (n = 13)
  C(16:0), µmol0.36 (0.19 - 0.70)0.36 (0.20 - 0.48)0.00 (-0.03, 0.02)0.6836
  C(18:0), µmol0.15 (0.05 - 0.33)0.15 (0.07 - 0.30)0.02 (0.003, 0.04)0.0303
  C(20:0), µmol0.10 (0.05 - 0.25)0.11 (0.05 - 0.17)0.00 (-0.01, 0.01)0.6537
  C(22:0), µmol0.93 (0.63 - 2.38)0.89 (0.56 - 1.41)-0.07 (-0.12, -0.02)0.0247
  C(24:0), µmol3.26 (1.70 - 6.64)3.00 (1.80 - 3.95)-0.21 (-0.51, 0.02)0.0803
  C(24:1), µmol1.05 (0.48 - 2.73)1.26 (0.55 - 2.02)0.00 (-0.08, 0.07)0.9597
  Total C, µmol5.70 (3.62, 13.03)5.52 (3.53, 8.16)-0.23 (-0.62, 0.07)0.0942
  C(16:0)/(24:0)0.12 (0.07 - 0.21)0.12 (0.09 - 0.19)0.00 (-0.004, 0.01)0.3320
  C(18:0)/(24:0)0.05 (0.02 - 0.11)0.06 (0.03 - 0.12)0.01 (0.01, 0.02)0.0020
  C(24:1)/(24:0)0.36 (0.22 - 0.76)0.44 (0.25 - 0.74)0.03 (0.01, 0.05)0.0234
  C(24:0)/C(24:1)2.78 (1.32 - 4.63)2.29 (1.35 - 4.02)-0.25 (-0.47, -0.09)0.0034
  Ceramide score8 (1 - 12)10 (2 - 12)1 (0, 2)0.0508
Statin-exposed participants (n = 10)
  C(16:0), µmol0.31 (0.18 - 0.41)0.31 (0.22 - 0.39)-0.01 (-0.06, 0.05)0.6738
  C(18:0), µmol0.14 (0.04 - 0.17)0.12 (0.05 - 0.20)0.01 (-0.02, 0.02)0.4922
  C(20:0), µmol0.11 (0.06 - 0.14)0.08 (0.06 - 0.13)-0.01 (-0.024, -0.004)0.0194
  C(22:0), µmol0.80 (0.67 - 1.19)0.61 (0.54 - 0.94)-0.14 (-0.21, -0.09)0.0003
  C(24:0), µmol2.48 (1.88- 4.43)2.22 (1.47 - 3.71)-0.42 (-0.57, -0.27)0.0039
  C(24:1), µmol1.04 (0.52 - 1.74)0.90 (0.62 - 1.56)-0.06 (-0.23, 0.06)0.3398
  Total C, µmol4.88 (4.03 - 8.04)4.04 (3.22 - 6.76)-0.65 (-1.28, -0.09)0.0098
  C(16:0)/(24:0)0.13 (0.07 - 0.17)0.14 (0.09 - 0.20)0.02 (0.002, 0.05)0.0469
  C(18:0)/(24:0)0.06 (0.01 - 0.07)0.06 (0.02 - 0.10)0.01 (0.00, 0.02)0.0547
  C(24:1)/(24:0)0.40 (0.15 - 0.67)0.45 (0.19 - 0.62)0.04 (0.00, 0.08)0.0859
  C(24:0)/C(24:1)2.52 (1.49 - 6.60)2.21 (1.61 - 5.15)-0.30 (-0.76, -0.04)0.0371
  Ceramide score8 (0 - 10)7 (1 - 10)1 (-3, 3)0.6328


Table 3. Sensitivity and Specificity of Proposed Ceramide Cut-Off Values for Prediction of Risk and Severity of Stroke
 
Time point 1 (LKW< 12 h)Time point 2 (LKW > 24 h)
AUROCSensitivitySpecificityAUROCSensitivitySpecificity
C: ceramide; AUROC: area under the receiver operating curve; LKW: last known well; NIHSS: National Institutes of Health Stroke Scale
A. Plasma ceramide levels and the risk of stroke
  C(16:0)0.6887%0%0.7086%67%
  C(22:0)0.66100%0%0.7473%67%
  C(24:0)0.4264%33%0.5054%33%
B. Plasma ceramide levels and the severity of stroke (NIHSS ≥ 6)
  C(16:0)0.5178%31%0.6356%23%
  C(22:0)0.7478%15%0.7644%23%
  C(24:0)0.7833%15%0.7433%31%