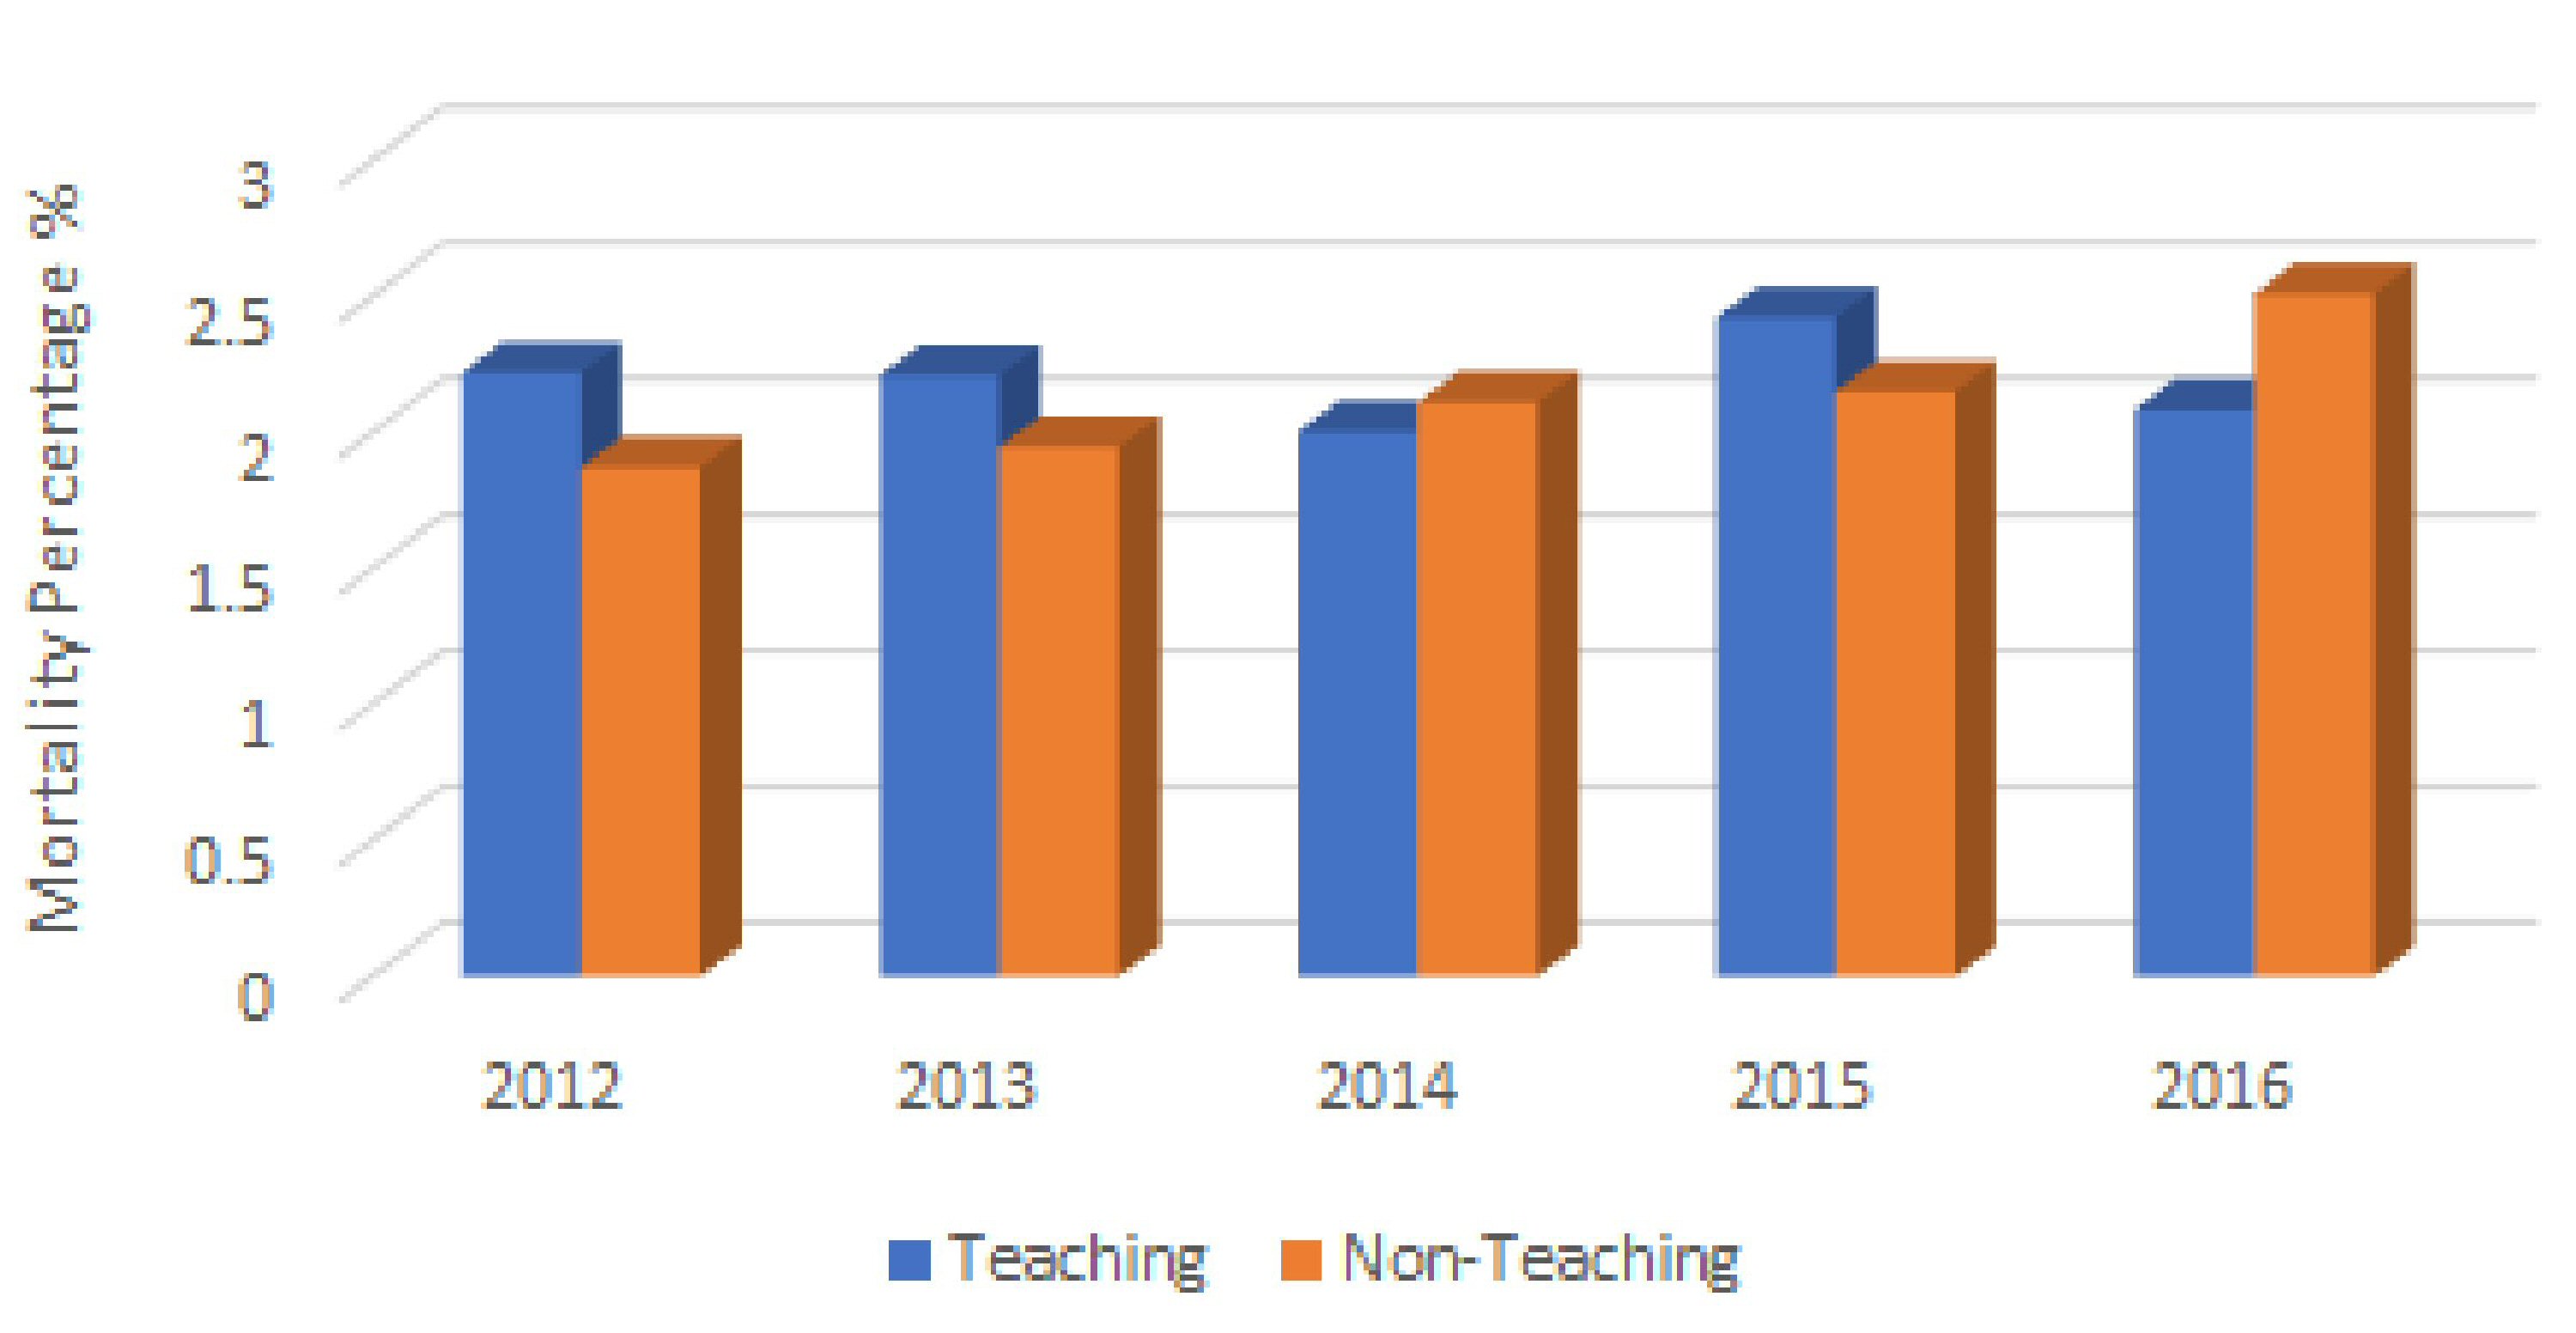
Figure 1. Trend of annual in-hospital deaths for seizures in teaching vs. non-teaching hospitals in USA from 2012 to 2016.
| Journal of Neurology Research, ISSN 1923-2845 print, 1923-2853 online, Open Access |
| Article copyright, the authors; Journal compilation copyright, J Neurol Res and Elmer Press Inc |
| Journal website http://www.neurores.org |
Original Article
Volume 10, Number 4, August 2020, pages 127-131
Seizures With Major Comorbidity and Complications: Association of the Teaching Status of the Hospitals With the Outcomes
Figures
Table
| Mean in all cohorts | Teaching | Non-teaching | Relative ratio (T/NT) | |
|---|---|---|---|---|
| T: teaching; NT: non-teaching; LOS: length of stay. | ||||
| Number (%) | 53,486 | 195,224 (73) | 72,206 (27) | 2.70 |
| Age (years) | 49.24 | 45.40 | 57.06 | 0.80 |
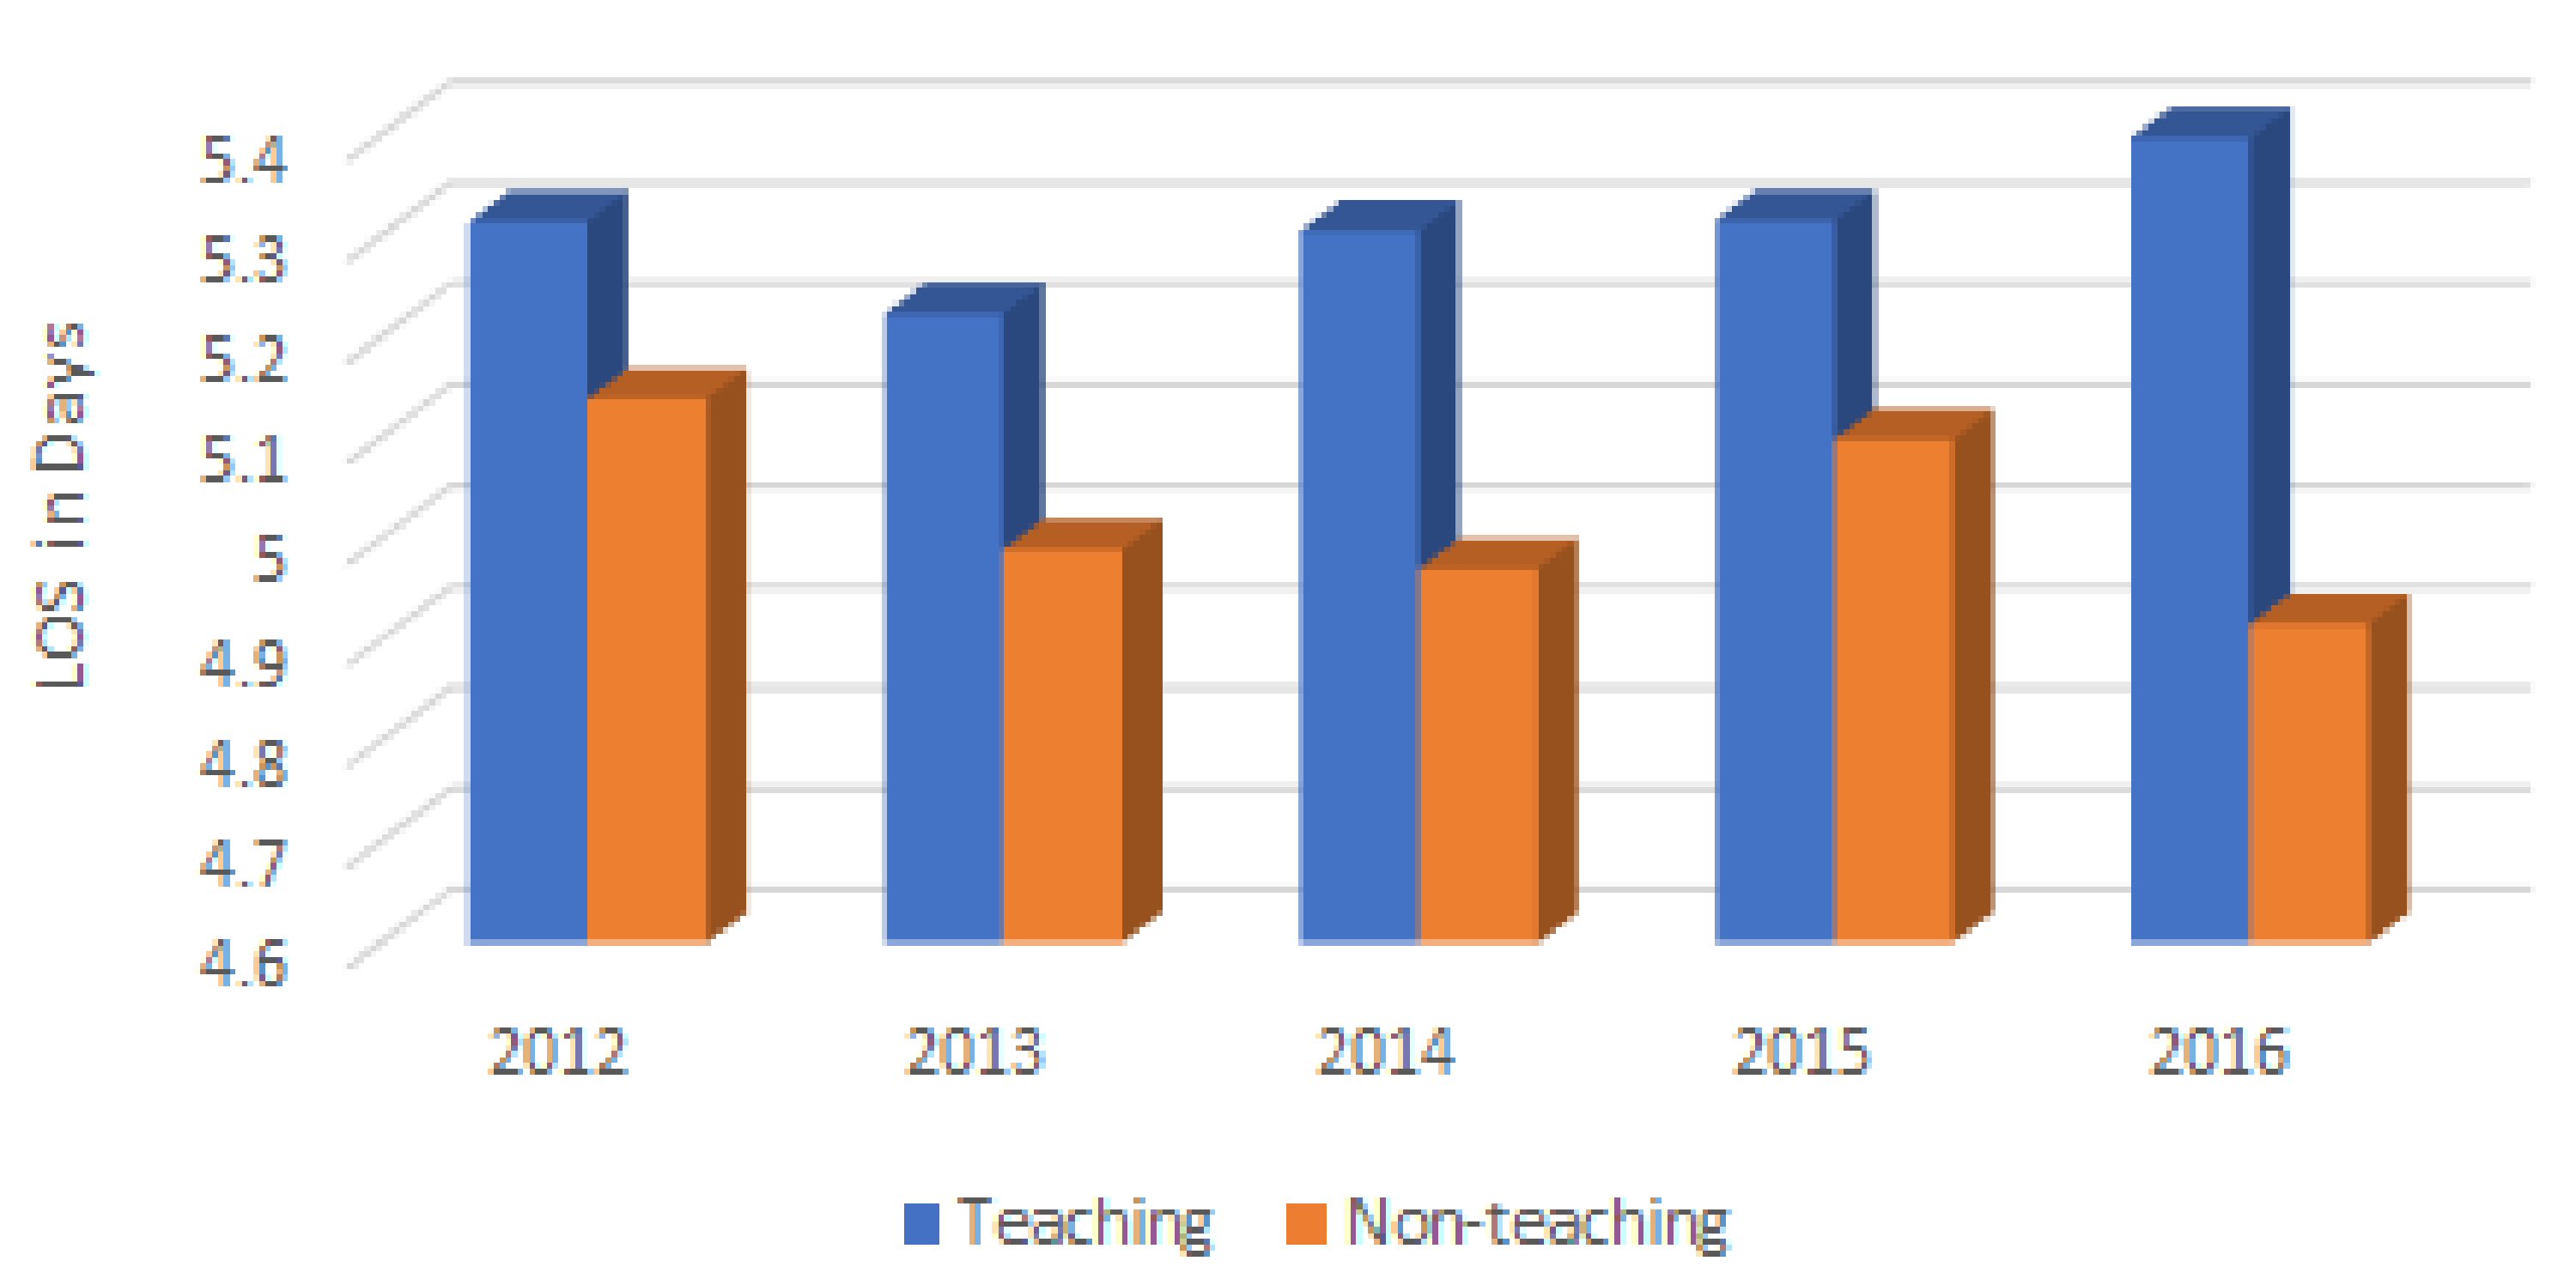
| LOS days | 5.20 | 5.30 | 5.02 | 1.06 |
| Hospital cost | $12,670 | $13,383 | $11,280 | 1.19 |
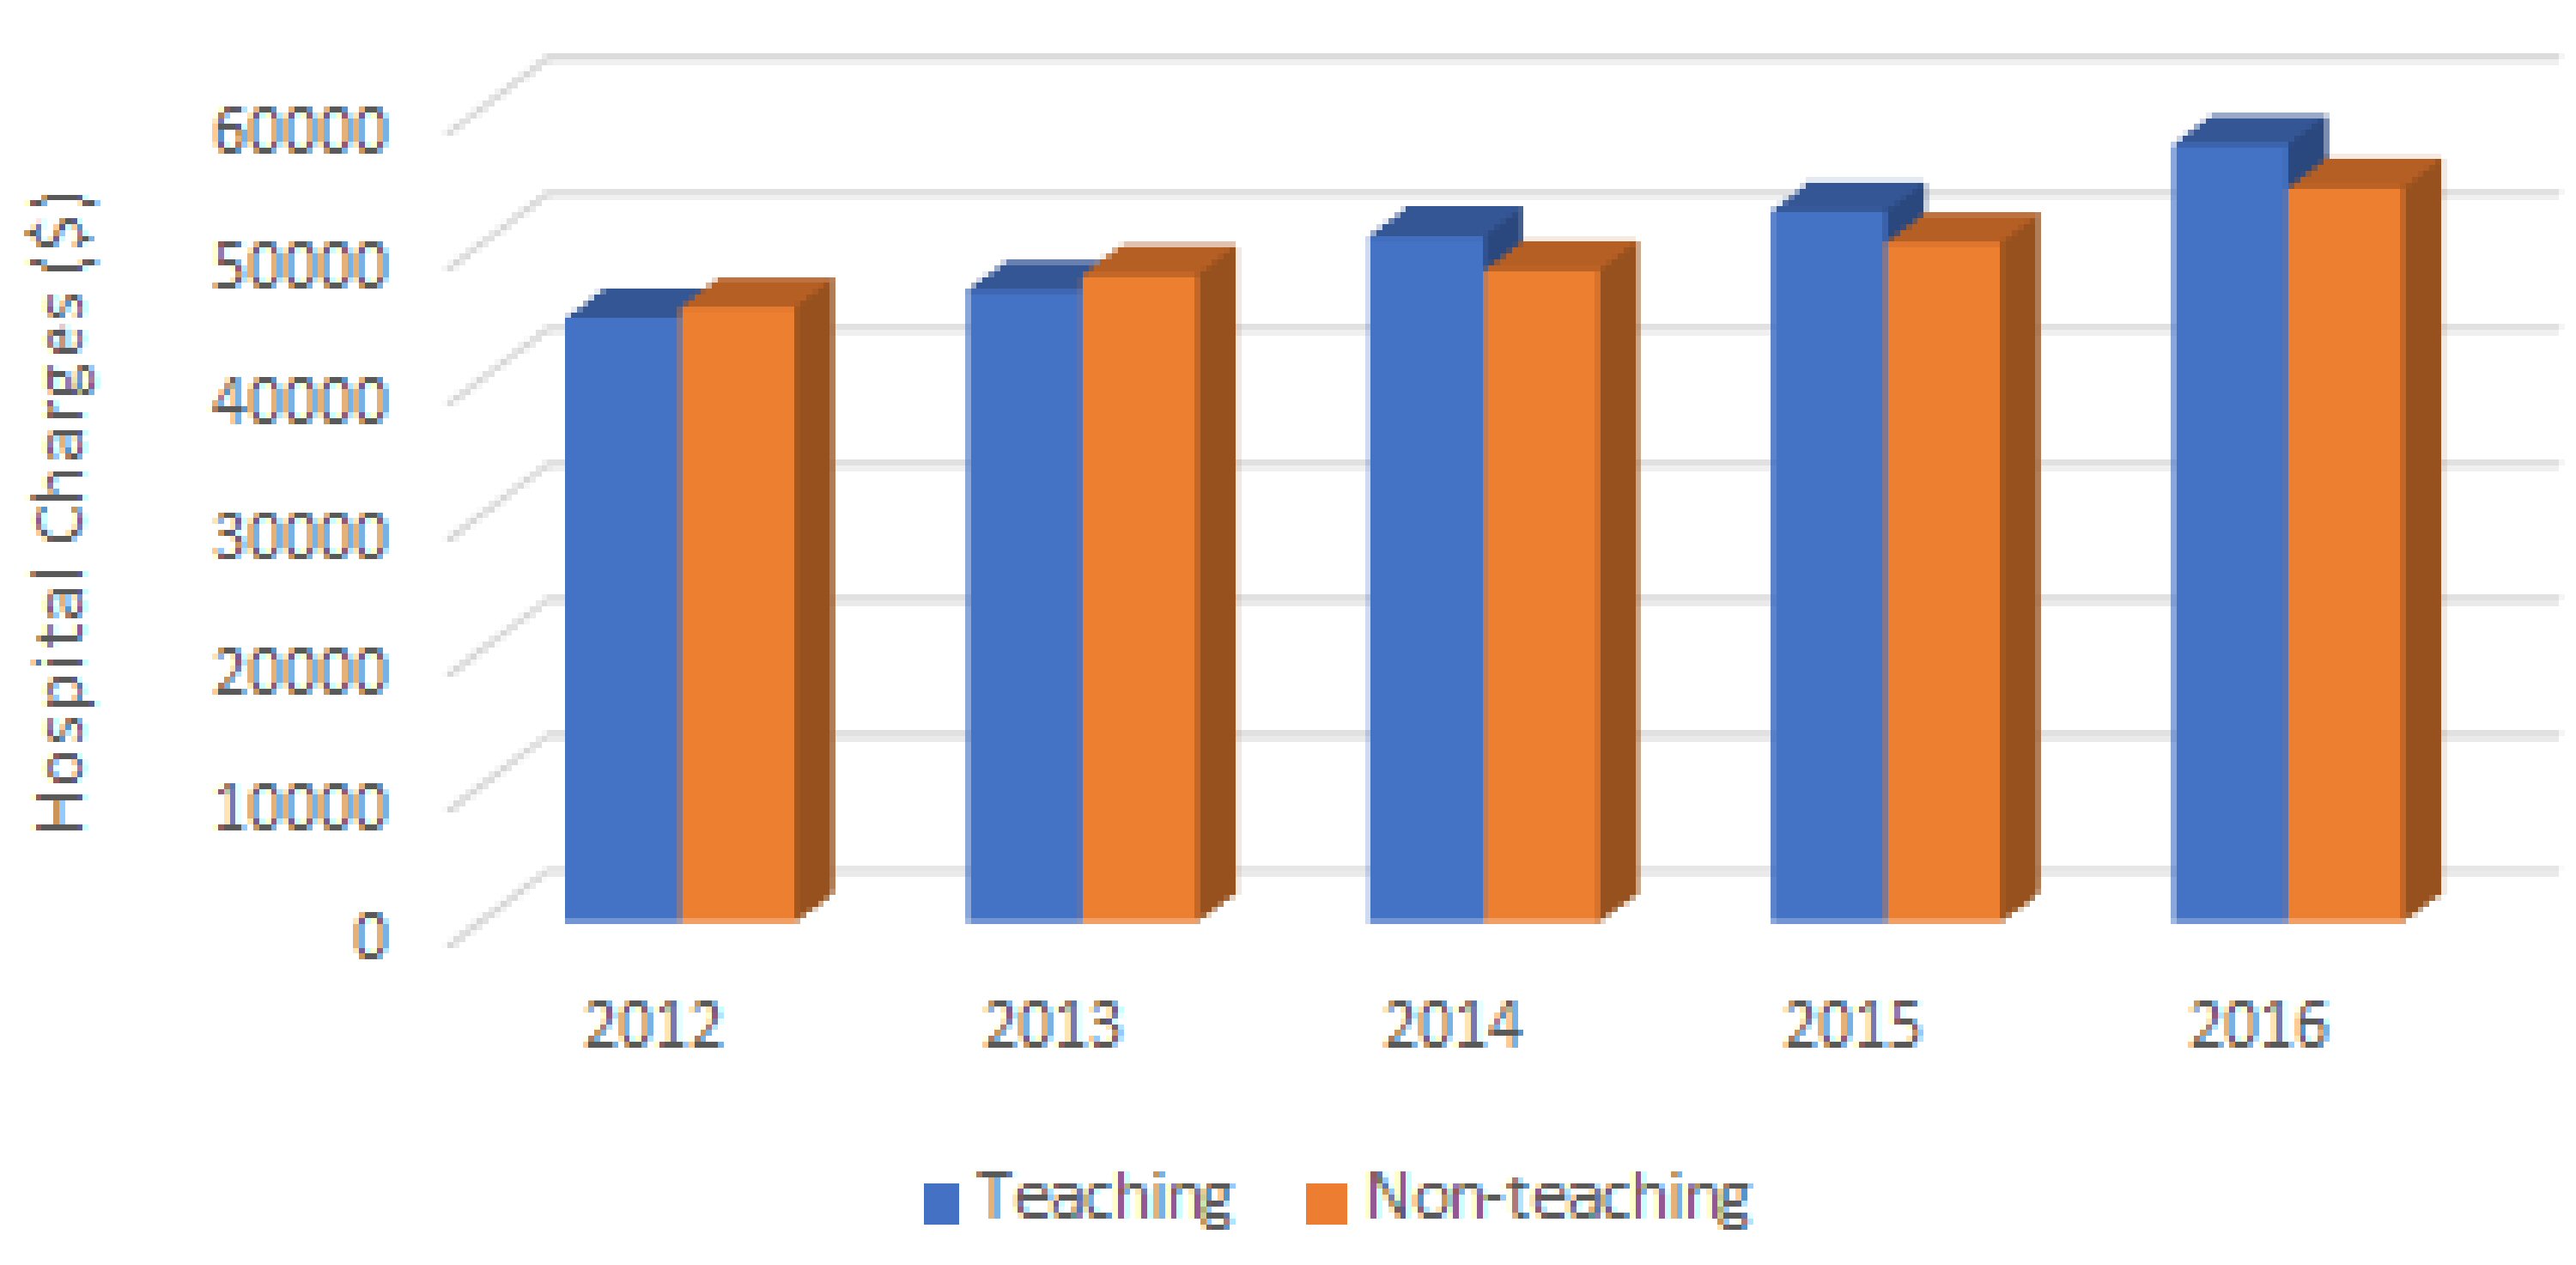
| Hospital charge | $48,975 | $50,382 | $49,168 | 1.02 |
| Mortality (%) | 2.16% | 2.19% | 2.12% | 1.03 |