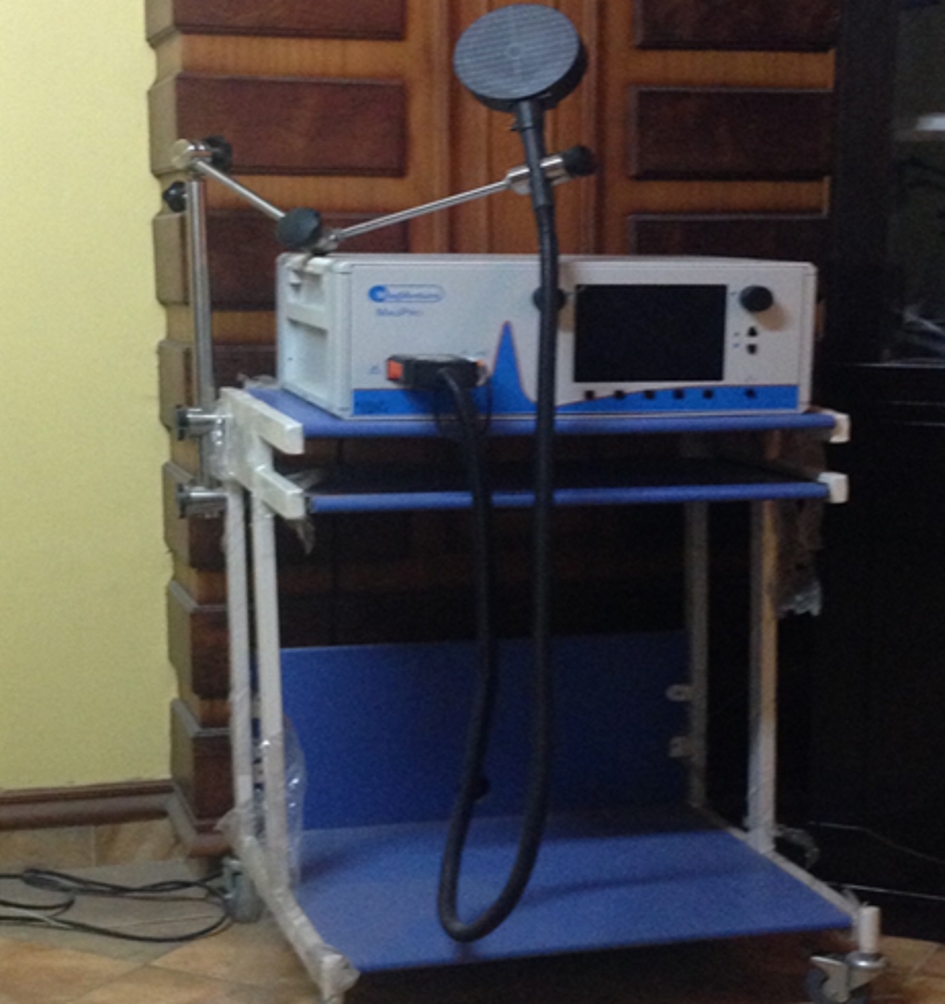
Figure 1. MagPro R30 magnetic stimulator (MagVenture, Farum, Denmark, 2012).
| Journal of Neurology Research, ISSN 1923-2845 print, 1923-2853 online, Open Access |
| Article copyright, the authors; Journal compilation copyright, J Neurol Res and Elmer Press Inc |
| Journal website http://www.neurores.org |
Original Article
Volume 9, Number 3, June 2019, pages 28-34
Repetitive Transcranial Magnetic Stimulation in Treatment of Levodopa-Induced Dyskinesia in Parkinson’s Disease
Figure
Tables
| Data | Study group (n = 20) | Control group (n = 20) | P | |||
|---|---|---|---|---|---|---|
| This table shows no statistical difference between both groups regarding age, sex and duration of illness. | ||||||
| Age | 66.65 ± 4.58 | 66.60 ± 5.97 | t = 0.030 | 0.976 | ||
| Sex | No | % | No | % | ||
| Men | 9 | 45% | 12 | 60% | χ2 = 0.902 | 0.342 |
| Women | 11 | 55% | 8 | 40% | ||
| Duration of illness | 68.10 ± 5.35 | 68.75 ± 5.30 | t = 0.386 | 0.702 | ||
| Stage of Parkinson’s disease | Study group | Control group | χ2 | P | ||
|---|---|---|---|---|---|---|
| No | % | No | % | |||
| III | 7 | 35% | 9 | 45% | 0.472 | 0.790 |
| IV | 10 | 50% | 8 | 40% | ||
| V | 3 | 15% | 3 | 15% | ||
| Dyskinesia | Study group (n = 20) | Control group (n = 20) | t | P |
|---|---|---|---|---|
| Dyskinesia duration (% of the day) | 0.95 ± 1.05 | 0.85 ± 1.04 | 0.303 | 0.764 |
| Dyskinesia disability | 1.05 ± 1.28 | 0.90 ± 1.29 | 0.369 | 0.714 |
| Painful dyskinesia | 0.50 ± 0.69 | 0.60 ± 0.82 | 0.418 | 0.679 |
| Early morning dystonia | 0.35 ± 0.49 | 0.50 ± 0.61 | 0.860 | 0.395 |
| Dyskinesia | Study group (n = 20) | Control group (n = 20) | t | P |
|---|---|---|---|---|
| *Statistically significant P < 0.05. | ||||
| Dyskinesia duration (% of the day) | 0.50 ± 0.89 | 0.85 ± 0.99 | 1.178 | 0.246 |
| Dyskinesia disability | 0.60 ± 1.14 | 0.90 ± 1.21 | 0.806 | 0.425 |
| Painful dyskinesia | 0.20 ± 0.41 | 0.60 ± 0.75 | 2.084 | 0.046* |
| Early morning dystonia | 0.20 ± 0.41 | 0.55 ± 0.69 | 1.957 | 0.059 |
| P | t | Dyskinesia | Group | |
|---|---|---|---|---|
| After stimulation | Before stimulation | |||
| *Statistically significant P < 0.05. | ||||
| < 0.001* | 5.729 | 7.35 ± 6.82 | 11.15 ± 7.65 | Study group |
| 0.585 | 0.556 | 10.85 ± 7.40 | 11.05 ± 7.57 | Control group |