Journal of Neurology Research, ISSN 1923-2845 print, 1923-2853 online, Open Access
Article copyright, the authors; Journal compilation copyright, J Neurol Res and Elmer Press Inc
Journal website http://www.neurores.org

Original Article

Volume 8, Number 3, November 2018, pages 26-33


Handwriting at Different Paces and Sizes With Visual Cues in Persons With Parkinson’s Disease

Figures

Figure 1.
Figure 1. (a) Picture of experimental set up. (b) Experimental design. (c) Example handwriting at the 2 cm target size from a person with PD. The top row is the fast condition; the bottom row is the self-selected condition. (d) Example of the digital representation of handwriting.
Figure 2.
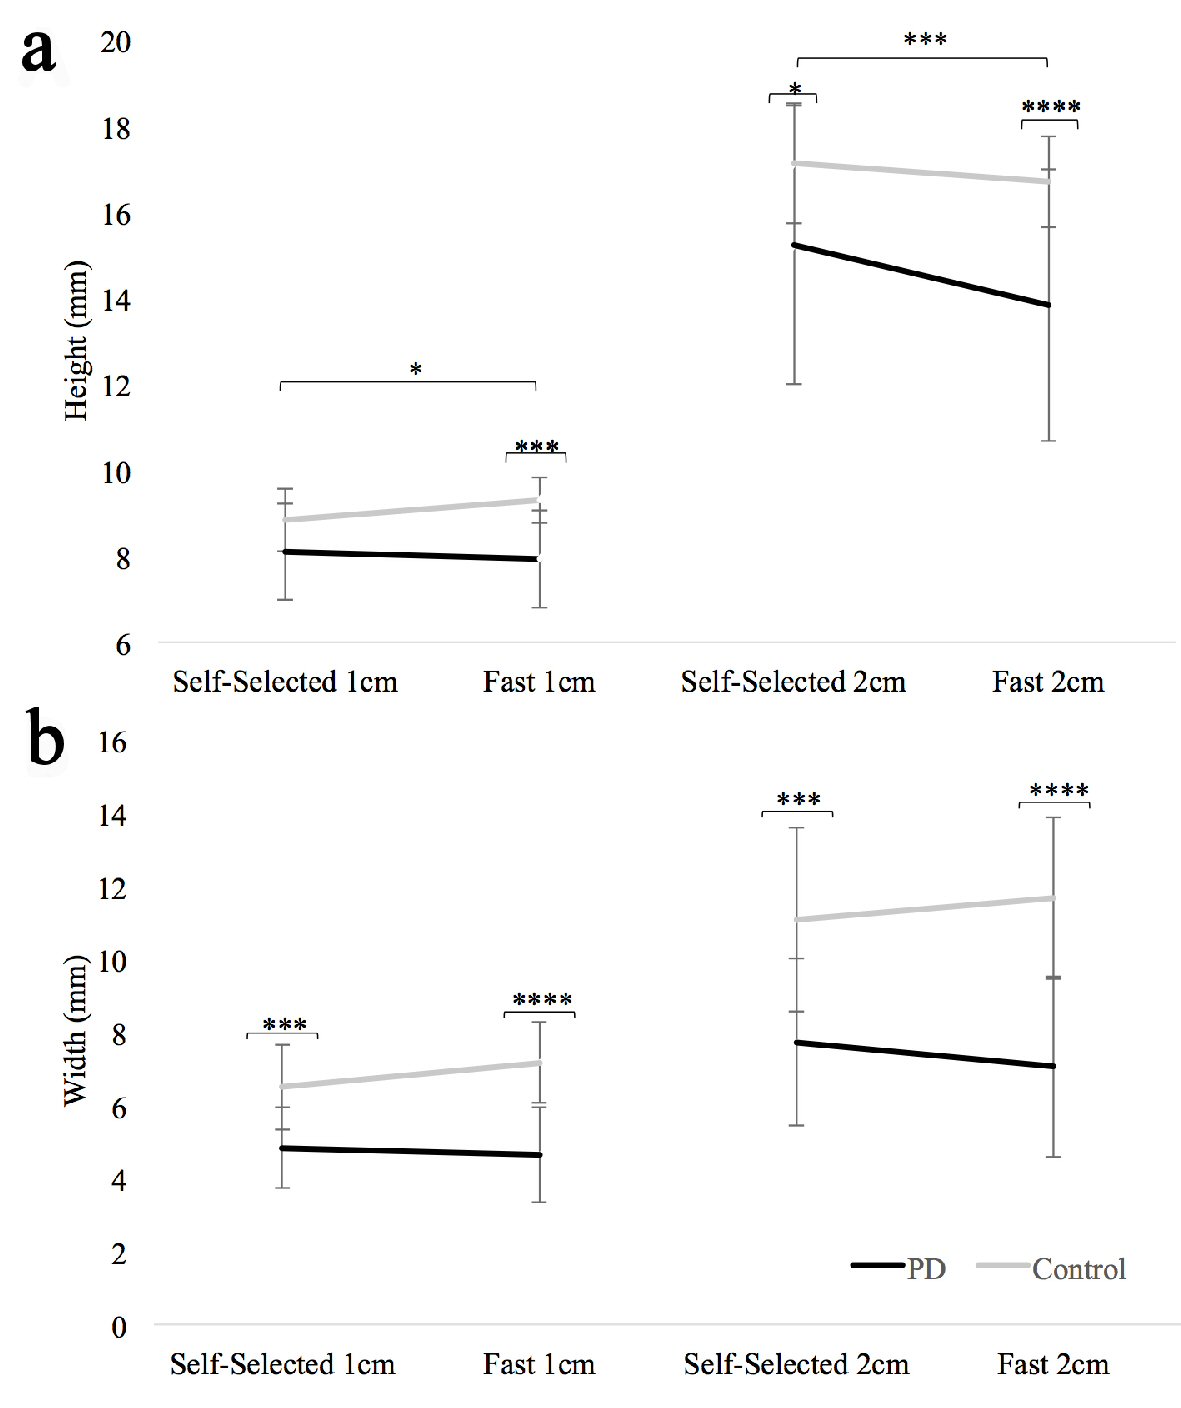
Figure 2. (a) Letter height for both groups at both paces (fast and self-selected) and both sizes (1 cm and 2 cm). (b) Letter width for both groups at both paces (fast and self-selected) and both sizes (1 cm and 2 cm). Standard error bars shown. Long horizontal bars show within group differences; the short horizontal bars show between group differences. *P < 0.05, ***P < 0.001, ****P < 0.0001.
Figure 3.
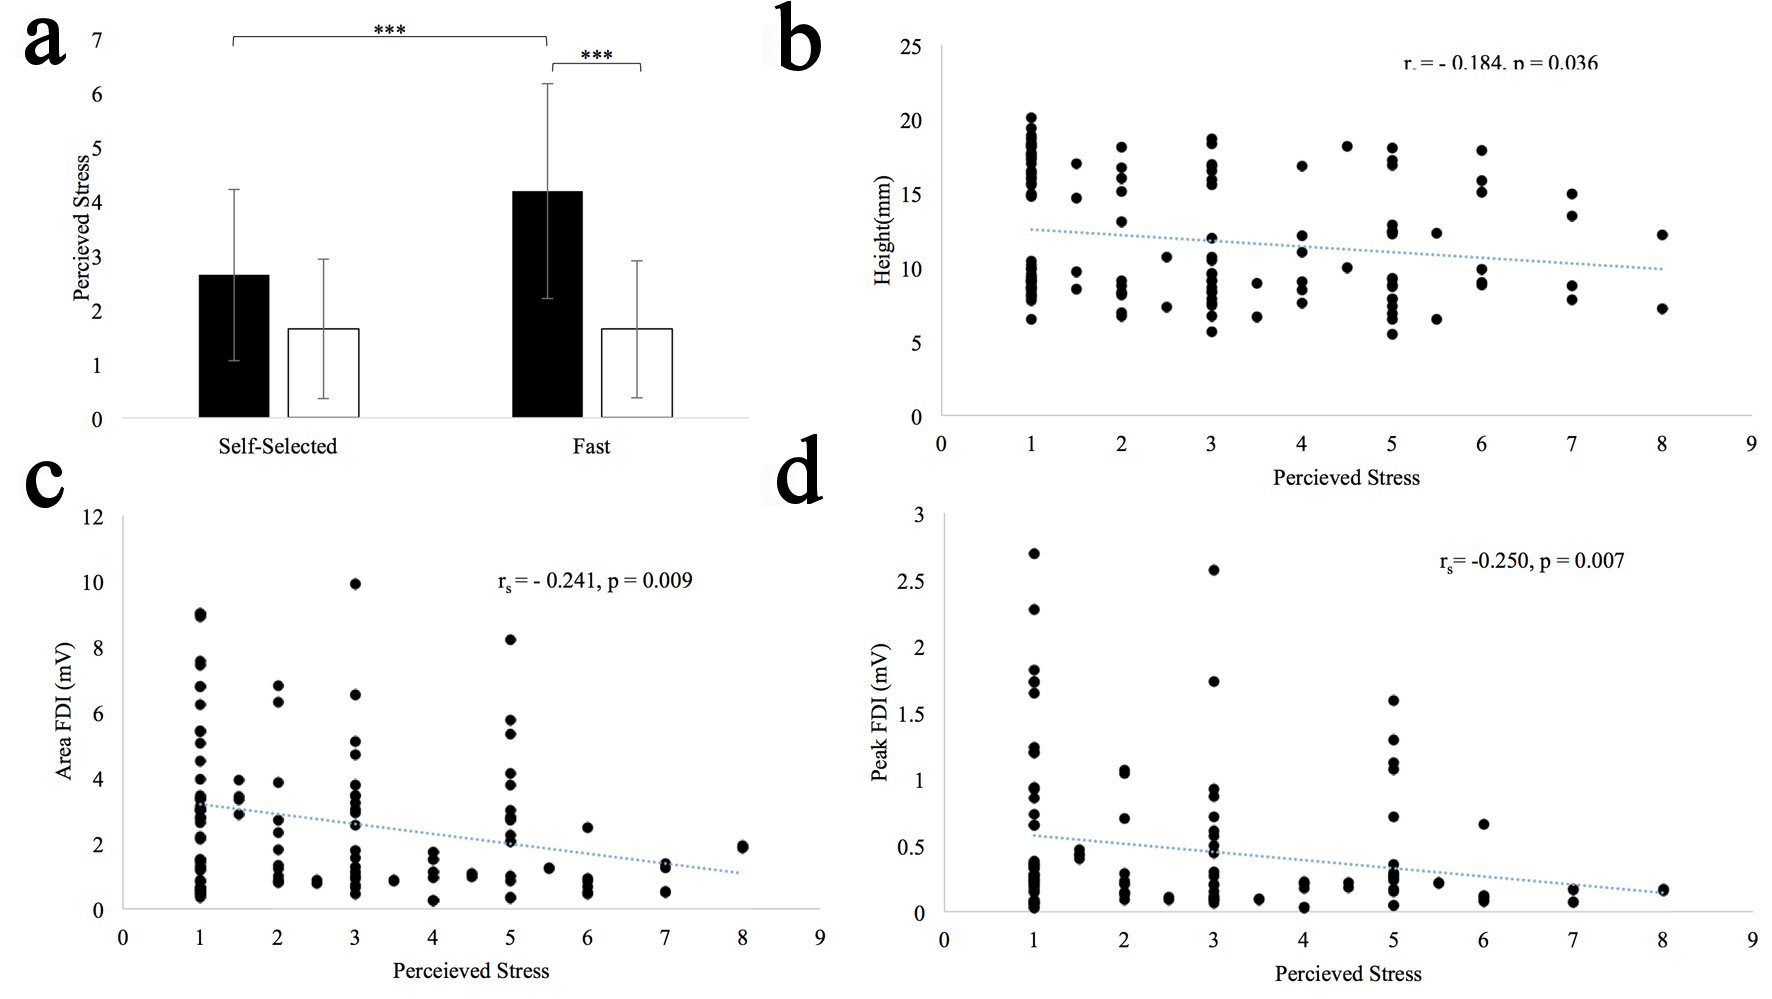
Figure 3. (a) Difference between perceived stress for self-selected and fast pace conditions. Standard error bars shown. Long horizontal bars show within group differences; the short horizontal bars show between group differences. ***P < 0.001. (b) Perceived stress vs. height scatter plot. (c) Perceived stress vs. peak FDI EMG scatter plot. (d) Perceived stress vs. FDI EMG scatter plot.

Tables

Table 1. Means and Standard Deviations for All Outcome Variables at Both Sizes and Both Paces
 
1 cm2 cm
Self-selectedFastSelf-selectedFast
For within subjects pace comparisons at either size (1 cm or 2 cm), *P < 0.05, **P < 0.01, ***P < 0.001. For between subjects’ comparisons for a particular size (1 cm or 2 cm) and pace (self-selected or fast), P < 0.05, ††P < 0.01, †††P < 0.001. Acc: acceleration; EDC: extensor digitorum communis; FDI: first dorsal interosseus; HOAs: healthy older adults; PD: persons with Parkinson’s disease; MT: movement time.
PD height (mm)8.1 ± 1.17.9 ± 1.1†††15.2 ± 3.2***,†13.8 ± 3.2***,†††
HOA height (mm)8.8 ± 0.7*9.3 ± 0.5*,†††17.1 ± 1.416.7 ± 1.1†††
PD width (mm)4.8 ± 1.1†††4.6 ± 1.3†††7.7 ± 2.3†††7.1 ± 2.5†††
HOA width (mm)6.5 ± 1.2†††7.2 ± 1.1†††11.1 ± 2.5†††11.7 ± 2.2†††
PD letters completed10.4 ± 5.2***15.2 ± 6.2***12.4 ± 5.4***17.2 ± 6.5***
HOA letters completed12.2 ± 4.3***17.5 ± 6.2***14.3 ± 4.6***20.8 ± 6.4***
PD MT (s)1.5 ± 0.7***1.1 ± 0.5***,†1.9 ± 0.9***1.2 ± 0.6***
HOA MT (s)1.1 ± 0.4**0.8 ± 0.3**,†1.4 ± 0.5***1.0 ± 0.4***
PD peak Acc (m/s2)7.5 ± 2.37.7 ± 2.08.1 ± 4.2*9.9 ± 4.3*
HOA peak Acc (m/s2)7.0 ± 1.7*9.5 ± 2.5*,†10.2 ± 3.612.5 ± 3.5
PD peak EDC (µV)80.4 ± 47.0*88.7 ± 47.3*85.1 ± 68.788.9 ± 54.9
HOA peak EDC (µV)63.1 ± 25.877.1 ± 53.183.4 ± 74.471.1 ± 33.9
PD peak FDI (µV)449 ± 538456 ± 547525 ± 625521 ± 634
HOA peak FDI (µV)268 ± 182**340 ± 201**334 ± 229318 ± 187
PD area EDC (mV)0.75 ± 0.38***0.89 ± 0.47***0.76 ± 0.550.82 ± 0.44
HOA area EDC (mV)0.69 ± 0.310.73 ± 0.310.69 ± 0.360.69 ± 0.28
PD area FDI (mV)2.15 ± 2.022.62 ± 2.602.32 ± 2.122.90 ± 2.79
HOA area FDI (mV)2.78 ± 2.543.11 ± 1.892.97 ± 1.872.67 ± 1.46
PD stress2.6 ± 1.6***4.2 ± 2.0***,†††2.6 ± 1.6***4.2 ± 2.0***,†††
HOA stress1.6 ± 1.31.6 ±1.3†††1.6 ± 1.31.6 ±1.3†††


Table 2. Spearman Partial Correlation Between Perceived Stress and All Other Outcome Variables After Controlling for Group, Size, and Pace
 
Perceived stress
rsP
*P < 0.05. **P < 0.01. ACC: acceleration; EDC: extensor digitorum communis; FDI: first dorsal interosseus; MT: movement time.
Height (mm)-0.184*0.036
Width (mm)0.0590.504
Letters completed0.1130.203
MT (s)-0.0950.285
Peak Acc (m/s2)0.1320.137
Peak EDC (µV)0.0490.579
Peak FDI (µV)-.250**0.007
Area EDC (mV)0 .0750.4
Area FDI (mV)-0.241**0.009