Journal of Neurology Research, ISSN 1923-2845 print, 1923-2853 online, Open Access
Article copyright, the authors; Journal compilation copyright, J Neurol Res and Elmer Press Inc
Journal website http://www.neurores.org

Original Article

Volume 7, Number 3, June 2017, pages 39-45


Transcranial Light Alters Melanopsin and Monoamine Production in Mouse (Mus musculus) Brain

Figures

Figure 1.
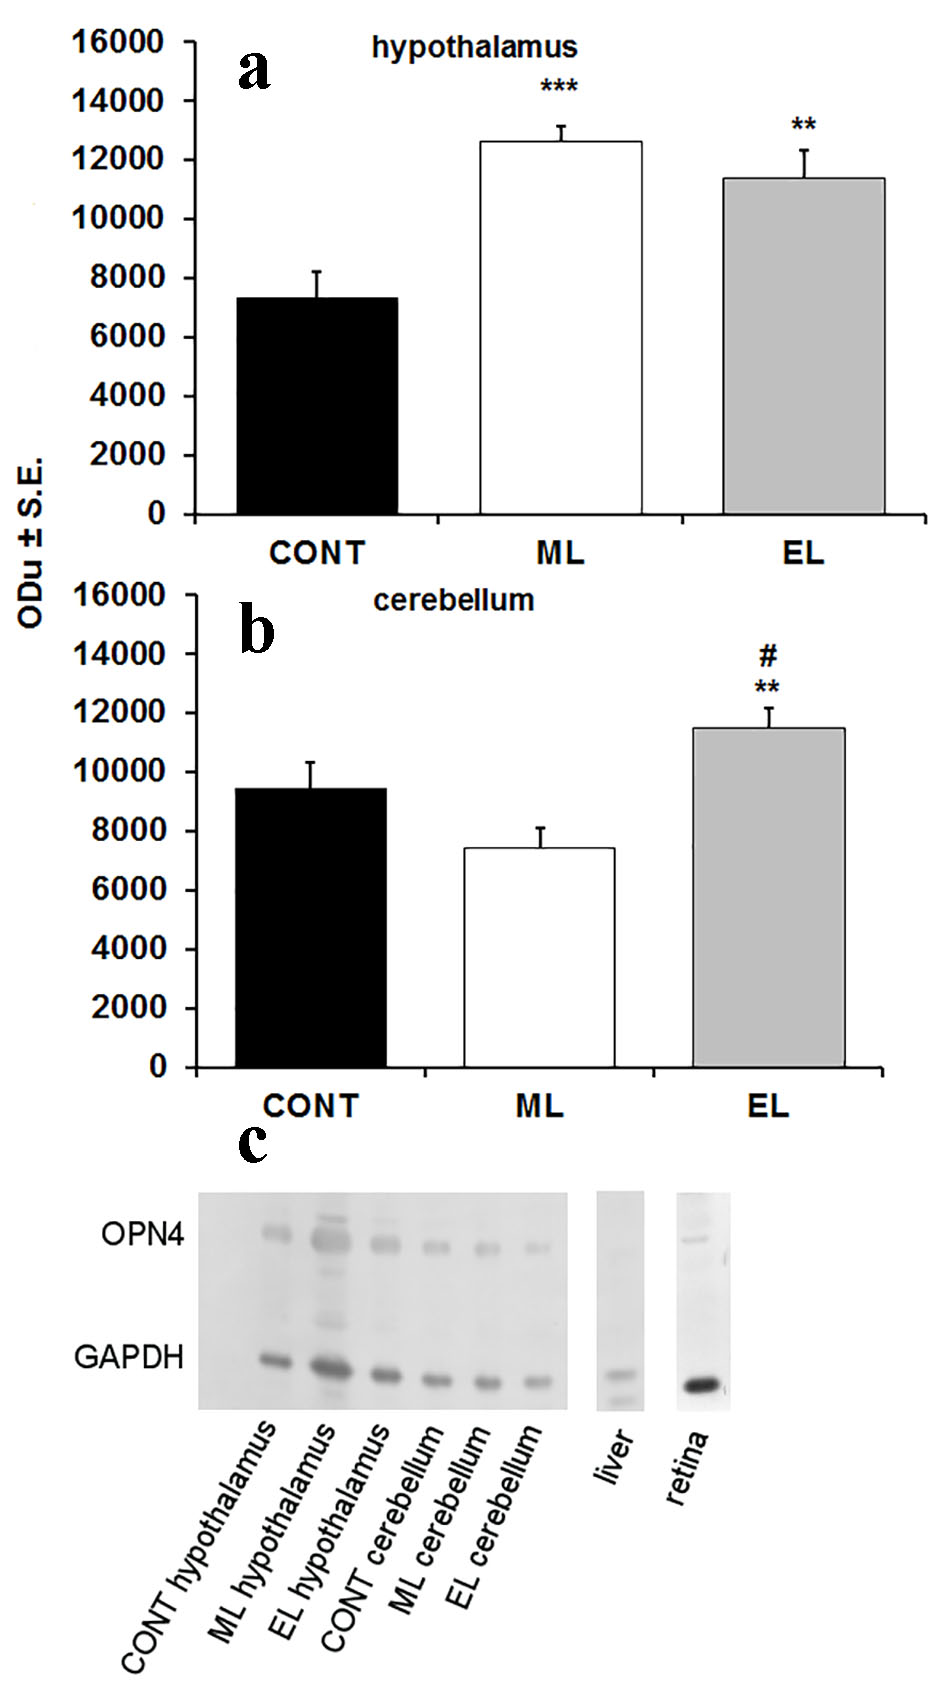
Figure 1. Expression of OPN4 in hypothalamus and cerebellum of mouse brain. (a) A bar graph summarizing results from Western blot analysis showing mean optical density (ODu) of OPN4 in relation to GAPDH in hypothalamus (N = 10 samples per group). **P < 0.01, ***P < 0.001; error bars indicate SE. (b) A bar graph summarizing results from Western blot analysis showing mean optical density (ODu) of OPN4 in relation to GAPDH in cerebellum (N = 10 samples per group). **P < 0.01; error bars indicate SE. # marks the significance compared to ML group, ##P < 0.001. (c) A representative Western blot membrane showing expression of OPN4 with a molecular weight of 53 kDa. GAPDH was used as a loading control with a molecular weight of 37 kDa. CONT: control group; ML: morning-light group; EL: evening-light group.
Figure 2.
Figure 2. Monoamine concentrations in mouse cortex, hypothalamus and cerebellum. (a) A bar graph summarizing results from HPLC analysis showing mean ng/mg in cortex. N = 10 samples per group. **P < 0.01. (b) A bar graph summarizing results from HPLC analysis showing mean ng/mg in hypothalamus. N = 8 - 10 samples per group. (c) A bar graph summarizing results from HPLC analysis showing mean ng/mg in cerebellum. N = 8 - 10 samples per group. CONT: control group; ML: morning-light group; EL: evening-light group. Error bars indicate SE.