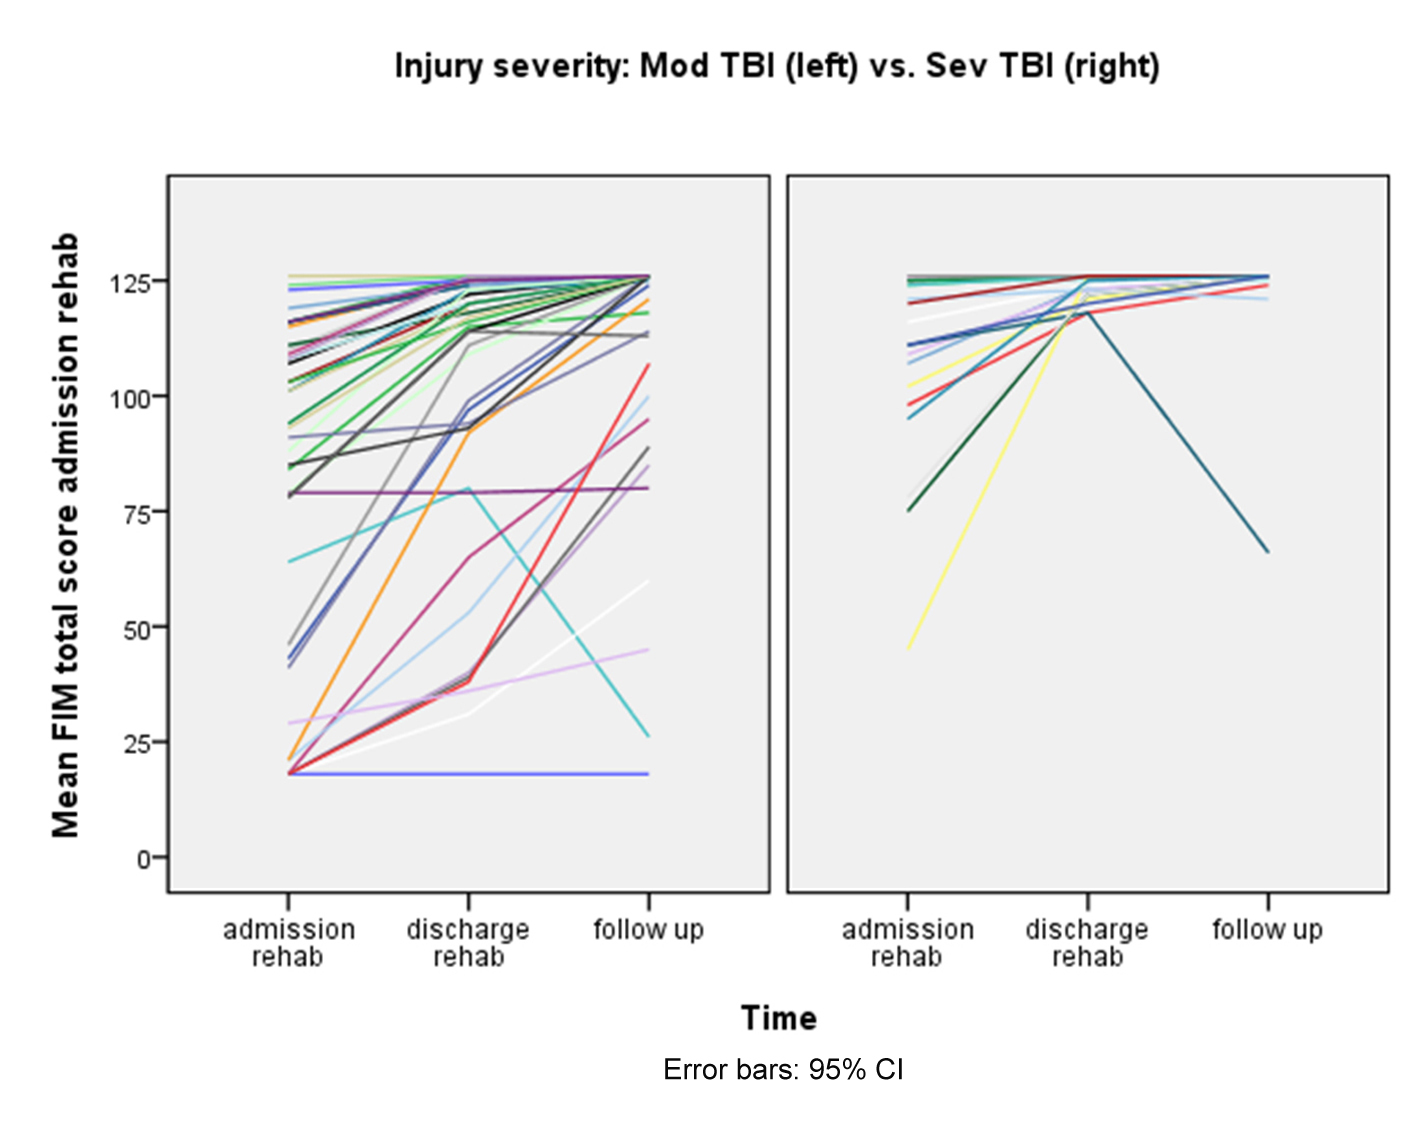
Figure 1. Individual FIM scores in moderate and severe TBI patients.
| Journal of Neurology Research, ISSN 1923-2845 print, 1923-2853 online, Open Access |
| Article copyright, the authors; Journal compilation copyright, J Neurol Res and Elmer Press Inc |
| Journal website http://www.neurores.org |
Original Article
Volume 1, Number 2, June 2011, pages 48-58
Functional Level During the First Year After Moderate and Severe Traumatic Brain Injury: Course and Predictors of Outcome
Figures
Tables
| Predictor | N (%) | FIM 12 months (SD) | Corr* | P-value |
|---|---|---|---|---|
| Numbers are given as mean values if not otherwise indicated. M/F: Male/Female; PTA: Post-Traumatic Amnesia; LOS acute: Length of Stay acute hospitalization; LOS rehab: Length of Stay in rehabilitation hospital; GCS acute: Glasgow Coma Scale acute hospitalization; GCS rehab: Glasgow Coma Scale in rehabilitation hospital; FIM Adm/Disch: Functional Independence Measure Admission/Discharge. * Spearman’s Rank Order Correlation. N = 63 due to missing FIM values in 2 out of 65 subjects. Missing 17 responses in the education predictor. Missing 11 responses in the complication predictor. | ||||
| Place of acute care | ||||
| Regional hospital | 48 (76) | 113 (± 26) | 0.229 | |
| Level 1 trauma center | 15 (24) | 119 (± 21) | ||
| Rehab team (yes/no) | 50 (79)/13 (21) | 112 (± 28)/125 (± 4) | 0.101 | |
| Gender M/F | 48 (76)/15 (24) | 115 (± 23)/111 (± 32) | 0.280 | |
| Age | 63 (100) | -0.072 | 0.575 | |
| Civil status (alone/live with) | 30 (48)/32 (52) | 117 (± 19)/112 (± 30) | 0.670 | |
| Education (< 12/≥ 12) | 24 (52)/22 (48) | 116 (± 25)/122 (± 17) | 0.943 | |
| Alcohol/drug (yes/no) | 17 (16)/43 (26) | 120 (± 16)/113 (± 26) | 0.140 | |
| Other injuries (none/≥ 1) | 38 (60)/25 (40) | 121 (± 16)/110 (± 29) | 0.067 | |
| Complications (none/≥ 1) | 15 (29)/37 (71) | 117(± 19)/106 (± 36) | 0.015 | |
| Injury severity | ||||
| Moderate TBI | 21 (33) | 123 (± 13) | < 0.001 | |
| Severe TBI | 42 (66) | 110 (± 29) | ||
| Injury mechanism | ||||
| Traffic accidents | 32 (51) | 114 (± 28) | 0.424 | |
| Falling | 23 (37) | 112 (± 25) | ||
| Violence, sports, other | 8 (13) | 126 (± 1) | ||
| Injury localization | ||||
| Frontal | 17 (28) | 115 (± 25) | 0.699 | |
| Non-frontal | 43 (72) | 116 (± 23) | ||
| PTA duration (days) | 63 (100) | -0.512 | < 0.001 | |
| LOS acute | 63 (100) | -0.357 | < 0.004 | |
| LOS rehab | 63 (100) | -0.397 | < 0.001 | |
| GCS acute | 62 (100) | -0.377 | < 0.002 | |
| GCS rehab | 63 (100) | 0.536 | < 0.001 | |
| FIM adm | 63 (100) | 0.588 | < 0.001 | |
| FIM disch | 63 (100) | 0.708 | < 0.001 | |
| Variable | B Coefficient (95% CI) | P-value |
|---|---|---|
| Adjusted R Square for the model: 0.474. *Number of patients, N = 63. | ||
| Constant | 32.195 (-7.673 - 72.062) | 0.111 |
| Gender | -8.013 (-19.313 - 3.286) | 0.161 |
| PTA duration | -0.211 (-0.391 - -0.031) | 0.022 |
| LOS rehab | 0.419 (0.059 - 0.778) | 0.023 |
| GCS rehab | 5.234 (2.476 - 7.993) | < 0.001 |
| FIM adm | 0.180 (-0.082 - 0.441) | 0.174 |
| Adm rehab. (± SD) | Disch rehab. (± SD) | 12 months (± SD) | P-value | |
|---|---|---|---|---|
| Values are given as mean if not otherwise specified. FIM total: Functional Independence Measure total score (best score 126); FIM-M: FIM Motor sub-score (best score 91); FIM-COG: Cognitive sub-score (best score 35). P-values are given with post hoc Bonferroni correction. * N = 42 at 12 months follow-up. ** P-value between adm rehab and disch rehab. *** P-value between adm rehab and 12 months follow-up. **** P-value between disch rehab and 12 months follow-up. | ||||
| Moderate TBI (n = 21) | ||||
| FIM total | 109 (± 21) | 124 (± 3) | 123 (± 13) | 0.005** 0.009*** 1.000**** |
| FIM-M | 82 (± 15) | 91 (± 9) | 89 (± 9) | 0.018** 0.083*** 1.000**** |
| FIM-COG | 27 (± 8) | 33 (± 3) | 34 (± 4) | < 0.001** < 0.001*** 1.000**** |
| Severe TBI (n = 44*) | ||||
| FIM total | 81 (± 5) | 101 (± 5) | 113 (± 29) | < 0.001** < 0.001*** 0.005**** |
| FIM-M | 60 (± 4) | 75 (± 4) | 83 (± 4) | < 0.001** < 0.001*** 0.050**** |
| FIM-COG | 22 (± 2) | 28 (± 2) | 29 (± 2) | 0.005** < 0.001*** 1.000**** |