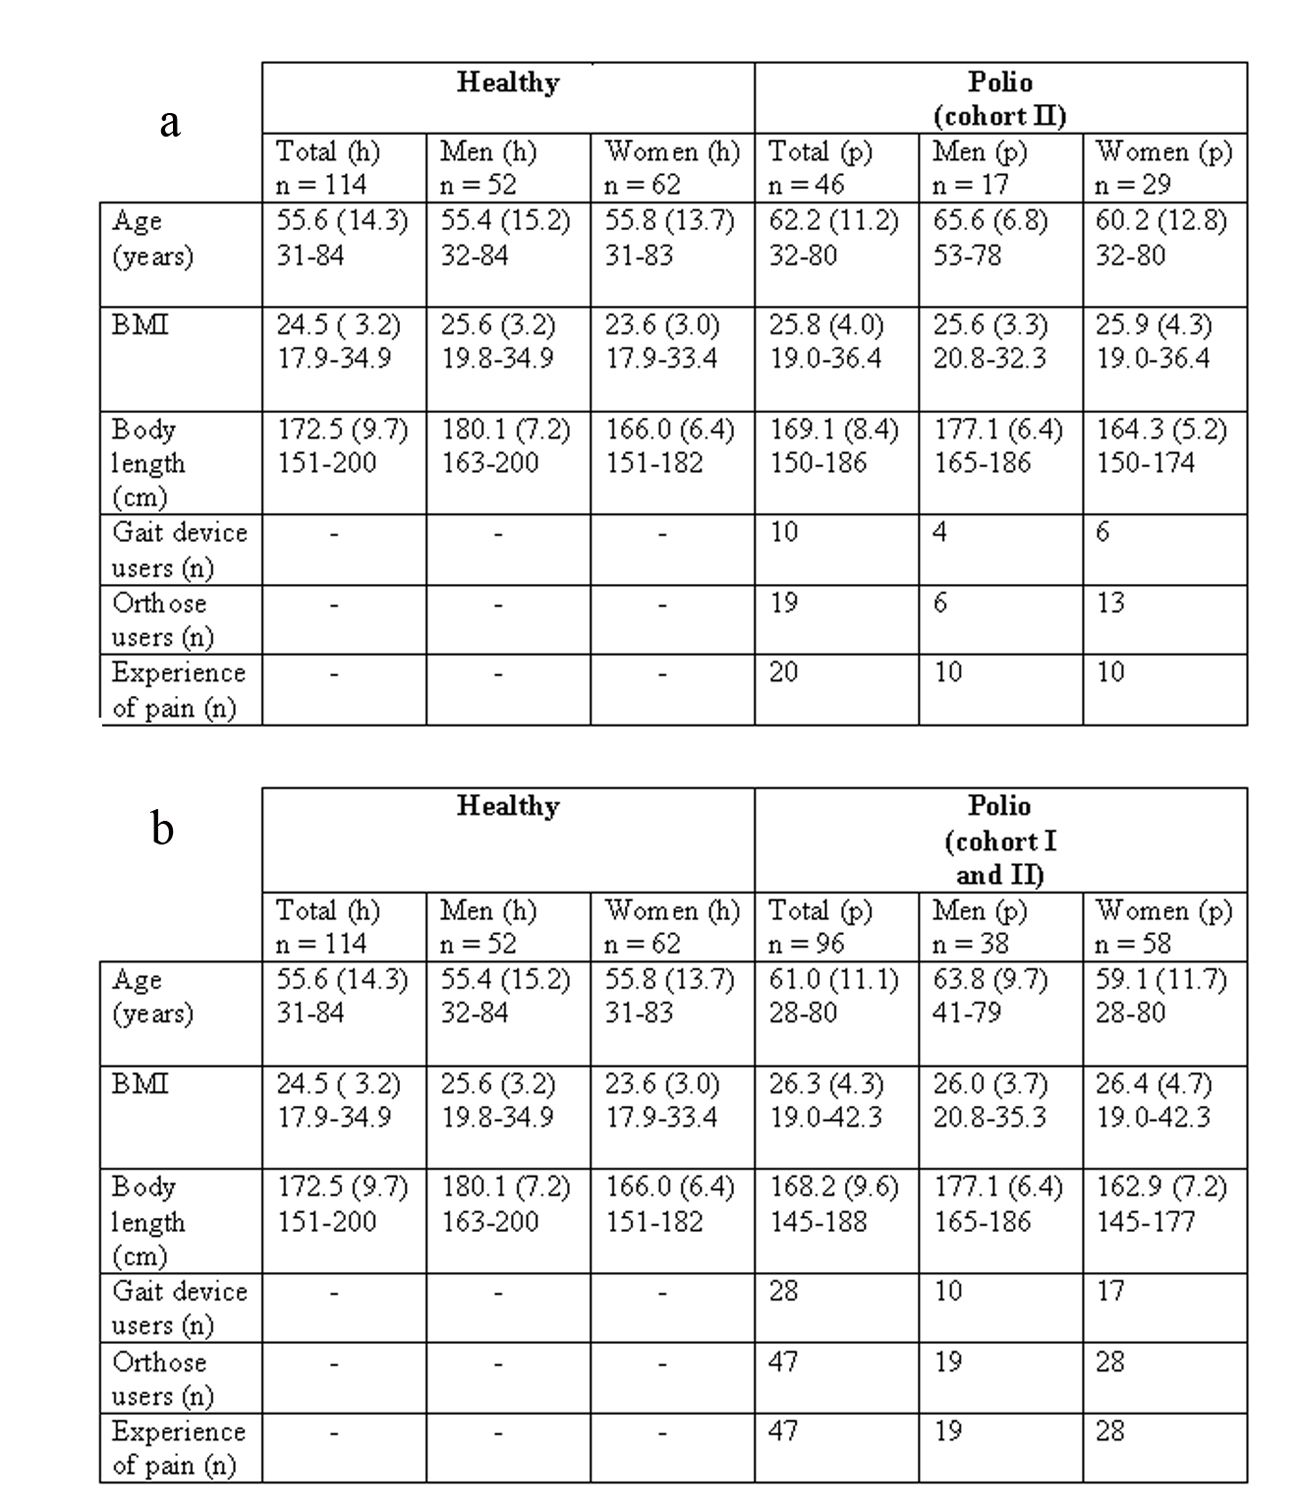
Figure 1. (a). Background data showing mean values, standard deviations (SD) and minimum-maximum values for the healthy group (h) and the polio group (p), cohort II, with gender subgroups, and characteristics for the polio group in number of persons. (b). Background data showing mean values, standard deviations (SD) and minimum-maximum values for the healthy group (h) and the polio group (p), cohort I and II, with gender subgroups, and characteristics for the polio group in number of persons.
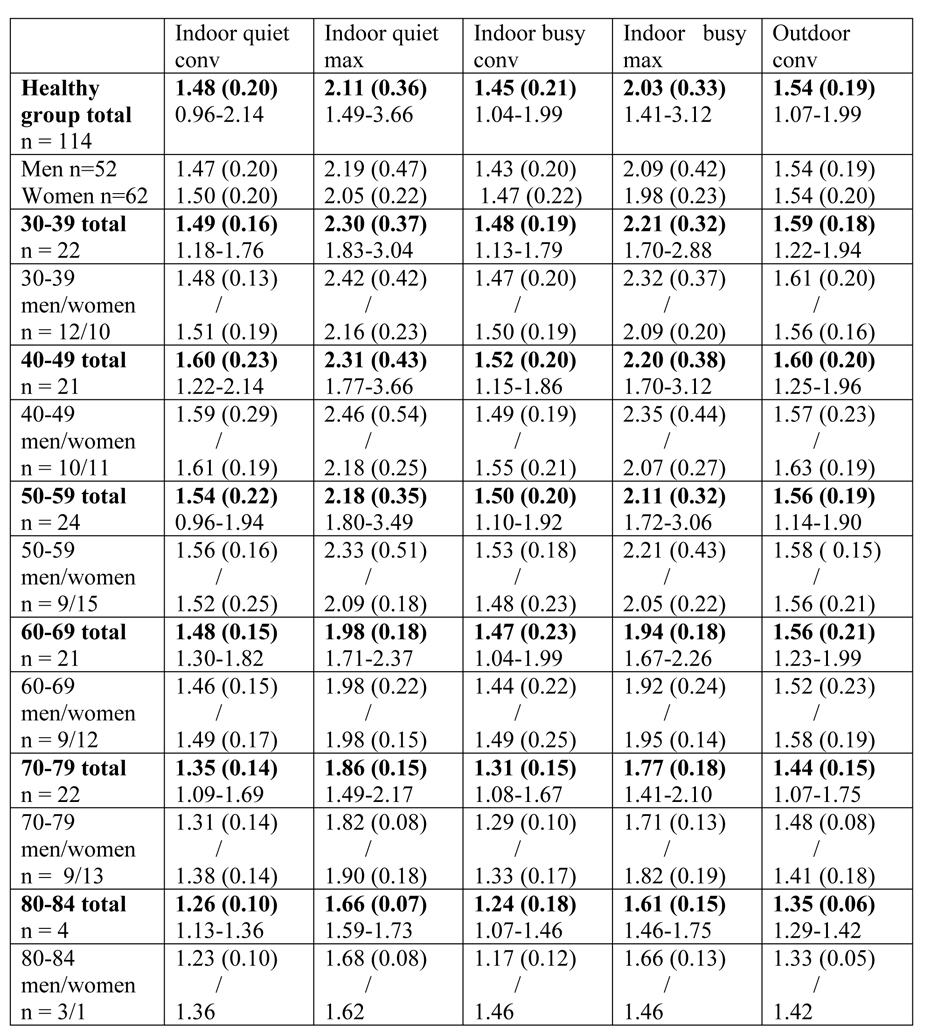
Figure 2. Results of the walking speed tests in the healthy group indoors on two locations and outdoors. Mean values, standard deviations (SD) and minimum-maximum values are given in m/s for the whole group and for age cohorts. For gender subgroups mean values and standard deviations are presented.
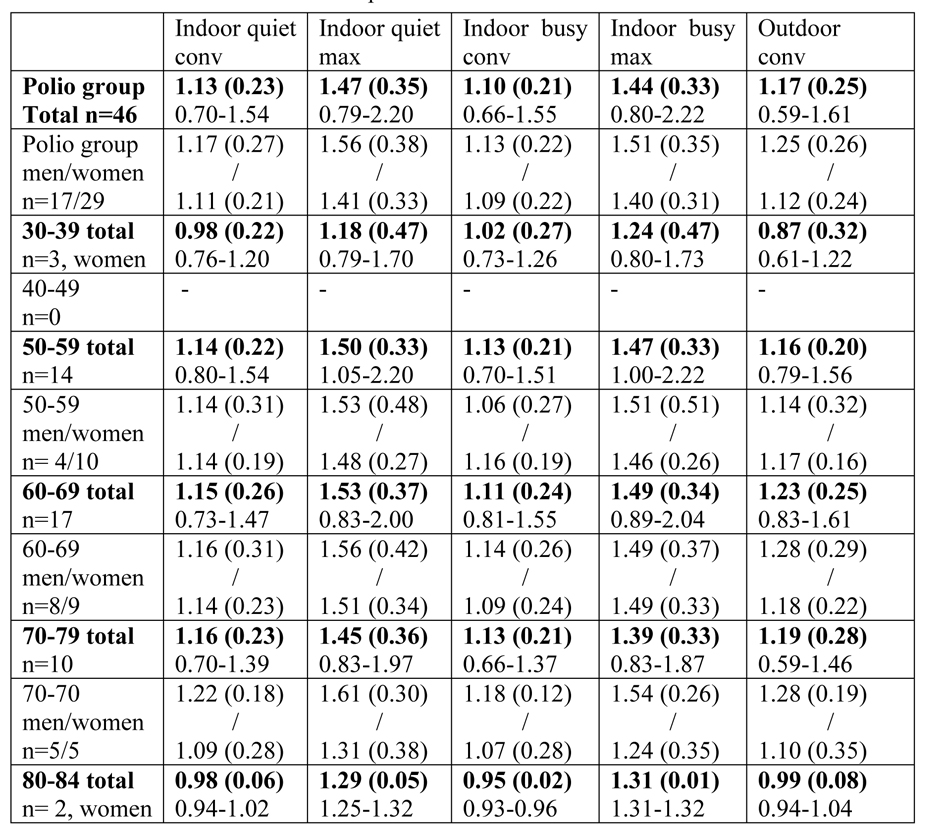
Figure 3. Results of the walking speed tests in the polio group indoors on two locations and outdoors. Mean values, standard deviations (SD) and minimum-maximum values are given in m/s for the whole group and for age cohorts. For gender subgroups mean values and standard deviations are presented.