Journal of Neurology Research, ISSN 1923-2845 print, 1923-2853 online, Open Access
Article copyright, the authors; Journal compilation copyright, J Neurol Res and Elmer Press Inc
Journal website http://www.neurores.org

Original Article

Volume 3, Number 2, April 2013, pages 56-61


Stimulating Aδ and C-Fibers in the Lower Limb With a 980 nm Diode Laser

Figures

Figure 1.
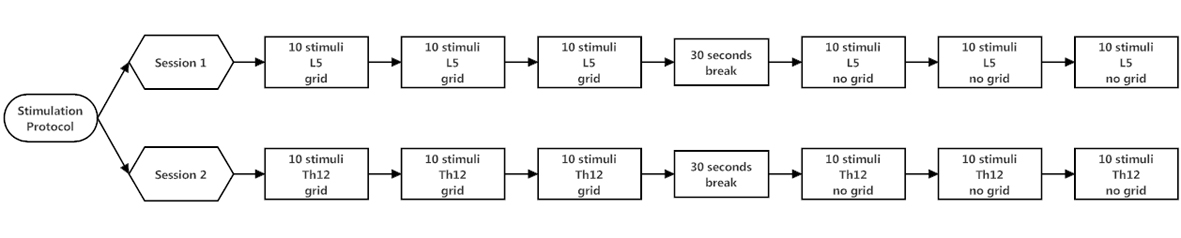
Figure 1. Stimulation protocol. Each stimulation block comprises ten cutaneous laser stimuli, followed by a short break of 30 seconds. First, three stimulation blocks were applied at the dorsum of the right foot (L5 dermatoma) with grid. Three stimulation blocks were applied at the same location without the use of a grid. After a 20 minute break, three stimulation blocks were applied at the 12th thoracic vertebra (Th12 dermatoma) with grid. Subsequently followed by three stimulation blocks without grid at the same location.
Figure 2.
Figure 2. Grand averages of laser evoked potential recordings during stimulation block L5no-grid.
Figure 3.
Figure 3. Grand averages of laser evoked potential recordings during stimulation block Th12no-grid.

Tables

Table 1. Laser-Evoked Potentials Peak Latencies (P2) and Reaction Times (RT)
 
L5no-grid latencyL5no-grid RTTh12no-grid latencyTh12no-grid RTL5grid RTTh12grid RT
Mean (ms)4137843305371,391710
SD (ms)5333447146336195


Table 2. Conduction Velocities (CV) of Peripheral Aδ Fibers and C Fibers
 
CVLEP no gridCVRT no gridCVRT grid
Conduction velocities (CV) of peripheral Aδ fibers (CVLEP no grid and CVRT no grid) and C fibers (CVRT grid).
Median (m/s)13.85.81.9
Range (m/s)4.7 - 45.41.2 - 43.30.8 - 3.7