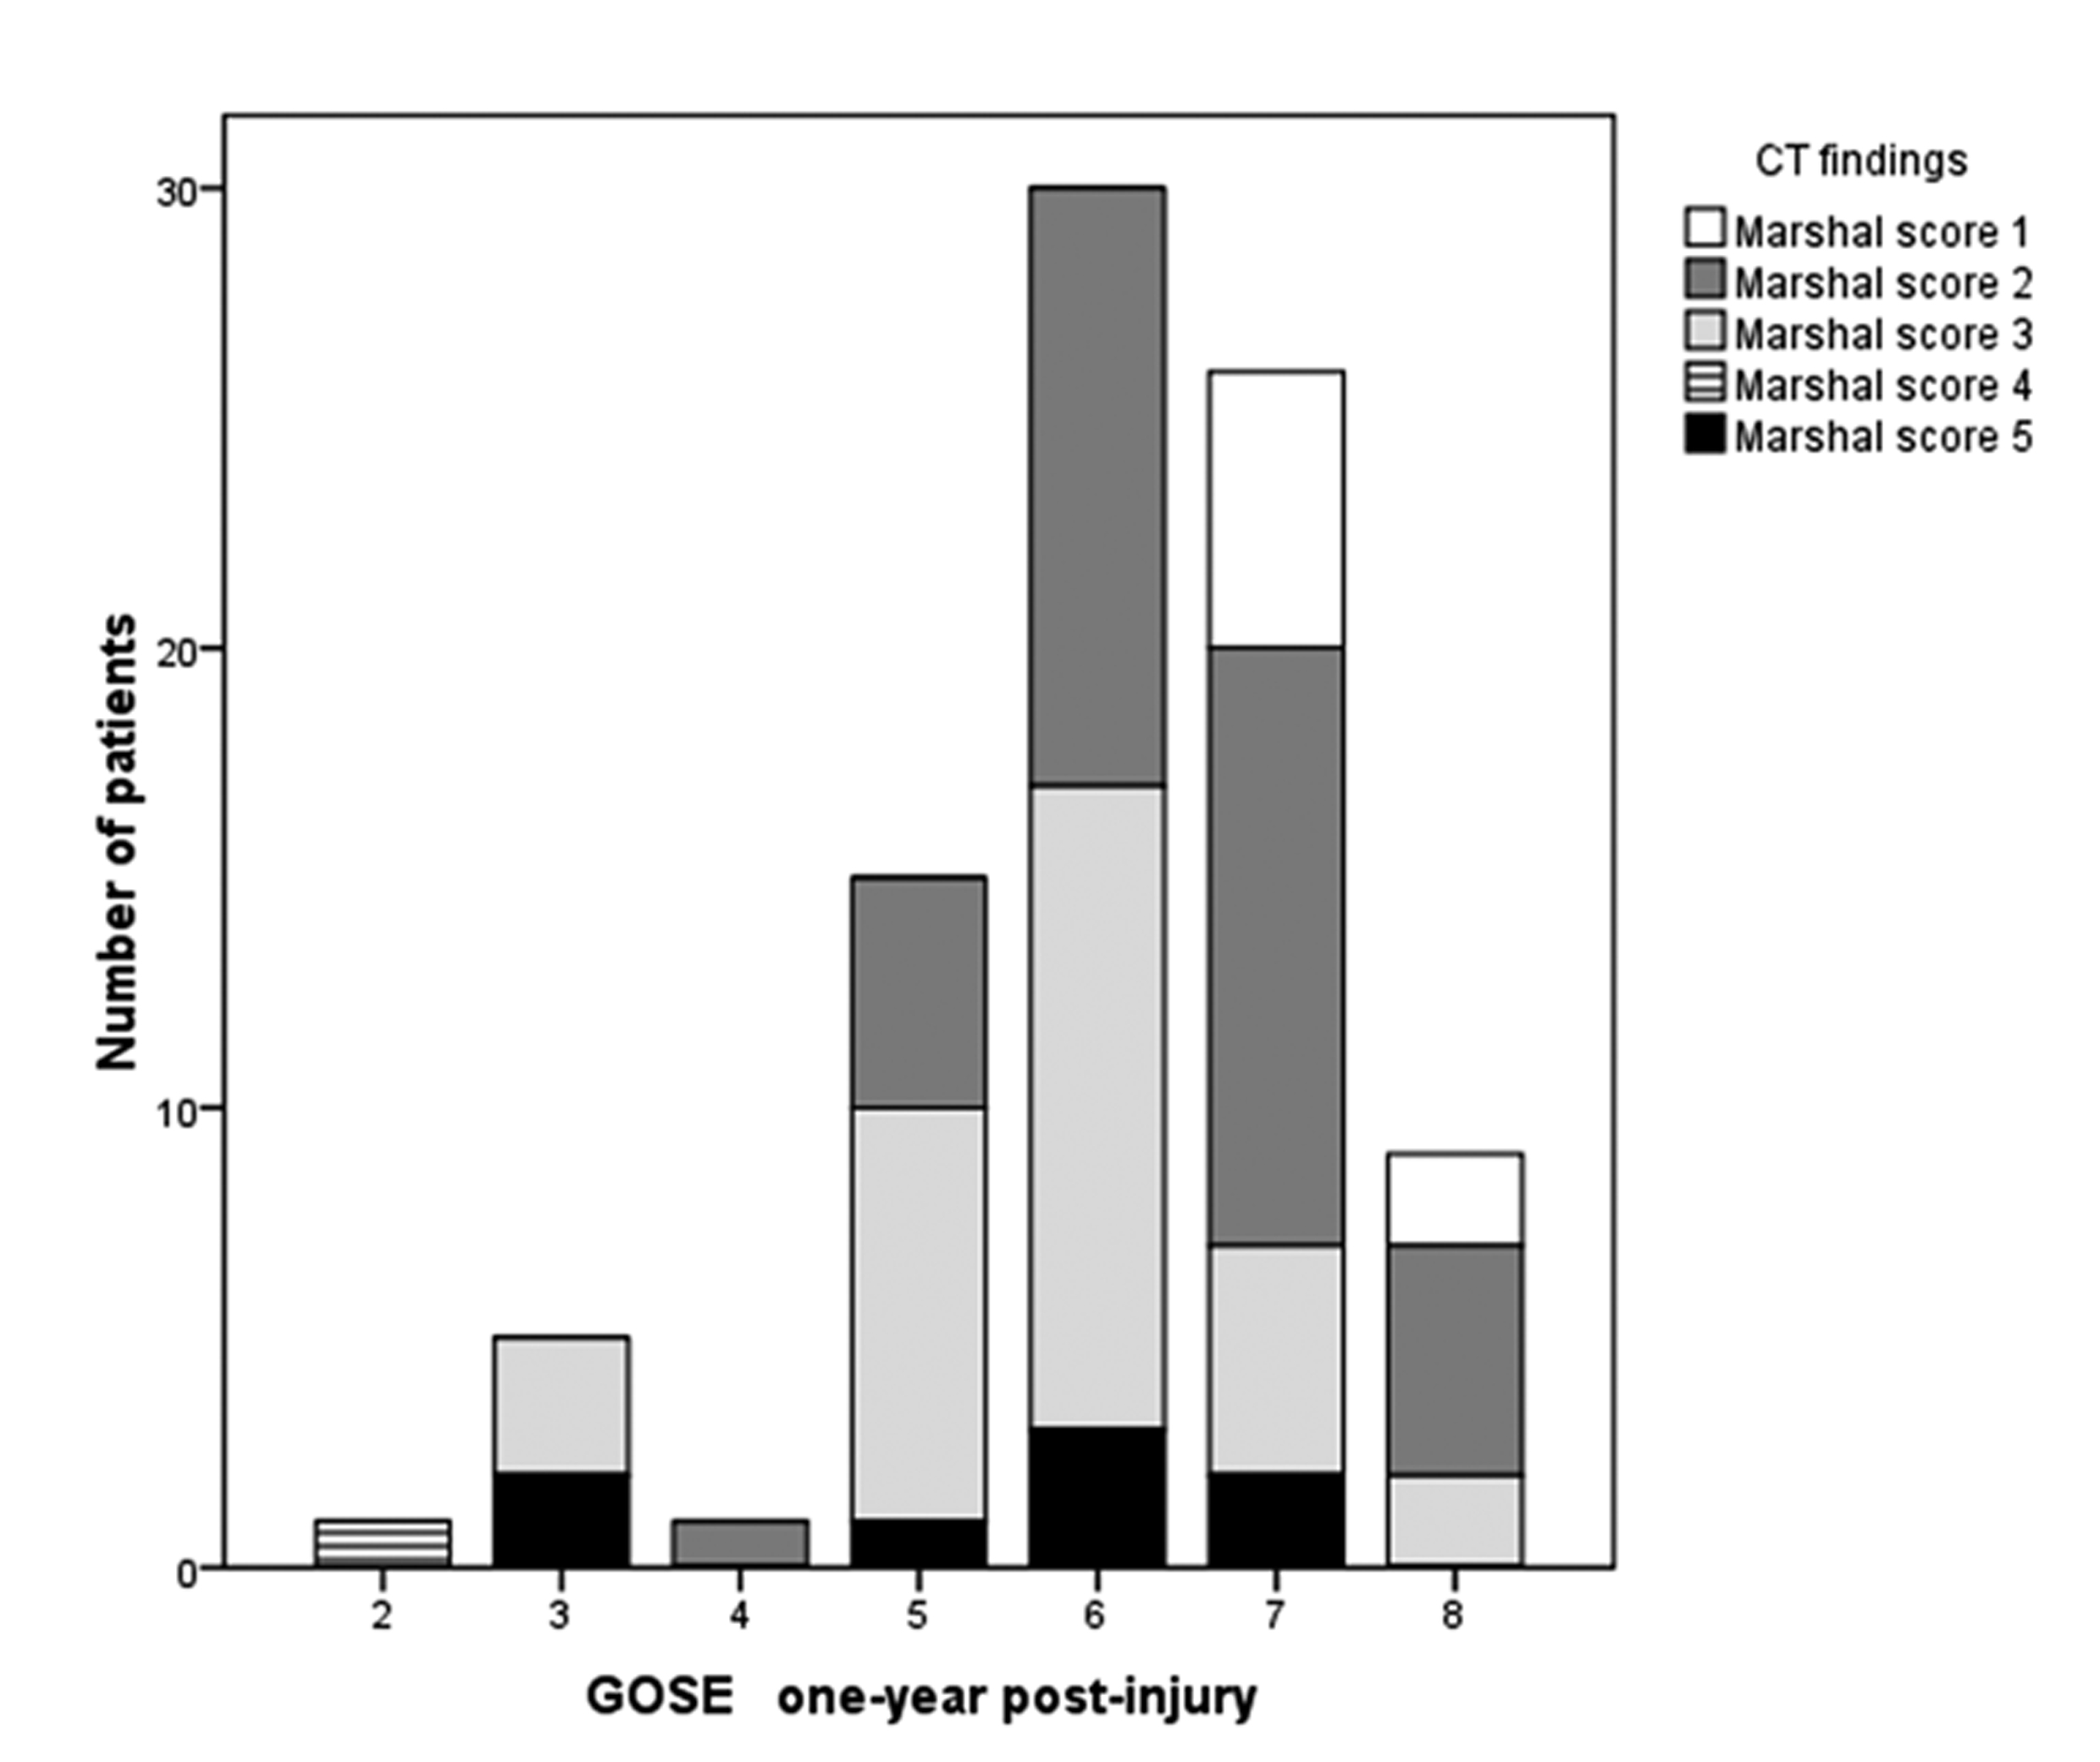
Figure 1. The distribution of CT findings as measured by Marshall scores across GOSE levels one year post-injury.
| Journal of Neurology Research, ISSN 1923-2845 print, 1923-2853 online, Open Access |
| Article copyright, the authors; Journal compilation copyright, J Neurol Res and Elmer Press Inc |
| Journal website http://www.neurores.org |
Original Article
Volume 2, Number 4, August 2012, pages 134-144
Predicting Functional Outcome One Year After Traumatic Brain Injury With CT and MRI Findings
Figures
Tables
| Independent variables | n (%) | GOSE mean (SD) | P-value* |
|---|---|---|---|
| P-values* reported are from the simple regression analysis. | |||
| Gender: M/F | 65 (75)/32 (25) | 5.7 (2.0)/ 5.9 (2.3) | 0.12 |
| Age at onset (years), mean (range) | 31 (16 - 55) | 0.27 | |
| Marital status (pre-injury) | |||
| Living with a spouse/ Living alone | 53 (61)/34 (39) | 5.8 (2.1)/5.7 (2.3) | 0.51 |
| Education (pre-injury) | |||
| ≤ 12 years / > 12 years | 48 (52)/39 (45) | 5.2 (2.39/6.7 (1.2) | 0.22 |
| Cause of injury | |||
| Transport accidents/Others | 52 (60)/35 (40) | 5.5 (2.2)/6.0 (2.2) | 0.14 |
| Substance use at injury time (no/yes) | 42 (48)/45 (52) | 5.8 (1.8)/6.0 (1.8) | 0.85 |
| Severity of injury | |||
| GCS, mean (SD) | 7.1 (3.3) | < 0.001 | |
| ISS, mean (SD) | 31.8 (12.7) | 0.001 | |
| Dilated pupils (no/yes) | 28 (32)/59 (68) | 6.4 (1.0)/5.5 (1.4) | 0.001 |
| Hypoxemia (oxygen saturation ≤ 90 %), (no/yes) | 18 (21)/69 (79) | 6.3 (1.2)/5.1 (1.4) | < 0.001 |
| Hypotension (mean arterial pressure ≤ 60 mmHg), (no/yes) | 12 (14)/75 (86) | 6.2 (1.1)/5.2 (1.8) | 0.01 |
| Intracranial pressure monitoring (ICP), (no/yes) | 51 (59)/36 /41) | 6.7 (0.8)/5.6 (1.4) | < 0.001 |
| CT head (Marshall score), mean (range) | 2.6 (0 - 6) | < 0.001 | |
| Presence of tSAH, (no/yes) | 57 (65)/30 (35) | 6.0 (1.8) /4.9 (2.3) | 0.03 |
| Presence of EDH, (no/yes) | 18 (21)/69 (79) | 5.1 (2.3)/5.8 (2.1) | 0.25 |
| Presence of SDH, (no/yes) | 44 (50)/43 (50) | 5.7 (2.1)/4.8 (2.3) | 0.02 |
| Presence of IVH, (no/yes) | 29 (34)/58 (66) | 5.7 (2.2)/4.4 (2.2) | < 0.001 |
| Length of acute hospital stay, days median (IQR) | 23 (30) | < 0.001 | |
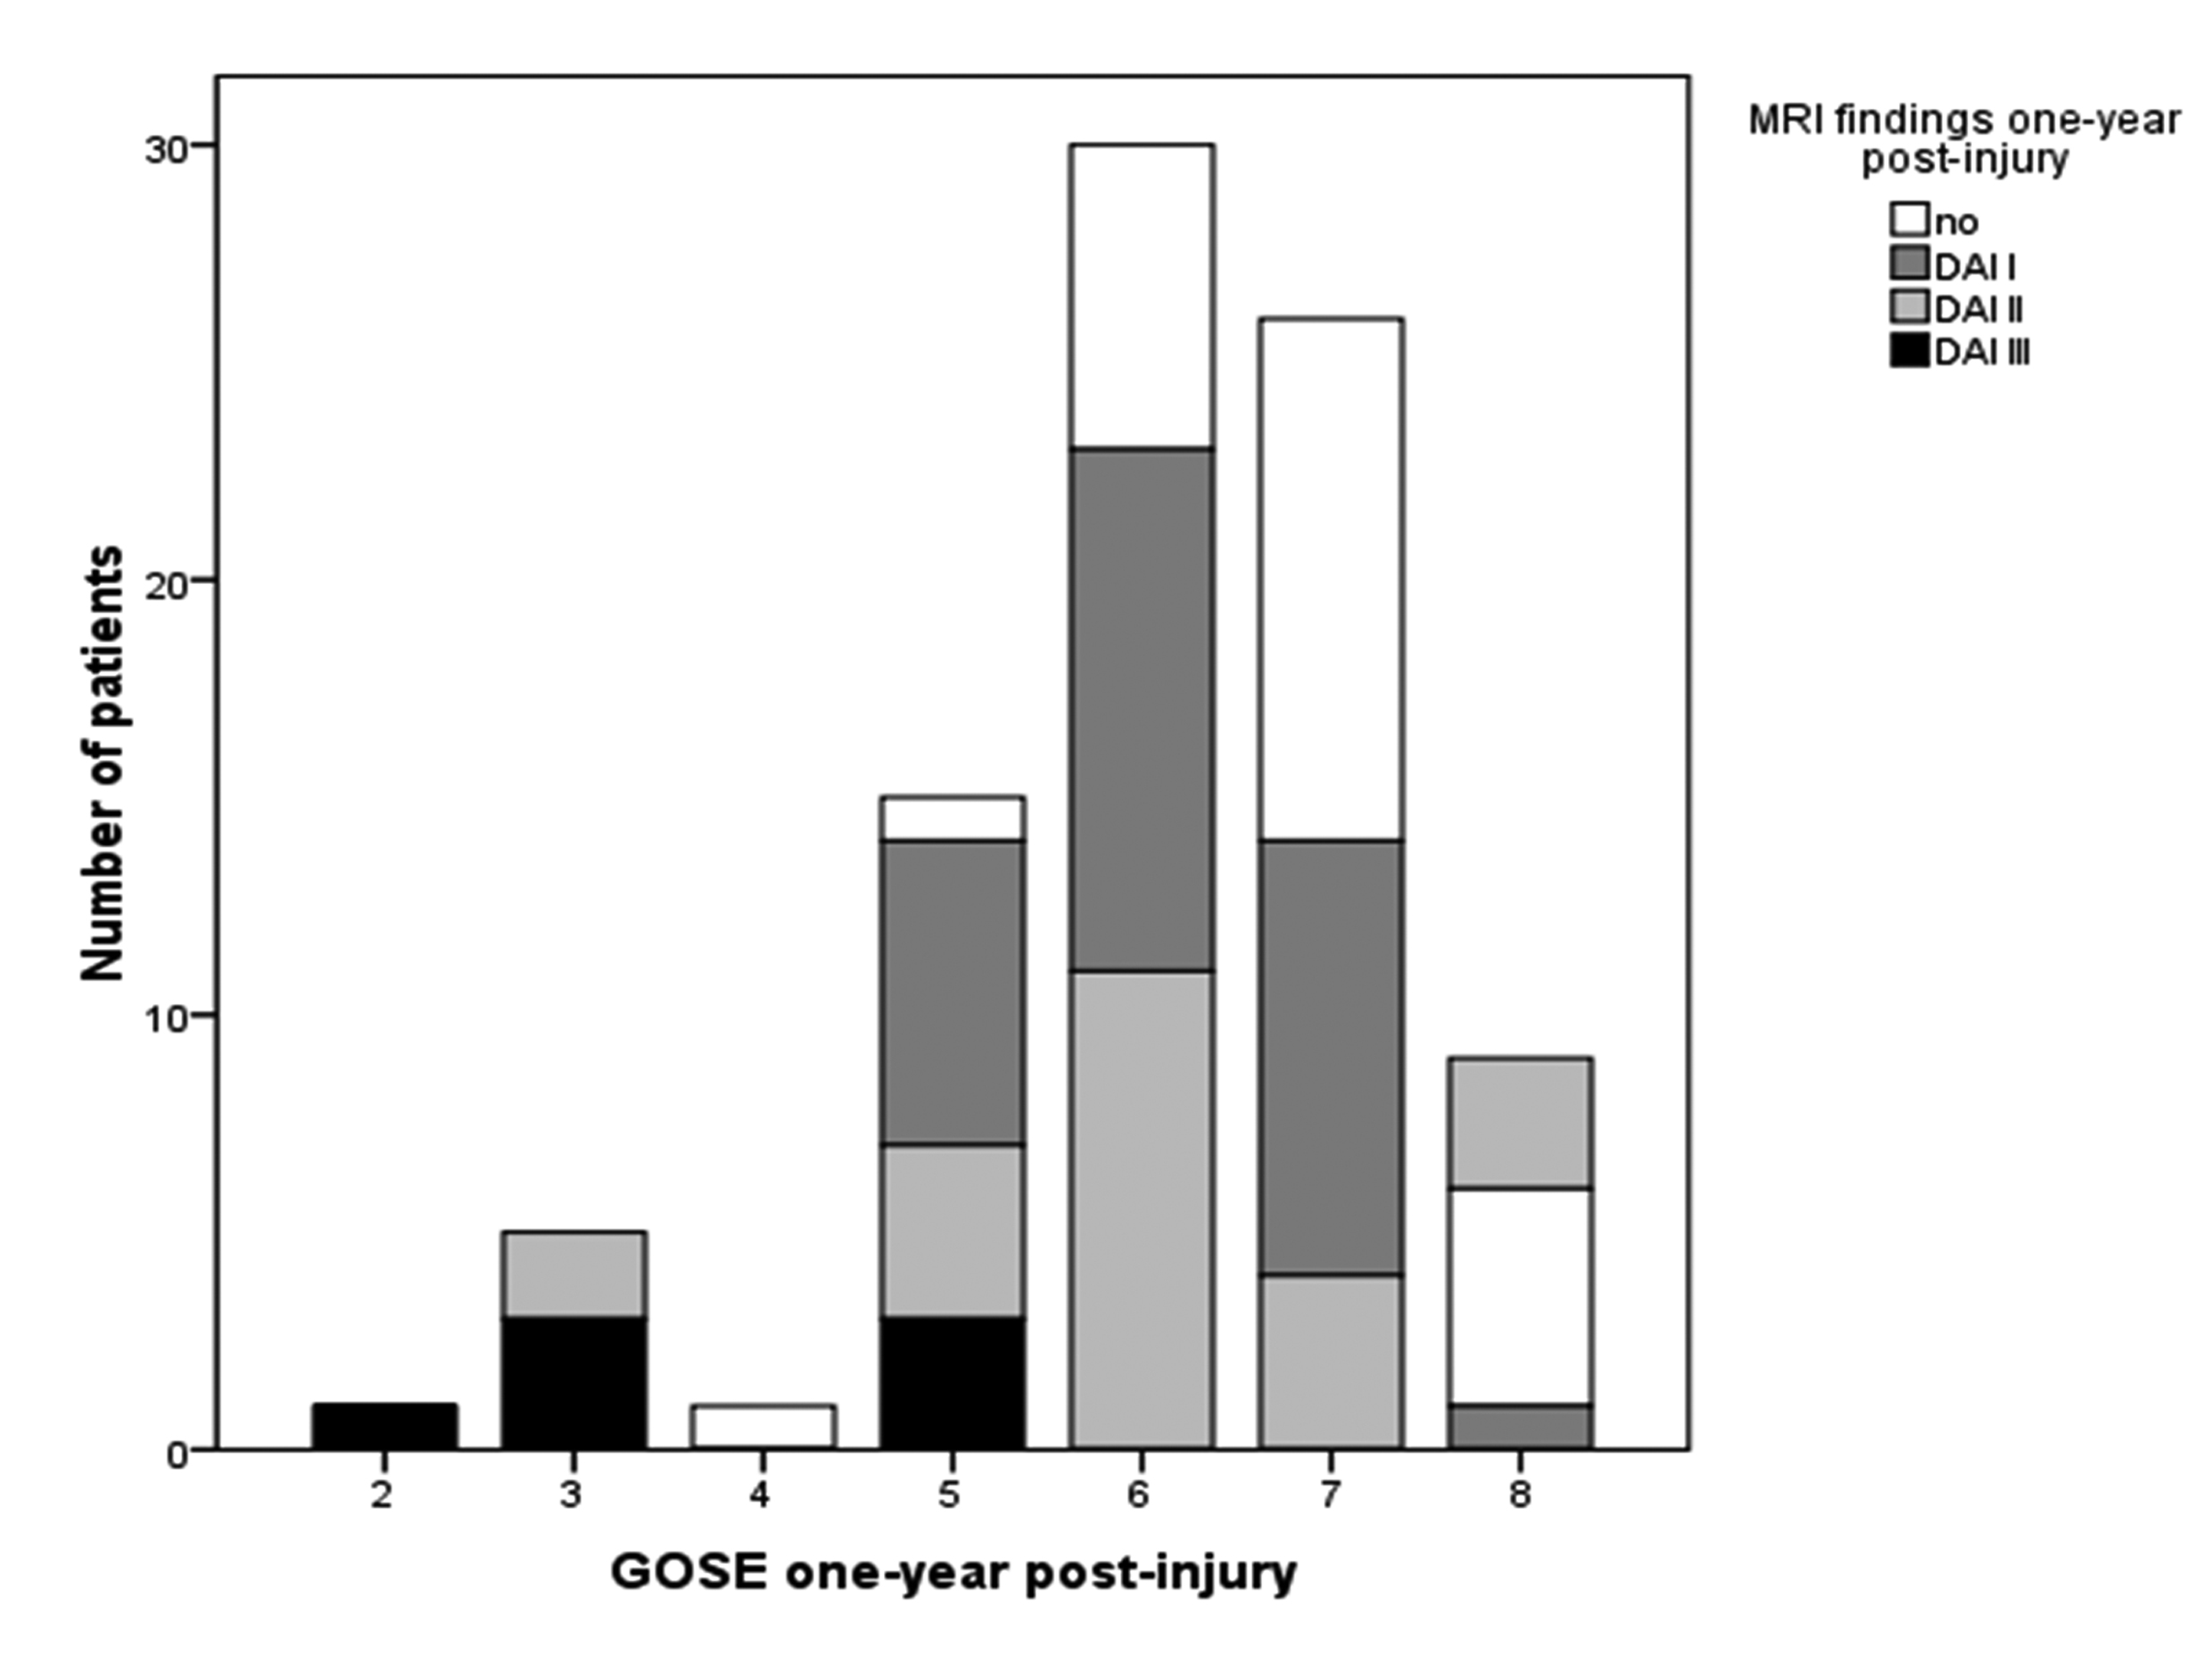
| MRI findings one year post-injury, DAI mean (range) | 1.2 (0 - 3) | < 0.001 | |
| Dilated perivascular space (no/yes) | 58 (67)/29 (33) | 6.1 (1.4)/6.0 (1.0) | 0.10 |
| Cortical contusions (no/yes) | 30 (35)/57 (65) | 6.2 (1.3)/6.0 (1.3) | 0.57 |
| Sub-cortical lesions (no/yes) | 68 (78)/19 (22) | 6.3 (1.0)/4.9 (1.6) | < 0.001 |
| Variables | B Coefficient ( 95% CI) | b | p-value |
|---|---|---|---|
| R2 for the model 0.46; Adjusted R2 0.45. | |||
| Constant | 8.71 | < 0.001* | |
| CT | -0.20 (-0.42 to 0.03) | -0.16 | 0.08 |
| MRI | -0.42 (-0.66 to -0.18) | -0.31 | 0.001* |
| Length of acute hospital stay | -1.26 (-1.80 to -0.72) | -0.42 | < 0.001* |
| Variables | MRI findings | GCS | ISS | Dilated pupils | Hypoxia | Hypotension | ICP monitoring | IVH | Subcortical lesions | Length of stay | GOSE |
|---|---|---|---|---|---|---|---|---|---|---|---|
| *p < 0.01; **p < 0.001. | |||||||||||
| CT findings | 0.36** | -0.38** | 0.21 | 0.26 | 0.24 | 0.07 | 0.42** | 0.24 | 0.29* | 0.36** | -0.42** |
| MRI findings | -0.49** | 0.39** | 0.25 | 0.29* | 0.19 | 0.45** | 0.31* | 0.58** | 0.34** | -0.50** | |
| GCS | -0.33* | -0.27 | -0.29* | -0.17 | -0.52** | -0.29* | -0.40** | -0.44** | 0.42** | ||
| ISS | 0.25 | 0.34** | 0.38** | 0.40** | 0.19 | 0.26* | 0.57** | 0.35** | |||
| Dilated pupils | 0.32* | 0.23 | 0.31* | 0.19 | 0.26* | 0.32* | -0.34** | ||||
| Hypoxia | 0.54** | 0.26 | 0.36** | 0.25* | 0.37** | -0.37** | |||||
| Hypotension | 0.13 | 0.14 | 0.22 | 0.24 | -0.26* | ||||||
| ICP monitoring | 0.20 | 0.36** | 0.52** | -0.39** | |||||||
| IVH | 0.26* | 0.38** | -0.43** | ||||||||
| Subcortical lesions | 0.28* | -0.44** | |||||||||
| Length of hospital stay | -0.57** | ||||||||||