Journal of Neurology Research, ISSN 1923-2845 print, 1923-2853 online, Open Access
Article copyright, the authors; Journal compilation copyright, J Neurol Res and Elmer Press Inc
Journal website http://www.neurores.org

Original Article

Volume 2, Number 4, August 2012, pages 145-151


Higher Serum Total Cholesterol Levels are Associated With Better Long-Term Balance Function After First-Time Ischemic Stroke

Figure

Figure 1.
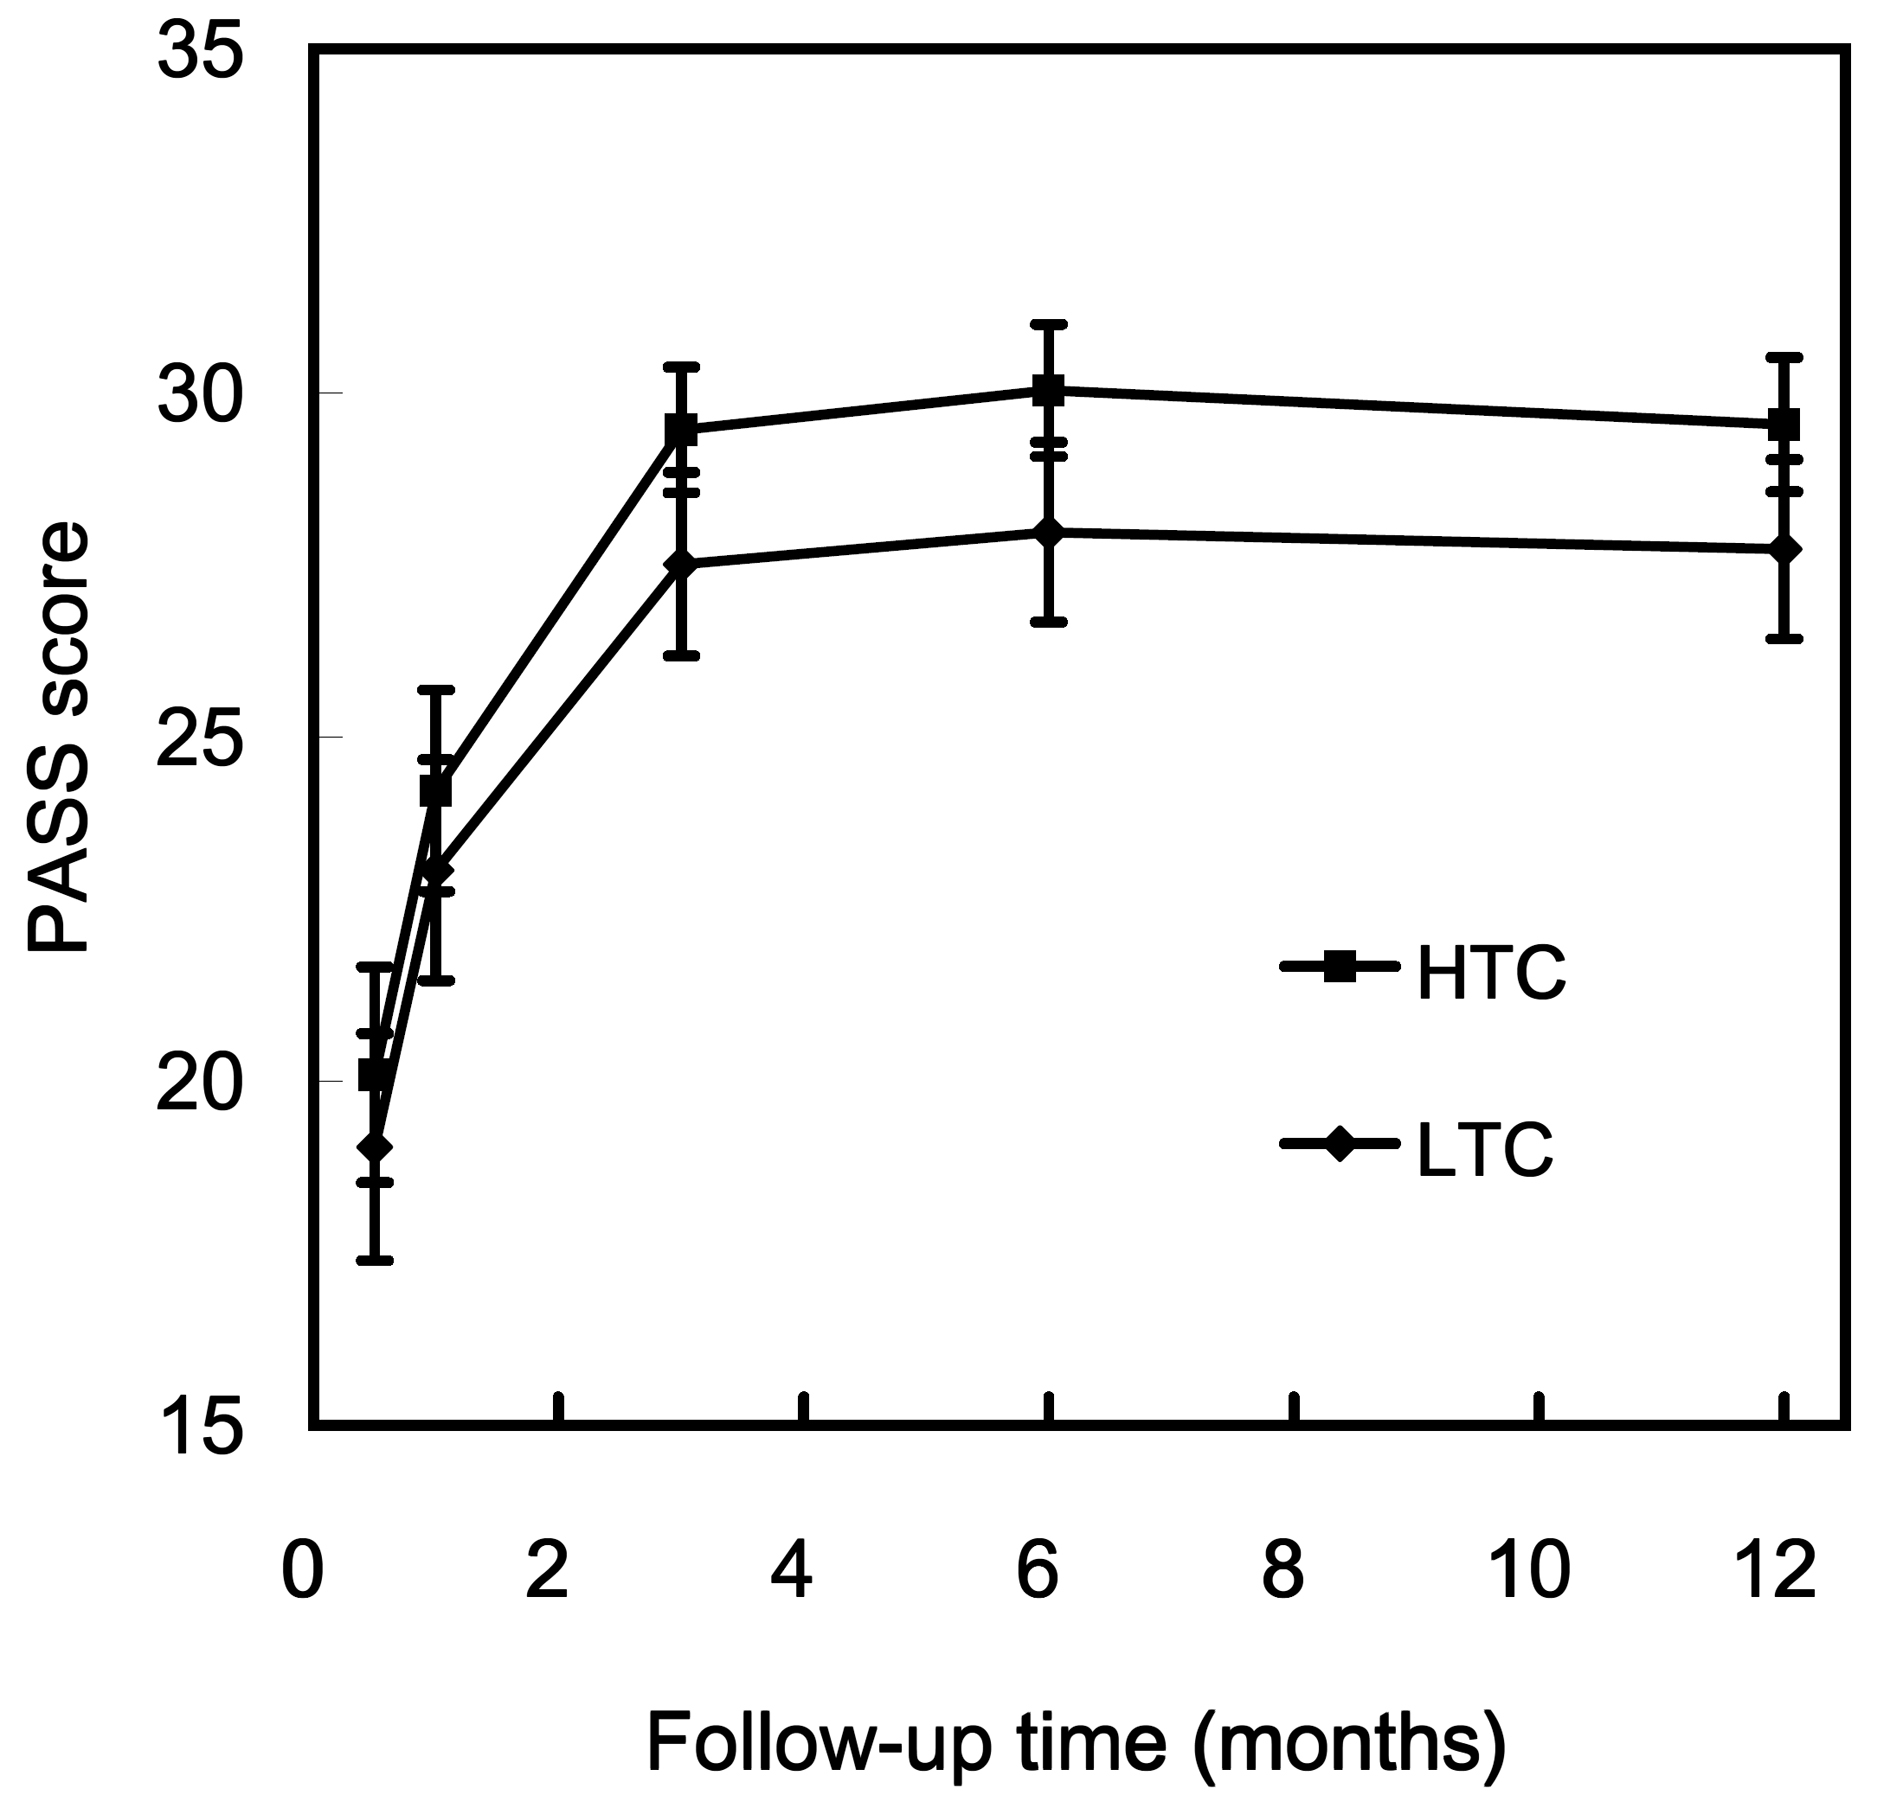
Figure 1. PASS scores during follow-up after stroke. The data are presented as the mean ± SEM. Abbreviations: HTC, high total cholesterol (≥ 5.17 mmol/L); LTC, low total cholesterol (< 5.17 mmol/L); PASS, Postural Assessment Scale for Stroke Patients.

Tables

Table 1. Demographic and Clinical Characteristics of the Participants Stratified by Total Cholesterol Level
 
VariablesHTC group (n = 54)LTC group (n = 45)P value
The values are expressed as the number (%) or the mean ± standard deviation. Abbreviations: PASS: Postural Assessment Scale for Stroke Patients;HTC, high total cholesterol (≥ 5.17 mmol/L); LTC, low total cholesterol (< 5.17 mmol/L).
Age, y68.3 ± 9.765.0 ± 11.80.130
Women23 (42)13 (29)0.158
Baseline PASS score20.1 ± 11.519.0 ± 11.00.788
Diabetes mellitus20 (37)13 (29)0.392
Coronary artery disease11 (20)6 (13.3)0.355
Left side lesion32 (59)27 (60)0.940
Basal ganglion lesion24 (44)15 (33)0.353
Large infarct43 (80)37 (82)0.297
Glucose, mmol/L7.69 ± 2.866.92 ± 3.170.260
Albumin, g/L37 ± 336 ± 50.516
Creatinine, µmol/L78.68 ± 21.2284.87 ± 26.520.234


Table 2. Analysis of Prognostic Factors Affecting Repeated Measurements of the PASS Score Using a Linear Mixed Regression Model
 
VariableRegression coefficients
Crude (95% CI)P valueMultiple regression (95% CI)P value
Only adjusted for follow-up time. The value or group on the right-hand side of each comparison is the reference group. Abbreviations: PASS, Postural Assessment Scale for Stroke Patients; HTC, high total cholesterol (≥ 5.17 mmol/L); LTC, low total cholesterol (< 5.17 mmol/l); ND, no data.
Follow-up time in log(days)2.94 (2.24, 3.65)< 0.00012.94 (2.53, 3.35)< 0.0001
Age (year)-0.15 (-0.23, -0.08)< 0.0001-0.12 (-0.16, -0.07)< 0.0001
Sex (female vs. male)-1.92 (-3.65, 0.18)0.031-2.63 (-3.70, -1.57)< 0.0001
Baseline PASS score0.66 (0.61, 0.70)< 0.00010.65 (0.61, 0.70)< 0.0001
Total cholesterol (HTC vs. LTC)2.01 (0.32, 3.69)0.0201.57 (0.58, 2.55)0.002
Lesion laterality (left vs. right)0.18 (-1.52, 1.88)0.831NDND
Basal ganglion lesion (yes vs. no)-1.40 (-3.14, 0.35)0.118NDND
Lesion size (≥ 1 cm vs. < 1 cm)-6.33 (-8.74, -3.92)< 0.0001NDND
Diabetes mellitus (yes vs. no)-0.88 (-2.63, 0.87)0.325NDND
Coronary artery disease (yes vs. no)-2.39 (-4.57, -0.21)0.032NDND
Albumin (< 35 vs. ≥ 35 g/L)-0.96 (-3.12, 1.20)0.386NDND
Glucose (≥ 11.1 vs. < 11.1 mmol/L)-2.76 (-5.48, -0.05)0.047NDND