Figures
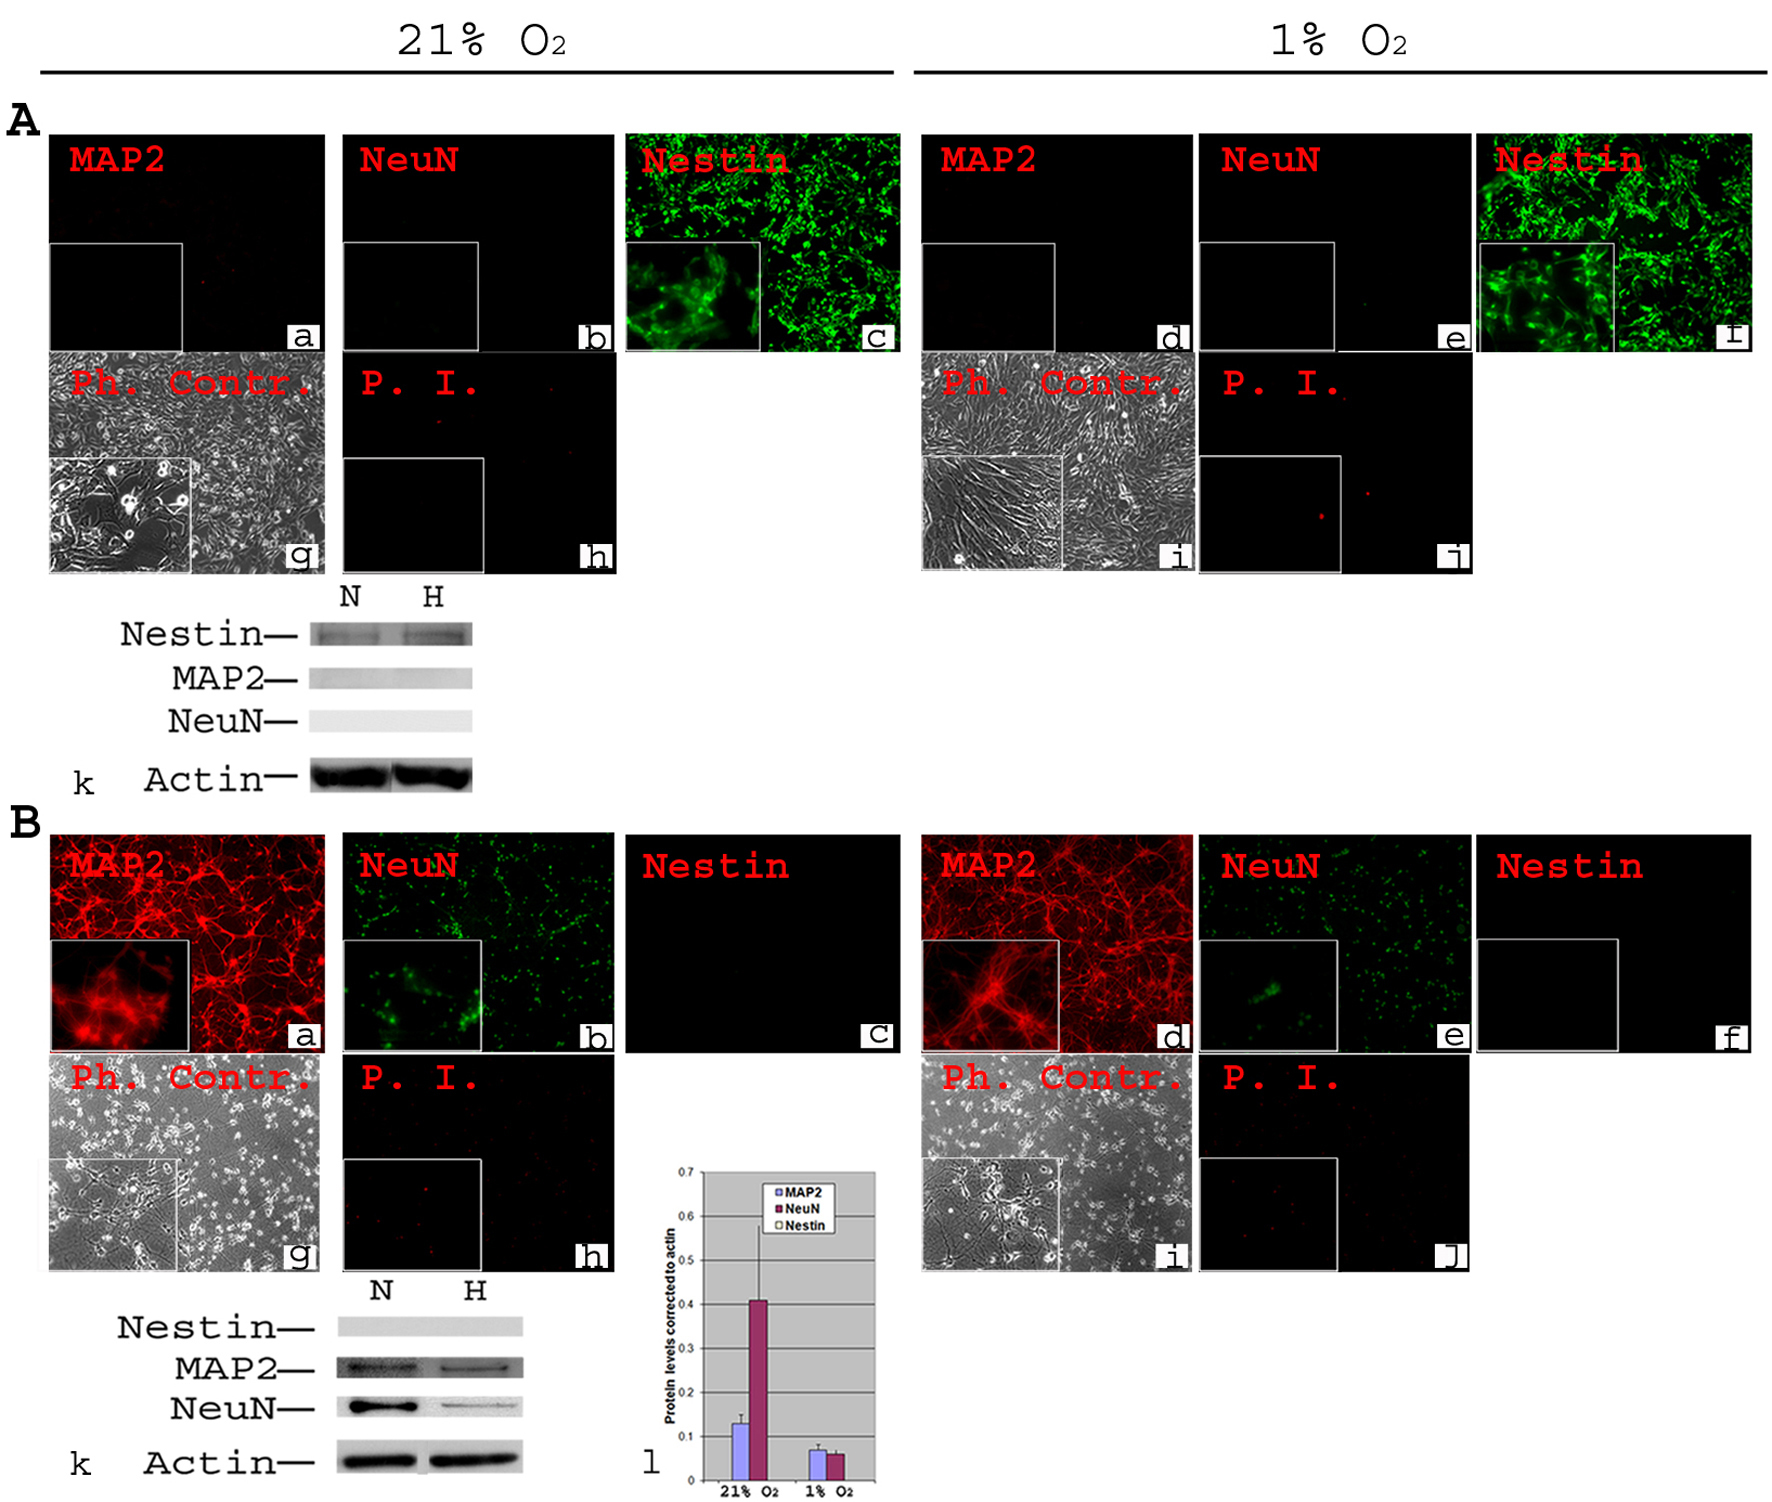
Figure 1. Phenotypic characterization of C17.2 NSCs and PN in 21% O2 and 1% O2. A-NSCs were cultured either in normoxia for 4 days (a, b, c, g, h) or in normoxia for 2 days then transferred to 1% O2 for 2 days (d, e, f, i, j). Cells were stained using antibodies directed against mouse stem cell marker Nestin and neuronal markers MAP2 and NeuN (a-f). Under both normoxia and hypoxia, all cells expressed nestin (c, f), but there was no detectable MAP2 or NeuN (a, b, d, e). Phase contrast (Ph. Contr.) microscopy shows the cells in normoxia (g) and 1% O2 (i). Propidium Iodide (P.I.) staining revealed a very low cell death similarly in normoxia (h) and 1% O2 (j). Magnification × 100; inset × 400. Western blot analysis confirmed the absence of MAP2 and NeuN from NSCs, and the presence of equivalent amounts of nestin in normoxia (N) and hypoxia (H, 1% O2) (k); B-Primary neurons were cultured form Embryonic (E) day 17 of mouse cortex in normoxia for 8 days (a, b, c, g, h) or in normoxia for 6 days then transferred to 1% O2 for 2 days (d, e, f, i, j). Immunocytochemistry was performed for Nestin, MAP2 and NeuN. There was a complete absence of Nestin both in normoxia (c) and 1% O2 (f). MAP2 and NeuN were detected in all cells both in normoxia (a, b) and 1% O2 (d, e). Phase contrast (Ph. Contr.) microscopy revealed typical neuronal shape with processes and synapses both in normoxia (g) and 1% O2 (i). PI staining showed a comparable cell death between normoxia (h) and 1% O2 (j). Magnification × 100; inset × 400. Western blot confirmed the absence of Nestin, and the presence of MAP2 and NeuN (k). Quantifications revealed ∼ two-fold decrease in the protein level of MAP2 and a significant (P ≤ 0.05) ∼ five-fold decrease in protein level of NeuN under hypoxia (l).
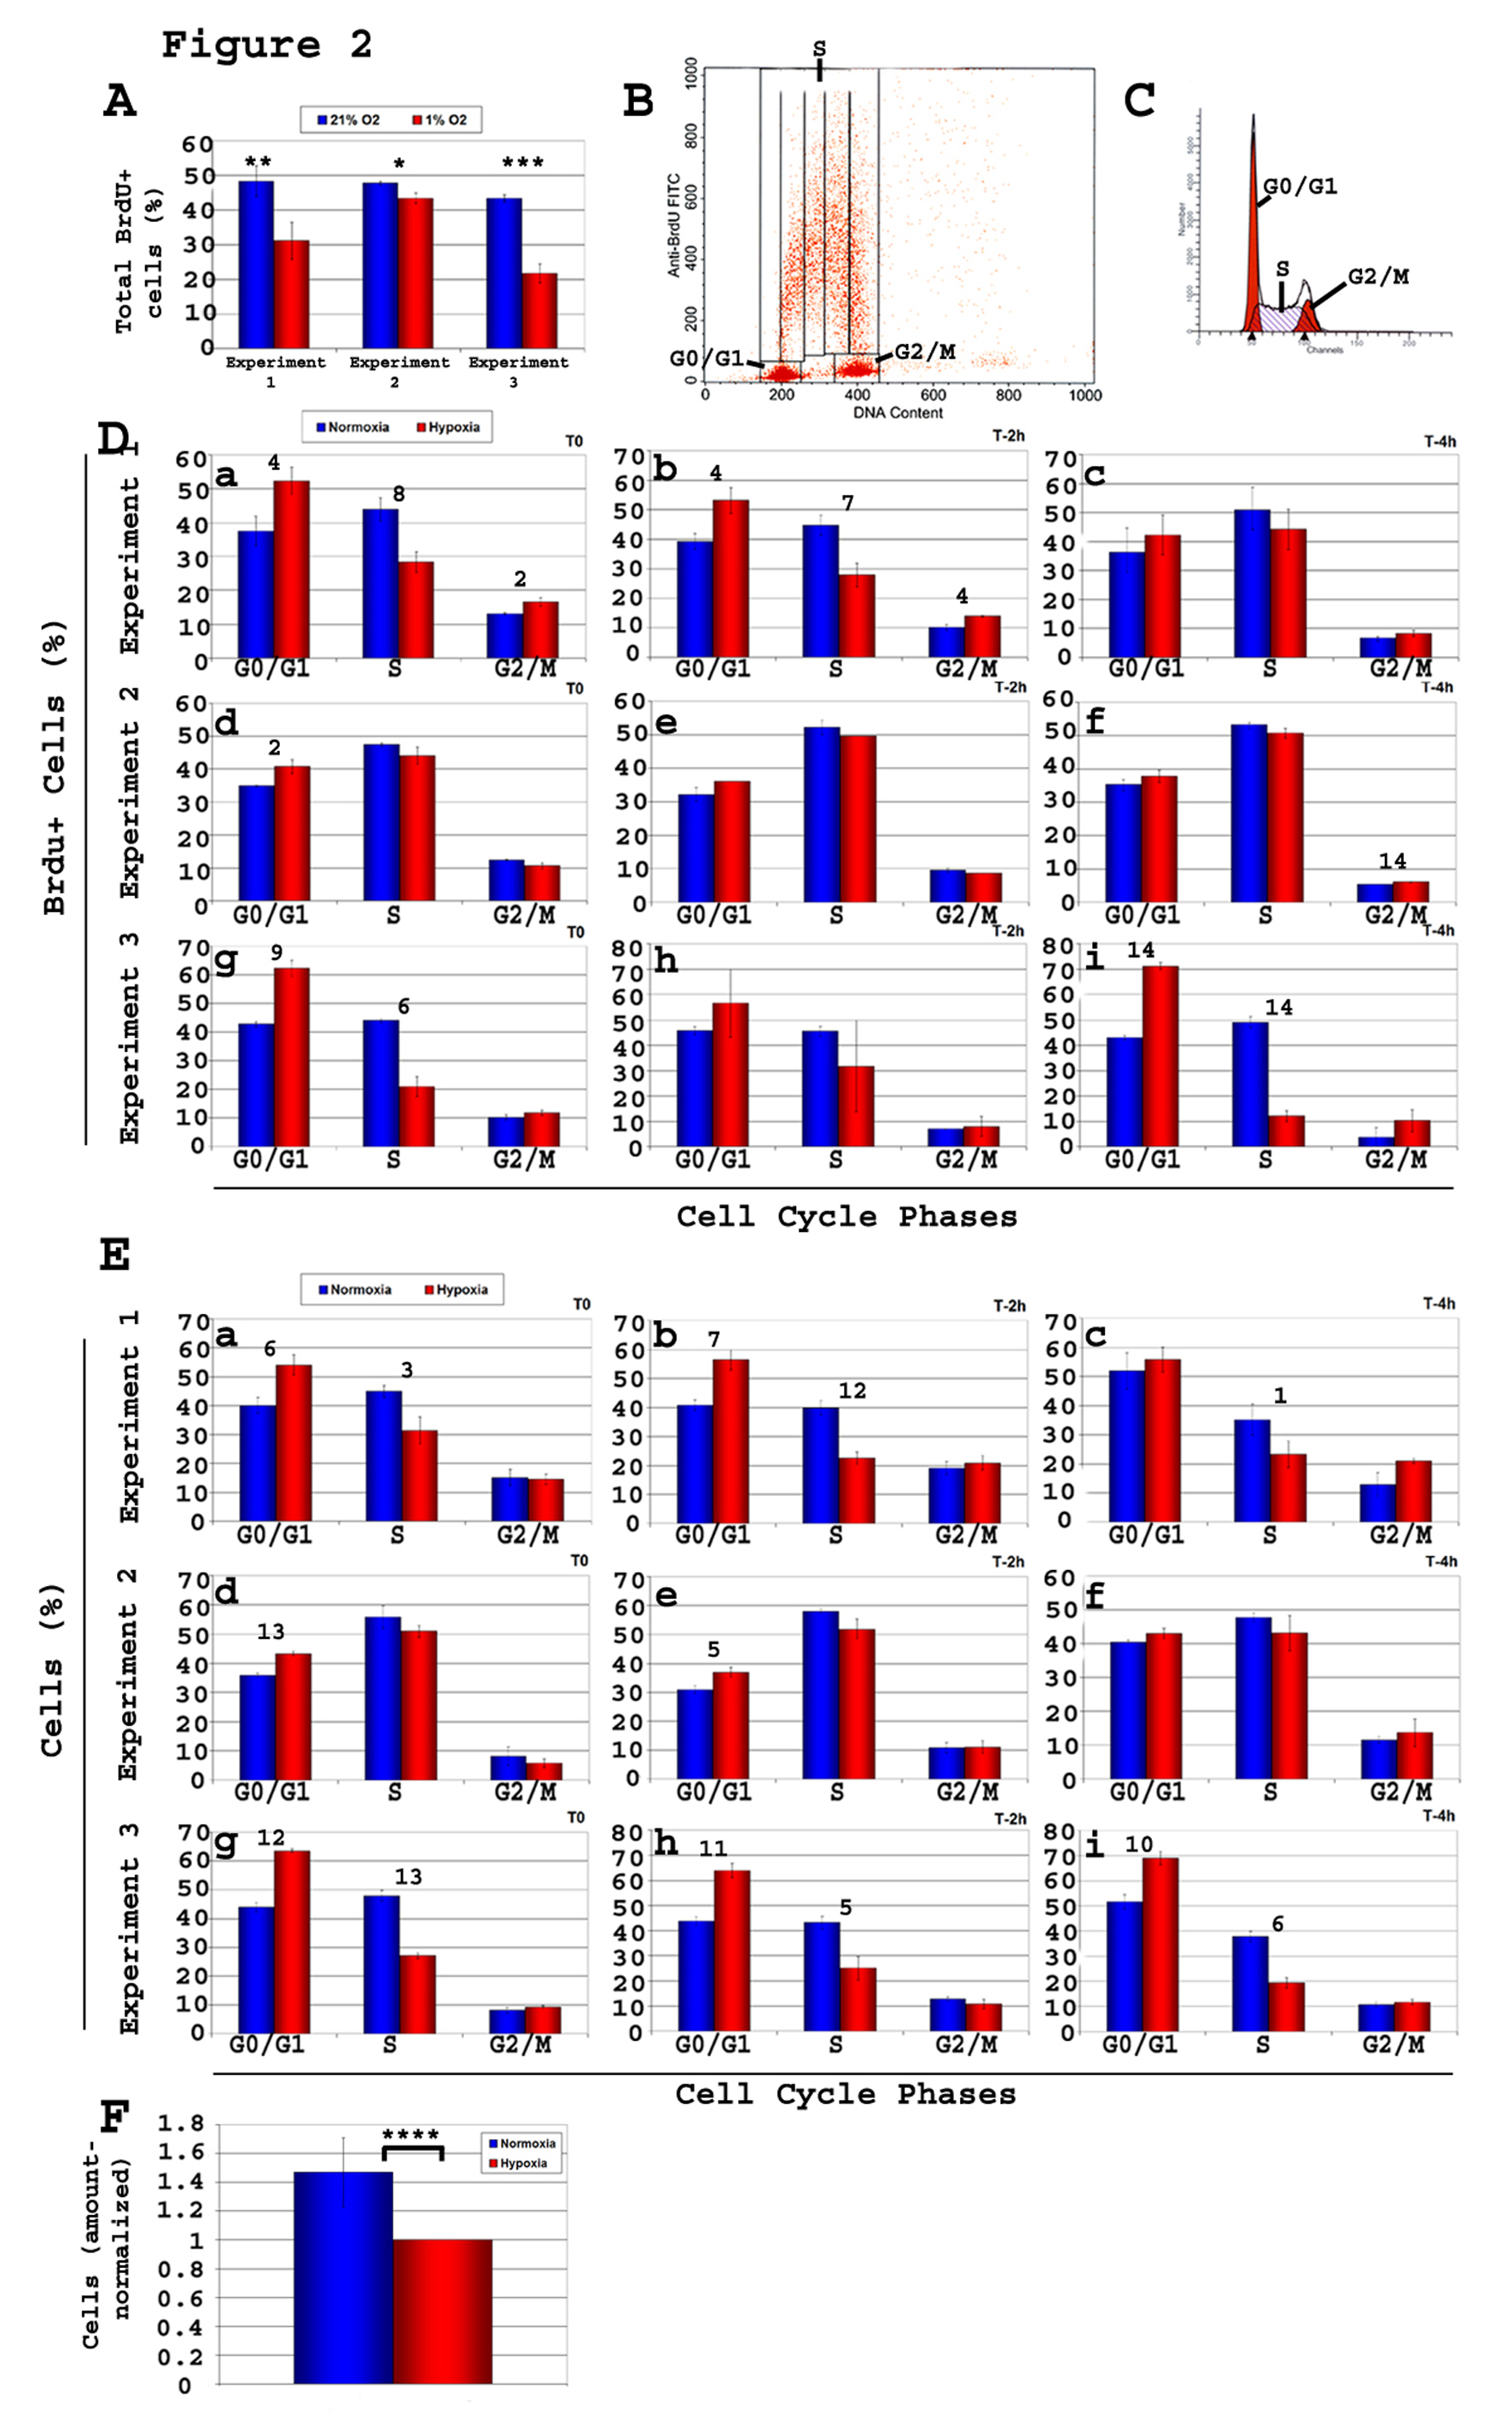
Figure 2. Kinetic analysis of cell cycle of C17.2 neural stem cells (NSCs) C17.2 cells were incubated in either 21% O2 or 1% O2. Brdu pulse of 20 minutes was followed by cell harvest either immediately (T0) or after a chase time of either 2 h or 4 h (T-2 h, T-4 h). Brdu staining and flow cytometry analysis was performed on all samples, and the percentage of Brdu+ cells relative to cell cycle was determined. Shown here are three experiments of n = 3 each (total n = 9). Two types of flow cytometry analyses were performed, one using total cells (Brdu+ and Brdu-), and one gated on the Brdu+ population. A-Total percentage of Brdu+ cells in each of the 3 experiments both in 1% O2 and 21% O2. T-test, normoxia vs. hypoxia: *, P< 0.03; **, P < 0.01; ***, P < 0.002; B-Gates used to calculate the percentage of Brdu+ cells in each of the phases G0/G1, S, and G2/M of the cell cycle; C-Graphics used to calculate the percentage of total cells in the various phases of the cycle (G0/G1, S, G2/M). Values obtained were used to draw the histograms in panel E; D-Brdu+ cells, and their progression in cell cycle phases. Under hypoxia, the percentage of Brdu+cells showed a consistent increase in G1 and a decrease S relative to normoxia showing a clear G1/S block; E-There is a consistent increase in the percentage of cells in G1 and a decrease in S phase, in hypoxia compared to normoxia, as analyzed based on their DNA content; F-Cell counts reflect fewer cells in hypoxia. T-test, value in normoxia vs. hypoxia of same cell cycle phase: Panel A: *, P < 0.03; **, P < 0.02; ***, P < 0.0002. Panels D and E: 1, P < 0.05; 2, P < 0.04; 3, P <0.03; 4, P < 0.02; 5, P < 0.009; 6, P < 0.007; 7, P < 0.006; 8, P < 0.005; 9, P < 0.004; 10, P < 0.003; 11, P < 0.002; 12, P <0.0008; 13, P < 0.0004; 14, P < 3 ×10⁻⁵. Panel F: ****, P <0.03.
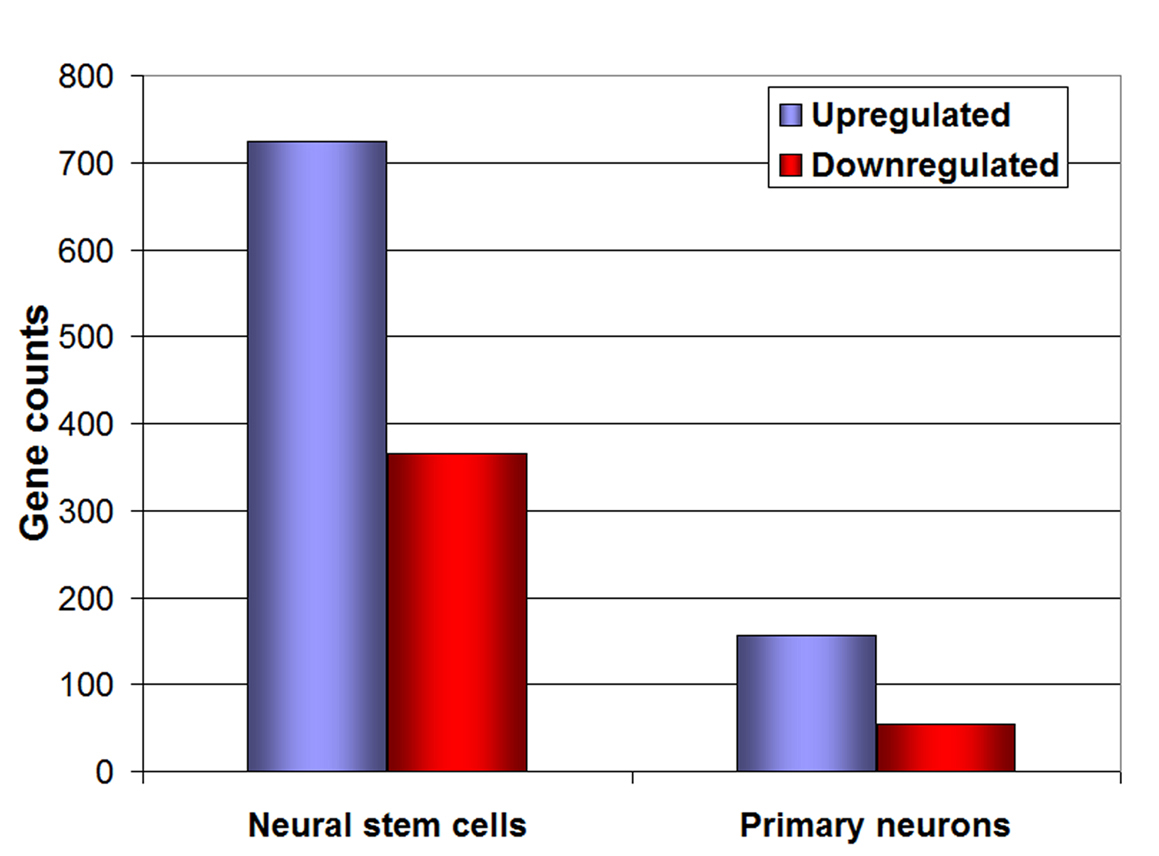
Figure 3. Microarray analysis of neural stem cells and neurons. Representation of the number of genes up-regulated (blue bars) and down-regulated (red bars) under 1% O2, both in neural stem cells and primary embryonic neurons.
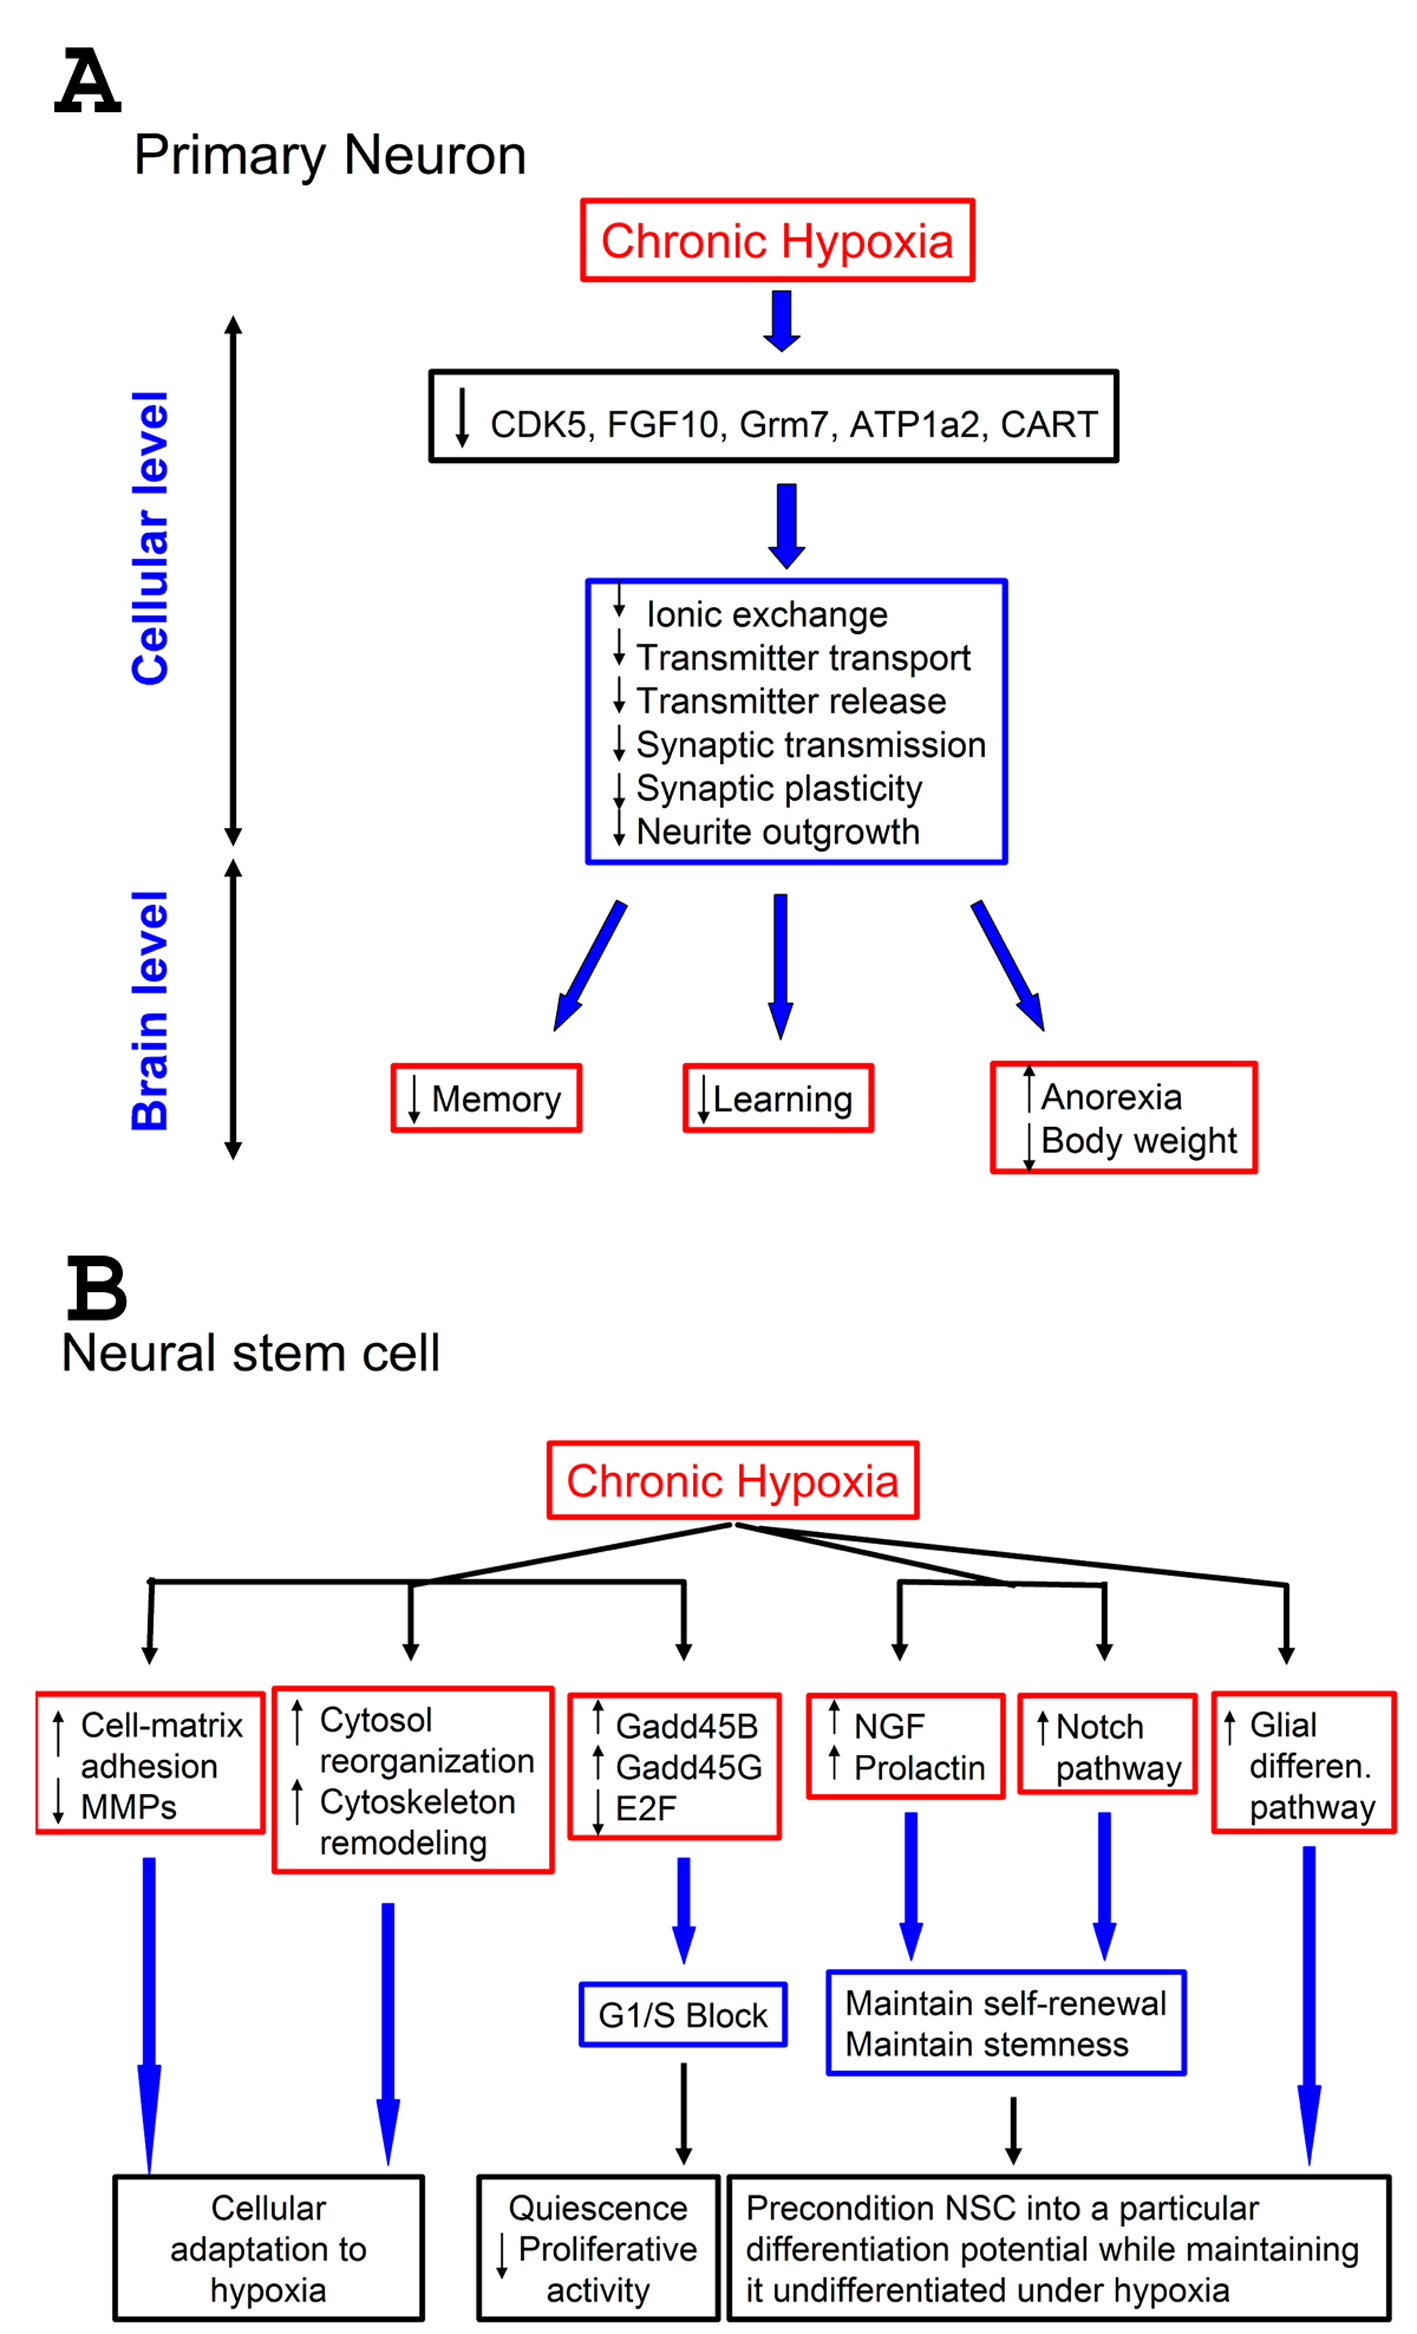
Figure 4. Effect of hypoxia on neurons and neural stem cells: a proposed model. A-Effect of hypoxia on neurons. A low (1%) level of oxygen for prolonged periods down-regulates certain genes that control pathways important for neuronal physiology. This results in suppression of neuronal functions at cellular level related to neurotransmitter processes, such as transmitter transport and release, and synaptic transmission. This suppression can negatively impact vital brain functions that depend on proper neurotransmission, such as memory and learning. Since some pathways (CART) are involved in controlling appetite, this suppression also results in anorexia, leading to weight loss; B-Effect of hypoxia on neural stem cells (NSCs). Prolonged exposure of NSCs to 1% O2 up-regulates cell-matrix adhesion molecules and down-regulates matrix metallo-proteases (MMPs). It also up-regulates genes involved in cytoskeleton remodeling, and causes changes in cell-cycle components resulting in G1/S block. Furthermore, hypoxia up-regulates some growth factors (NGF, neural growth factor, and prolactin), known to stimulate survival, and the Notch pathways as well. Also genes responsible for glial differentiation were up-regulated. Combined, these changes help maintaining the self-renewal of NSCs under hypoxia, keep them undifferentiated but pre-condition them into a particular differentiation potential.
Tables
Table 1. Major Cellular Functions With Genes Changed in Primary Neurons at 1% O2 Relative to 21% O2, Down-regulated
| GO Type | GO Name | No Changed | No Measured | No in GO | Adjusted P |
|---|
| Abbreviations: GO-gene ontology; P-biological process; C-cellular component; F-molecular function; No, number. |
| P | Feeding behavior | 3 | 41 | 43 | < 0.0001 |
| F | Glycosaminoglycan binding | 4 | 74 | 79 | < 0.0001 |
| P | Adult behavior | 4 | 78 | 88 | < 0.0001 |
| P | Learning | 3 | 46 | 52 | < 0.0001 |
| P | Polyol transport | 3 | 47 | 57 | < 0.0001 |
| P | Cellular chemical homeostasis | 6 | 186 | 207 | < 0.0001 |
| P | Reflex | 3 | 50 | 63 | < 0.0001 |
| P | Mechanoreceptor differentiation | 3 | 67 | 74 | < 0.0001 |
| P | Synaptic transmission | 5 | 188 | 205 | < 0.0001 |
| P | Epidermal cell differentiation | 3 | 93 | 101 | 0.001 |
| P | Neurotransmitter transport | 3 | 98 | 105 | 0.0005 |
| P | Cellular morphogenesis during differentiation | 4 | 198 | 217 | 0.001 |
| C | Extracellular region part | 7 | 553 | 612 | < 0.0001 |
| F | Transmembrane transporter activity | 8 | 710 | 777 | < 0.0001 |
| P | Neuron differentiation | 5 | 343 | 371 | < 0.0001 |
Table 2. Major Cellular Functions With Genes Changed in Primary Neurons at 1% O2 Relative to 21% O2, Up-regulated
| GO Type | GO Name | No Changed | No Measured | No in GO | Adjusted P |
|---|
| Abbreviations: GO-gene ontology; P-biological process; C-cellular component; F-molecular function; No, number. |
| P | Glycolysis | 12 | 39 | 45 | < 0.0001 |
| C | MHC protein complex | 6 | 24 | 29 | < 0.0001 |
| P | Antigen processing and presentation of peptide antigen | 6 | 32 | 36 | < 0.0001 |
| F | L-ascorbic acid binding | 4 | 17 | 19 | < 0.0001 |
| F | Dioxygenase activity | 6 | 60 | 62 | < 0.0001 |
| F | Oxidoreductase activity | 4 | 28 | 29 | < 0.0001 |
| P | Gluconeogenesis | 3 | 17 | 19 | < 0.0001 |
| F | Protein kinase inhibitor activity | 3 | 17 | 18 | < 0.0001 |
| F | Carbohydrate kinase activity | 3 | 18 | 20 | < 0.0001 |
| P | Cell cycle arrest | 4 | 43 | 46 | 0.0005 |
| P | Vascular endothelial growth factor receptor signaling | 4 | 61 | 67 | 0.0005 |
| P | Programmed cell death | 14 | 648 | 703 | < 0.0001 |
| P | Negative regulation of catalytic activity | 3 | 55 | 58 | 0.0045 |
| P | Hepatocyte metabolic process | 3 | 63 | 70 | 0.006 |
| F | Iron ion binding | 7 | 284 | 305 | 0.001 |
Table 3. Major Genes With Expression Level Changes Under Hypoxia. Major Neuronal-Specific Functions and the Genes Which are Down-Regulated, in Primary Embryonic Neurons
| Function | Genes down-regulated |
|---|
| Adult behavior | Atp1a2, Cartpt, Cdk5, Grm7 |
| Learning | Atp1a2, Cdk5, Grm7 |
| Reflex | Cartpt, Fgf10, Satb1 |
| Mechanoreceptor differentiation | Fgf10, Hes5, Ntrk2 |
| Synaptic transmission | Atp1a2, Cartpt, Cdk5, Grm7, Ntrk2 |
| Neurotransmitter transport | Atp1a2, Ntrk2, Slc6a11 |
| Cellular morphogenesis during differentiation | Apoe, Cdk5, Ntrk2, Rtn4rl1 |
| Transmembrane transporter activity | Aqp4, Atp1a2, Grm7, Kcnd2, Slc25a10, Slc25a18, Slc6a11, Tfrc |
| Neuron Differentiation | Apoe, Cdk5, Fgf10, Hes5, Rtn4rl1 |
Table 4. Major Cellular Functions With Genes Changed in Neural Stem Cells at 1% O2 Relative to 21% O2, Down-Regulated
| GO Type | GO Name | No Changed | No Measured | No in GO | Adjusted P |
|---|
| Abbreviations: GO-gene ontology; P-biological process; C- cellular component; F-molecular function; No, number. |
| P | Actin filament bundle formation | 3 | 14 | 15 | 0.001 |
| P | Interferon-gamma biosynthetic process | 3 | 16 | 16 | 0.0015 |
| C | Mitochondrial part | 15 | 298 | 331 | < 0.0001 |
| P | Interleukin-2 biosynthetic process | 3 | 19 | 20 | 0.002 |
| F | Hydrolase activity, acting on carbon-nitrogen (but not peptide) bonds, in cyclic amidines | 3 | 22 | 25 | 0.002 |
| P | Nucleoside phosphate metabolic process | 9 | 154 | 169 | < 0.0001 |
| P | Synaptic vesicle transport | 3 | 23 | 24 | 0.0035 |
| F | Oxidoreductase activity, acting on the CH-CH group of donors | 4 | 41 | 47 | 0.001 |
| P | Myelination | 3 | 27 | 32 | 0.0035 |
| P | Carboxylic acid metabolic process | 15 | 392 | 421 | < 0.0001 |
| P | tRNA metabolic process | 6 | 94 | 97 | 0.0005 |
| P | Amino acid derivative metabolic process | 5 | 82 | 92 | 0.003 |
| P | Exocytosis | 5 | 90 | 97 | 0.0025 |
| C | Anchored to membrane | 6 | 121 | 129 | 0.002 |
Table 5. Major Cellular Functions With Genes Changed in Neural Stem Cells at 1% O2 Relative to 21% O2, Up-Regulated
| GO Type | GO Name | No Changed | No Measured | No in GO | Adjusted P |
|---|
| Abbreviations: GO-gene ontology; P-biological process; C- cellular component; F-molecular function; No, number. |
| F | Protein binding | 203 | 4602 | 5018 | < 0.0001 |
| F | L-ascorbic acid binding | 6 | 17 | 19 | < 0.0001 |
| P | Blood vessel morphogenesis | 21 | 165 | 182 | < 0.0001 |
| F | Transcription regulator activity | 62 | 944 | 1013 | < 0.0001 |
| P | ER overload response | 3 | 6 | 7 | < 0.0001 |
| P | Positive regulation of cell motility | 6 | 22 | 25 | < 0.0001 |
| C | Nucleus | 153 | 3642 | 3941 | < 0.0001 |
| F | Oxidoreductase activity, acting on paired donors, with incorporation or reduction of molecular oxygen, 2-oxoglutarate as one donor, and incorporation of one atom each of oxygen into both donors | 6 | 28 | 29 | < 0.0001 |
| F | MAP kinase phosphatase activity | 3 | 8 | 9 | 0.0005 |
| P | Cytoplasm organization and biogenesis | 3 | 8 | 9 | < 0.0001 |
| P | Death | 43 | 681 | 740 | < 0.0001 |
| P | Glial cell differentiation | 10 | 72 | 79 | < 0.0001 |
| P | Cellular component assembly | 15 | 145 | 159 | < 0.0001 |
| P | Regulation of cell-matrix adhesion | 3 | 9 | 11 | 0.001 |
| P | Purine salvage | 82 | 1717 | 1843 | < 0.0001 |
Table 6. Major Genes With Expression Level Changes Under Hypoxia. Changes in Expression Level of Genes Involved in Cell Cycle Block in NSCs
| Function | Gene change |
|---|
| Arrest in G1/decrease cell cycle progression | ↑AKAP12, ↑BHLHE40, ↓CAMKK2, ↓CCND2, ↑CSF1, ↑CYR61, ↓DDIT3, ↑DGKZ, ↑DUSP1, ↑E2F2, ↑FN1, ↑GHR, ↑KLF4, ↑NGF, ↑PTPN22, ↑RASSF1, ↑SIRT1, ↑SKP2, ↓TYMS, ↑ARID3A, ↓CHN2, ↓E2F2, ↑GADD45B, ↑GADD45G, ↑HMOX1, ↑ID1, ↑ID2, ↓IGFBP5,↑SNAI1, ↑THBS1, ↑VEGFA |
Table 7. Major Genes With Expression Level Changes Under Hypoxia. Changes in Expression Levels of Genes Involved in Cytoskeleton Rearrangements in NSCs
| Effect | Genes |
|---|
| Increase formation of actin stress fibers | ↓ARKGEF3, ↑CTGF,↑EDN1, ↑FN1, ↓GNG7, ↓LPAR4, ↓S1PR2, ↑VEGFA |
| Decrease formation of actin stress fibers | ↑RND3, ↓S1PR2, ↓STARD13, ↑TNC |
Increase rearrangement of actin
cytoskeleton | ↑EDN1, ↑PALLD, ↑PDGF1 |
| Increase rearrangement of cytoskeleton | ↑CTGF, ↑EDN1, ↑ELMO1, ↑PALLD, ↑PDGFB, ↓SPP1, ↑VEGFA |
| Increases reorganization of actin | ↓ARFIP2, ↑FN1, ↑PAUR, ↑VEGFA |
| Increase reorganization of cytoskeleton | ↑CSF1, ↑EDN1, ↑FN1, ↓GAS1, ↑GDNF, ↑VEGFA |