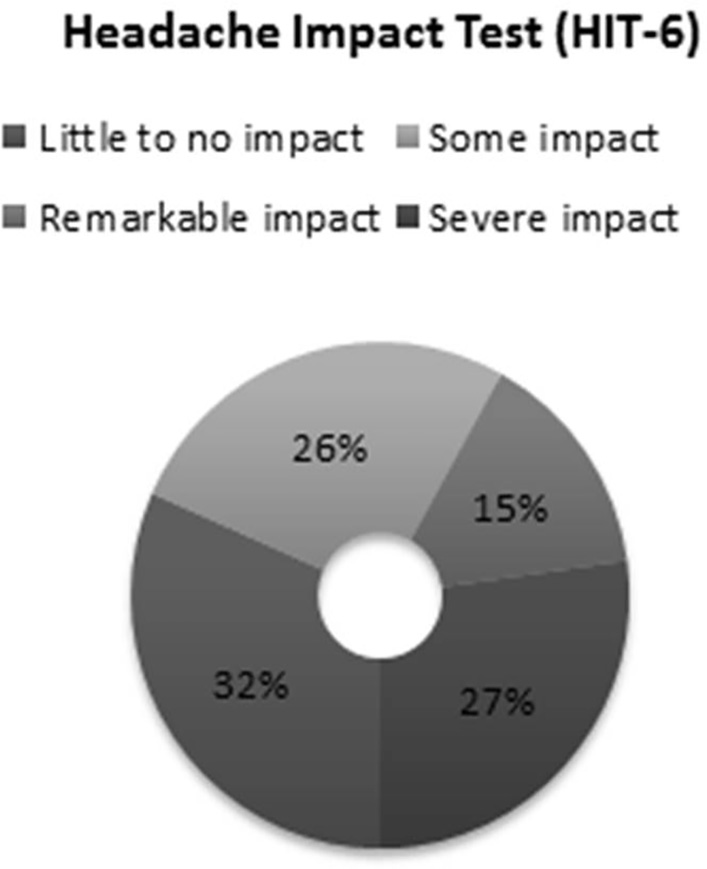
Figure 1. Headache Impact Test (HIT-6).
| Journal of Neurology Research, ISSN 1923-2845 print, 1923-2853 online, Open Access |
| Article copyright, the authors; Journal compilation copyright, J Neurol Res and Elmer Press Inc |
| Journal website http://www.neurores.org |
Original Article
Volume 7, Number 1-2, April 2017, pages 5-12
Prevalence and Impact on Job Performance of Primary Headache Among Medical and Paramedical Staff in the Emergency Department
Figure
Tables
| N | % | |
|---|---|---|
| Age | ||
| 18 - 24 | 80 | 26% |
| 25 - 39 | 176 | 57.1% |
| 40 - 59 | 52 | 16.9% |
| Total | 308 | 100% |
| Gender | ||
| Male | 158 | 51.3% |
| Female | 150 | 48.7% |
| Total | 308 | 100% |
| Marital status | ||
| Single | 160 | 51.9% |
| Married | 144 | 46.8% |
| Divorced/widow | 4 | 1.3% |
| Total | 308 | 100% |
| Specialty | ||
| Medical | 132 | 42.9% |
| Paramedical | 176 | 57.1% |
| Total | 308 | 100% |
| Body mass index (BMI) | ||
| Underweight | 36 | 11.7% |
| Normal | 148 | 48.1% |
| Overweight | 80 | 26.0% |
| Obese | 44 | 14.3% |
| Total | 308 | 100.0% |
| BMI, mean ± SD | 24 ± 5 | |
| Physical activities ≥ 30 min/week | ||
| Never | 148 | 48.1% |
| 1 | 56 | 17.5% |
| 1 - 3 | 70 | 22.7% |
| +3 | 36 | 11.7% |
| Total | 308 | 100.0% |
| Smoking | ||
| Yes | 62 | 20.1% |
| No | 246 | 79.9% |
| Total | 308 | 100.0% |
| Income | ||
| 5,000 - 10,000 SR | 172 | 55.8% |
| 10,000 - 15,000 SR | 88 | 28.6% |
| + 15,000 SR | 48 | 15.6% |
| Total | 308 | 100.0% |
| Family history | ||
| Yes | 122 | 39.6% |
| No | 186 | 60.4% |
| Total | 308 | 100.0% |
| Headache last 3 months | ||
| Yes | 272 | 88.3% |
| No | 36 | 11.7% |
| Total | 308 | 100.0% |
| Headache occurrence in the last 3 months | X2 | P value | |||||
|---|---|---|---|---|---|---|---|
| Yes | No | ||||||
| No. | % | No. | % | ||||
| ††Statistically significant difference. (n, %) Column percent (of all samples). | |||||||
| Age | 18 - 24 | 72 | (23.4%) 90% | 8 | (76.6%) 10% | 4.94 | 0.09 |
| 25 - 39 | 150 | (48.7%) 85.2% | 26 | (51.3%) 14.8% | |||
| 40 - 59 | 50 | (16.2%) 96.2% | 2 | (83.8%) 3.8% | |||
| Gender | Male | 142 | 89.9% | 16 | 10.1% | 0.77 | 0.38 |
| Female | 130 | 86.7% | 20 | 13.3% | |||
| Marital status | Single | 136 | 85% | 24 | 15% | 3.8 | 0.15 |
| Married | 132 | 91.7% | 12 | 8.3% | |||
| Divorced/widow | 4 | 100% | 0 | 0% | |||
| Specialty | Medical | 116 | 87.9% | 16 | 12.1% | 0.04 | 0.84 |
| Paramedical | 156 | 88.6% | 20 | 11.4% | |||
| Body mass index (BMI) | Underweight | 30 | 83.3% | 6 | 16.7% | 3.74 | 0.29 |
| Normal | 128 | 86.5% | 20 | 13.5% | |||
| Overweight | 72 | 90% | 8 | 10% | |||
| Obese | 42 | 95.5% | 2 | 4.5% | |||
| Physical activities ≥ 30 min/week | Never | 138 | 93.2% | 10 | 6.8% | 11.92 | 0.008†† |
| 1 | 44 | 81.5% | 10 | 18.5% | |||
| 1 - 3 | 56 | 80% | 14 | 20% | |||
| +3 | 34 | 94.4% | 2 | 5.6% | |||
| Smoking | Yes | 60 | 96.8% | 2 | 3.2% | 5.39 | 0.020†† |
| No | 212 | 86.2% | 34 | 13.8% | |||
| Income | 5,000 - 10,000 SR | 156 | 90.7% | 16 | 9.3% | 2.43 | 0.30 |
| 10,000 - 15,000 SR | 76 | 86.4% | 12 | 13.6% | |||
| + 15,000 SR | 40 | 83.3% | 8 | 16.7% | |||
| Family history | Yes | 110 | 90.2% | 12 | 9.8% | 0.67 | 0.41 |
| No | 162 | 87.1% | 24 | 12.9% | |||
| N | % | |
|---|---|---|
| Headache duration (years) | ||
| 1 - 3 years | 160 | 58.8% |
| 3 - 5 years | 44 | 16.2% |
| + 5 years | 68 | 25% |
| Headache frequency | ||
| Daily | 34 | 12.5% |
| Weekly | 140 | 51.5% |
| Monthly | 98 | 36% |
| Headache site | ||
| Bilateral | 154 | 56.6% |
| One-sided | 118 | 43.4% |
| Headache character | ||
| Pulsating/throbbing | 128 | 47.1% |
| Dull/pressing | 144 | 52.9% |
| Headache onset | ||
| Gradually | 116 | 42.6% |
| Suddenly | 78 | 28.7% |
| Varies | 78 | 28.7% |
| Headache intensity | ||
| Mild | 74 | 27.2% |
| Moderate | 158 | 58.1% |
| Severe | 40 | 14.7% |
| Headaches increasing in frequency | ||
| Yes | 112 | 41.2% |
| No | 160 | 58.8% |
| Headache time | ||
| Morning | 68 | 25% |
| Evening | 146 | 53.7% |
| Night | 58 | 21.3% |
| Headache relieving (with medications) | ||
| Minutes | 44 | 16.2% |
| Hours | 136 | 50% |
| Days | 18 | 6.6% |
| No medication use | 74 | 27.2% |
| Headache relieving (without medications) | ||
| Minutes | 46 | 16.9% |
| Hours | 174 | 64% |
| Days | 52 | 19.1% |
| Headache worsened by physical activities | ||
| Yes | 156 | 57.4% |
| No | 116 | 42.6% |
| Headaches associated with nausea | ||
| Yes | 90 | 33.1% |
| No | 182 | 66.9% |
| Headaches associated with vomiting | ||
| Yes | 40 | 14.7% |
| No | 232 | 85.3% |
| Sensitivity to light | ||
| Yes | 128 | 47.1% |
| No | 144 | 52.9% |
| Sensitivity to noise | ||
| Yes | 146 | 53.7% |
| No | 126 | 46.3% |
| Neurological deficiencies | ||
| Yes | 44 | 16.2% |
| No | 228 | 83.8% |
| Specialist consultation | ||
| General practitioner | 24 | 8.8% |
| Family Physician | 18 | 6.6% |
| Neurologist | 30 | 11% |
| None | 200 | 73.5% |
| Medication use | ||
| No medication | 134 | 49.3% |
| Prescription | 46 | 16.9% |
| Over the counter | 92 | 33.8% |
| Frequency of absenteeism | ||
| 1 - 5 days | 46 | 16.9% |
| 5 - 10 days | 20 | 7.4% |
| + 10 days | 6 | 2.2% |
| None | 200 | 73.5% |
| Headache impact test (HIT-6) | X2 | P value | ||||||||
|---|---|---|---|---|---|---|---|---|---|---|
| Severe impact | Remarkable impact | Some impact | Little to no impact | |||||||
| N | % | N | % | N | % | N | % | |||
| ††Statistically significant difference. | ||||||||||
| Age | ||||||||||
| 18 - 24 | 18 | 25% | 10 | 13.9% | 20 | 27.8% | 24 | 33.3% | 15.87 | 0.014†† |
| 25 - 39 | 32 | 21.3% | 22 | 14.7% | 42 | 28% | 54 | 36% | ||
| 40 - 59 | 24 | 48% | 8 | 16% | 10 | 20% | 8 | 16% | ||
| Marital status | ||||||||||
| Single | 30 | 22.1% | 10 | 7.4% | 44 | 32.4% | 52 | 38.2% | 25.22 | 0.000†† |
| Married | 44 | 33.3% | 28 | 21.2% | 28 | 21.2% | 32 | 24.2% | ||
| Divorced/widow | 0 | 0% | 2 | 50% | 0 | 0% | 2 | 50% | ||
| Specialty | ||||||||||
| Medical | 46 | 39.7% | 16 | 13.8% | 30 | 25.9% | 24 | 20.7% | 19.30 | 0.000†† |
| Paramedical | 28 | 17.9% | 24 | 15.4% | 42 | 26.9% | 62 | 39.7% | ||
| Body mass index (BMI) | ||||||||||
| Underweight | 0 | 0% | 0 | 0% | 0 | 0% | 30 | 100% | 411.14 | 0.000†† |
| Normal | 0 | 0% | 0 | 0% | 72 | 56.3% | 56 | 43.8% | ||
| Overweight | 32 | 44.4% | 40 | 55.6% | 0 | 0% | 0 | 0% | ||
| Obese | 42 | 100% | 0 | 0% | 0 | 0% | 0 | 0% | ||
| Physical activities ≥ 30 min/week | ||||||||||
| Never | 34 | 24.6% | 20 | 14.5% | 42 | 30.4% | 42 | 30.4% | 17.95 | 0.036†† |
| 1 | 16 | 36.4% | 4 | 9.1% | 6 | 13.6% | 18 | 40.9% | ||
| 1 - 3 | 10 | 17.9% | 14 | 25% | 16 | 28.6% | 16 | 28.6% | ||
| + 3 | 14 | 41.2% | 2 | 5.9% | 8 | 23.5% | 10 | 29.4% | ||
| Smoking | ||||||||||
| Yes | 12 | 20% | 24 | 40% | 8 | 13.3% | 16 | 26.7% | 40.58 | 0.000†† |
| No | 62 | 29.2% | 16 | 7.5% | 64 | 30.2% | 70 | 33% | ||
| Headache duration (years) | ||||||||||
| 1 - 3 years | 36 | 22.5% | 18 | 11.3% | 48 | 30% | 58 | 36.3% | 29.34 | 0.000†† |
| 3 - 5 years | 16 | 36.4% | 16 | 36.4% | 6 | 13.6% | 6 | 13.6% | ||
| + 5 years | 22 | 32.4% | 6 | 8.8% | 18 | 26.5% | 22 | 32.4% | ||
| Specialist consultation | ||||||||||
| General practitioner | 2 | 8.3% | 2 | 8.3% | 16 | 66.7% | 4 | 16.7% | 50.84 | 0.000†† |
| Family physician | 6 | 33.3% | 4 | 22.2% | 2 | 11.1% | 6 | 33.3% | ||
| Neurologist | 18 | 60% | 8 | 26.7% | 2 | 6.7% | 2 | 6.7% | ||
| None | 48 | 24% | 26 | 13% | 52 | 26% | 74 | 37% | ||
| Medication use | ||||||||||
| No medication | 26 | 19.4% | 16 | 11.9% | 32 | 23.9% | 60 | 44.8% | 34.17 | 0.000†† |
| Prescription | 18 | 39.1% | 4 | 8.7% | 20 | 43.5% | 4 | 8.7% | ||
| Over the counter | 30 | 32.6% | 20 | 21.7% | 20 | 21.7% | 22 | 23.9% | ||
| Frequency of absenteeism | ||||||||||
| 1 - 5 days | 26 | 56.5% | 2 | 4.3% | 10 | 21.7% | 8 | 17.4% | 46.28 | 0.000†† |
| 5 - 10 days | 12 | 60% | 4 | 20% | 2 | 10% | 2 | 10% | ||
| + 10 days | 2 | 33.3% | 0 | 0% | 2 | 33.3% | 2 | 33.3% | ||
| None | 34 | 17% | 34 | 17% | 58 | 29% | 74 | 37% | ||