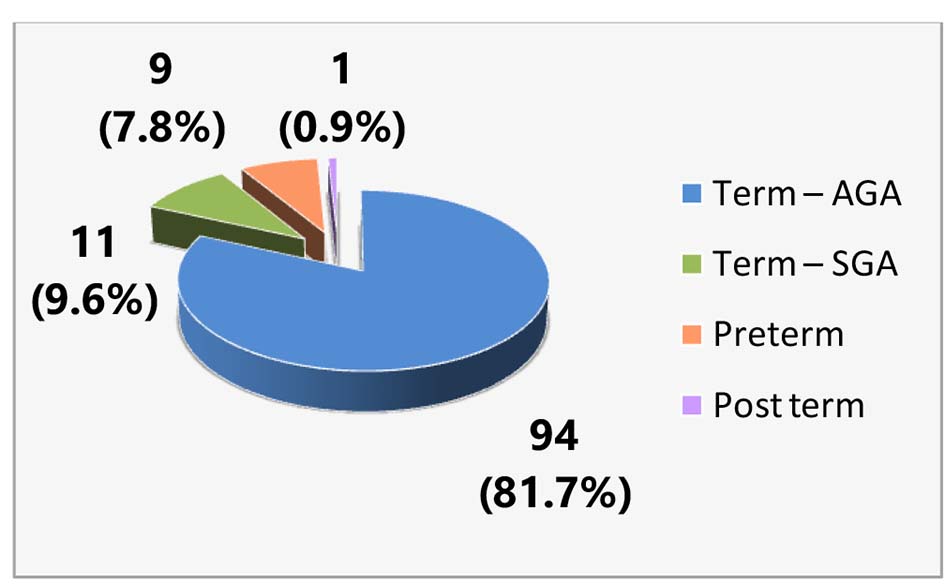
Figure 1. Distribution of neonatal seizures according to gestational age.
| Journal of Neurology Research, ISSN 1923-2845 print, 1923-2853 online, Open Access |
| Article copyright, the authors; Journal compilation copyright, J Neurol Res and Elmer Press Inc |
| Journal website http://www.neurores.org |
Original Article
Volume 6, Number 5-6, December 2016, pages 95-101
A Study on Clinico-Biochemical Profile of Neonatal Seizure
Figures
Tables
| Sex-wise distribution of neonatal seizures | n = 115 (100%) |
| Male, n (%) | 72 (62.6 %) |
| Female, n (%) | 43 (37.4%) |
| Place of delivery of babies with neonatal seizures | n = 115 (100%) |
| Home delivery, n (%) | 2 (1.7%) |
| Hospital delivery, n (%) | 113 (98.3%) |
| Birth weight (kg) | No. (%) |
|---|---|
| > 2.5 | 75 (65.2%) |
| 2 - 2.5 | 29 (25.2%) |
| 1 - 2 | 11 (9.6%) |
| < 1 | - |
| Total | 115 (100%) |
| Type of seizures | No. (%) |
|---|---|
| Subtle | 49 (42.6%) |
| Generalized tonic | 39 (33.9%) |
| Multifocal clonic | 10 (8.7%) |
| Focal clonic | 8 (7%) |
| Subtle with GTS | 6 (5.2%) |
| Subtle with clonic | 3 (2.6%) |
| Total | 115 (100%) |
| Seizures | Biochemical abnormalities | Total | ||||||
|---|---|---|---|---|---|---|---|---|
| Hypocalcemia | Hypomagnesemia | Hypermagnesemia | Hypocalcemia + hypomagnesemia | Hypocalcemia | Hypercalcemia | Hypoglycemia | ||
| Non-metabolic seizures | - | 4 (10%) | 6 (15%) | 1 (2.5%) | 26 (65%) | 1 (2.5%) | 2 (5%) | 40 (100%) |
| Metabolic seizures | - | 2 (15.4%) | 1 (7.6%) | 1 (7.6%) | - | - | 9 (69.2%) | 13 (100%) |
| Total | - | 6 (11.32%) | 7 (13.2%) | 2 (3.77%) | 26 (49%) | 1 (1.8%) | 11 (20.75%) | 53 (100%) |
| Gestational age | Biochemical abnormalities | Total | ||||
|---|---|---|---|---|---|---|
| Hypocalcemia | Hypermagnesemia | Hypomagnesemia | Hypocalcemia + hypomagnesemia | Hypoglycemia | ||
| Pre-term | - | 0 | 1 (20%) | - | 4 (80%) | 5 (100%) |
| Term AGA | - | 1 (33.3%) | - | 1 (33.3%) | 1 (33.3%) | 3 (100%) |
| Term SGA | - | - | 1 (20%) | - | 4 (80%) | 5 (100%) |
| Total | - | 1 (7.7%) | 2 (15.45%) | 1 (7.7%) | 9 (69.2%) | 13 (100%) |
| Biochemical profile | Total | |||
|---|---|---|---|---|
| Hypomagnesemia | Hypermagnesemia | Hypocalcemia + hypomagnesemia | ||
| Non-metabolic | 4 (40%) | 5 (50%) | 1 (10%) | 10 (100%) |
| Metabolic | 2 (50%) | 1 (25%) | 1 (25%) | 4 (100%) |
| Total | 6 (42.9%) | 6 (42.9%) | 2 (14.3%) | 14 (100%) |