Journal of Neurology Research, ISSN 1923-2845 print, 1923-2853 online, Open Access
Article copyright, the authors; Journal compilation copyright, J Neurol Res and Elmer Press Inc
Journal website http://www.neurores.org

Original Article

Volume 6, Number 1, February 2016, pages 12-17


Mitochondrial Respiratory Chain Enzymatic Activities on Skin Fibroblasts in Patients With Mutant Glucocerebrosidase and PARK2 Genes

Figure

Figure 1.
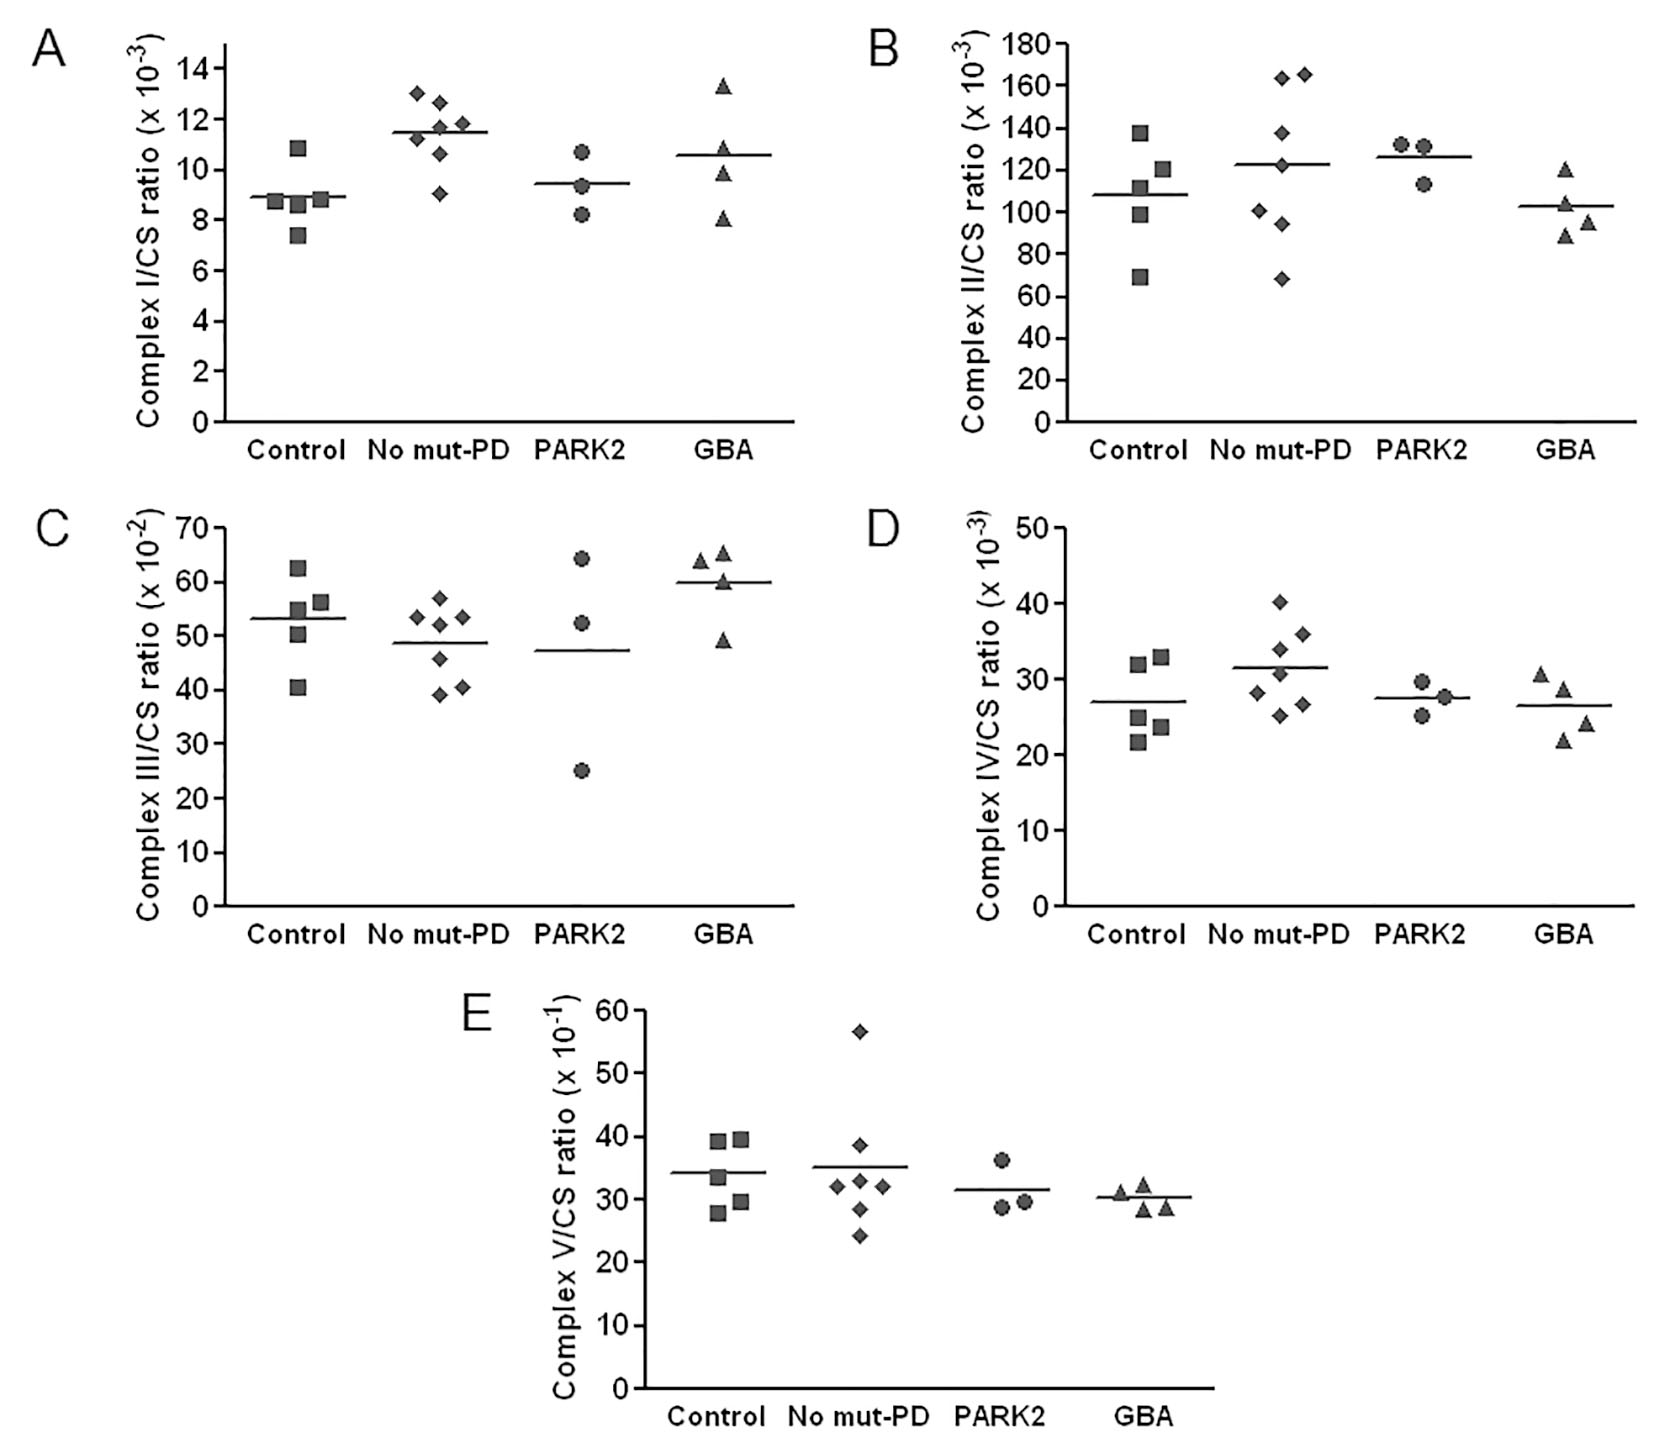
Figure 1. Scatter plots of values of enzymatic activities of complexes I - V in Parkinson’s disease (PD) patients and in controls. All respiratory chain enzyme activities are normalized to the activity of citrate synthase (CS). Horizontal bars represent the mean values.

Tables

Table 1. Details of PCR, Mismatched PCR and Restriction Fragment Length Polymorphisms
 
MutationPrimer sequencePCR product size (bp)Restriction enzymeRestriction positionRestriction product size (bp)
bp: base pairs; WT: wide-type; MT: mutant-type.
C1309delGGBA-F9-11:
AAC CAT GAT TCC CTA TCT TC
GBA-R9-11:
ACC ACC TAG AGG GGA AAG TG
1,290SalIWT 358
MT none
WT 358, 932
MT 1,290
WT/MT 358, 932, 1,290
IVS10-9_10 GT>AGHpy188IIIWT 817, 889
MT 817, 889, 1005
WT 72, 401, 473
MT 72, 116, 285, 473
WT/MT 72, 116, 285, 401, 473
IVS2+1G>AGBA-F2:
CTT CTC TTC ATC TAA TGA CCC TGA
GBA-R2:
CCA CCG AGC TGT AGC C
1,065HphIWT 524, 665, 848, 880, 908, 977
MT 665, 848, 880, 908, 977
WT 28, 32, 69, 88, 141, 183, 524
MT 28, 32, 69, 88, 183, 665
WT/MT 28, 32, 69, 88, 141, 183, 524, 665
N386KGBA-N386K-F:
CTG GAC CGA CTG GAA CCT TGC CCT GTA (T is a mismatch nucleotide)
GBA-N386K-R:
5’-GTG CCC GCC CTC CAC TCA CCT
160RsaIWT 116
MT none
WT 44, 116
MT 160
WT/MT 44, 116, 160
M1TParkin_1_E1_F:
ACG TAA GAT TGC TGG GCC TGA AG
Parkin_1_E1_R:
GGC ACT TTG GCC CCG TCA TTG AC
392NlaIIIWT 224, 267
MT 224
WT 43, 126, 223
MT 169, 223
WT/MT 43, 126, 169, 223


Table 2. Phenotypic and Genotypic Data of Parkinson’s Disease Patients and Controls
 
CodeGenderAge (years)Causative geneMutation
SD: standard deviation.
Patients1Male51None-
2Male57None-
3Male47None-
4Male37None-
5Male45None-
6Male46None-
7Female53None-
8Male56PARK2exon 8 deletion
9Female43PARK2p.Met1Thr
10Female41PARK2Exon 8 deletion
11Male56GBAIVS11-9,10 gt>ag
12Female57GBAc.1309delG
13Female41GBAp.Asp386Lys
14Female49GBAIVS2+1g>A
Mean ± SD48.5 ± 6.7
Controls1Male53None-
2Female45None-
3Female59None-
4Female46None-
5Female45None-
Mean ± SD49.6 ± 6.2


Table 3. Enzymatic Activities (Mean ± SEM) of Complexes I - V Corrected by Citrate Synthase Activity
 
Control (N = 5)Patients
All patients (N = 14)No mutation (N = 7)All mutations (N = 7)PARK2 (N = 3)GBA (N = 4)
SEM: standard error of measurement.
Complex I (/× 103)8.92 ± 0.5510.78 ± 0.4511.48 ± 0.5010.09 ± 0.689.44 ± 0.7110.57 ± 1.10
Complex II (/× 103)107.9 ± 11.57117.4 ± 7.45122.1 ± 13.77112.6 ± 6.40125.70 ± 6.25102.70 ± 6.90
Complex III (/× 102)53.11 ± 3.6951.69 ± 3.0048.88 ± 2.6054.50 ± 5.4347.42 ± 11.6659.81 ± 3.64
Complex IV (/× 103)27.15 ± 2.2829.30 ± 1.3131.61 ± 2.0426.99 ± 1.2127.61 ± 1.3526.52 ± 2.01
Complex V (/× 10)34.13 ± 2.3932.95 ± 2.0635.08 ± 3.9630.83 ± 1.0831.63 ± 2.4130.23 ± 0.94
Citrate synthase (mOD/min)13.32 ± 0.1912.66 ± 0.1312.46 ± 0.1412.87 ± 0.2112.97 ± 0.3012.79 ± 0.31