Journal of Neurology Research, ISSN 1923-2845 print, 1923-2853 online, Open Access
Article copyright, the authors; Journal compilation copyright, J Neurol Res and Elmer Press Inc
Journal website http://www.neurores.org

Original Article

Volume 6, Number 1, February 2016, pages 8-11


Pupillary Response to Auditory Stimuli in Depressive State

Figures

Figure 1.
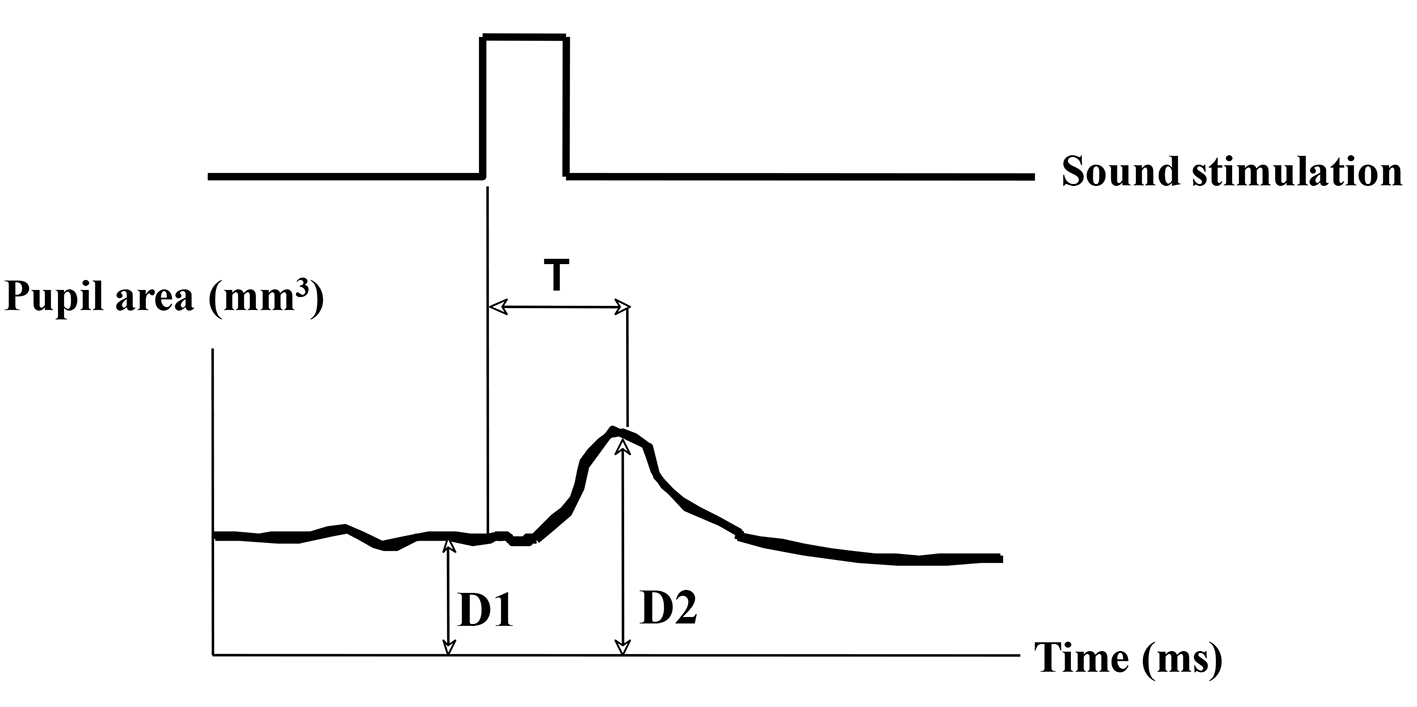
Figure 1. Measurement of pupil responsive area after sound stimulation. D1 (mm2): pupil area of pre-stimulant with mean value for 1 s. D2 (mm2): pupil area of post-auditory stimulant with maximum value. Dilated ratio (DR) is (D2 - D1)/D1. T is a latency time between sound stimulation and post-auditory response with maximum (ms).
Figure 2.
Figure 2. Measurement of pupil responsive area after light stimulation. D1 (mm2): pupil area of pre-stimulant with mean value for 1 s. D3 (mm2): pupil minimum area of post-light stimulation. Contractive ratio (CR) is (D1 - D3)/D1.
Figure 3.
Figure 3. (A) Correlation between DR and SDS. DR: dilated ratio; SDS: Zung’s self-depression scale. (B) Correlation between CR and SDS. CR: contractive ratio.