Journal of Neurology Research, ISSN 1923-2845 print, 1923-2853 online, Open Access
Article copyright, the authors; Journal compilation copyright, J Neurol Res and Elmer Press Inc
Journal website http://www.neurores.org

Original Article

Volume 5, Number 3, June 2015, pages 199-206


Glioblastoma Multiforme and Angiogenesis: A Clinicopathological and Immunohistochemistry Approach

Figures

Figure 1.
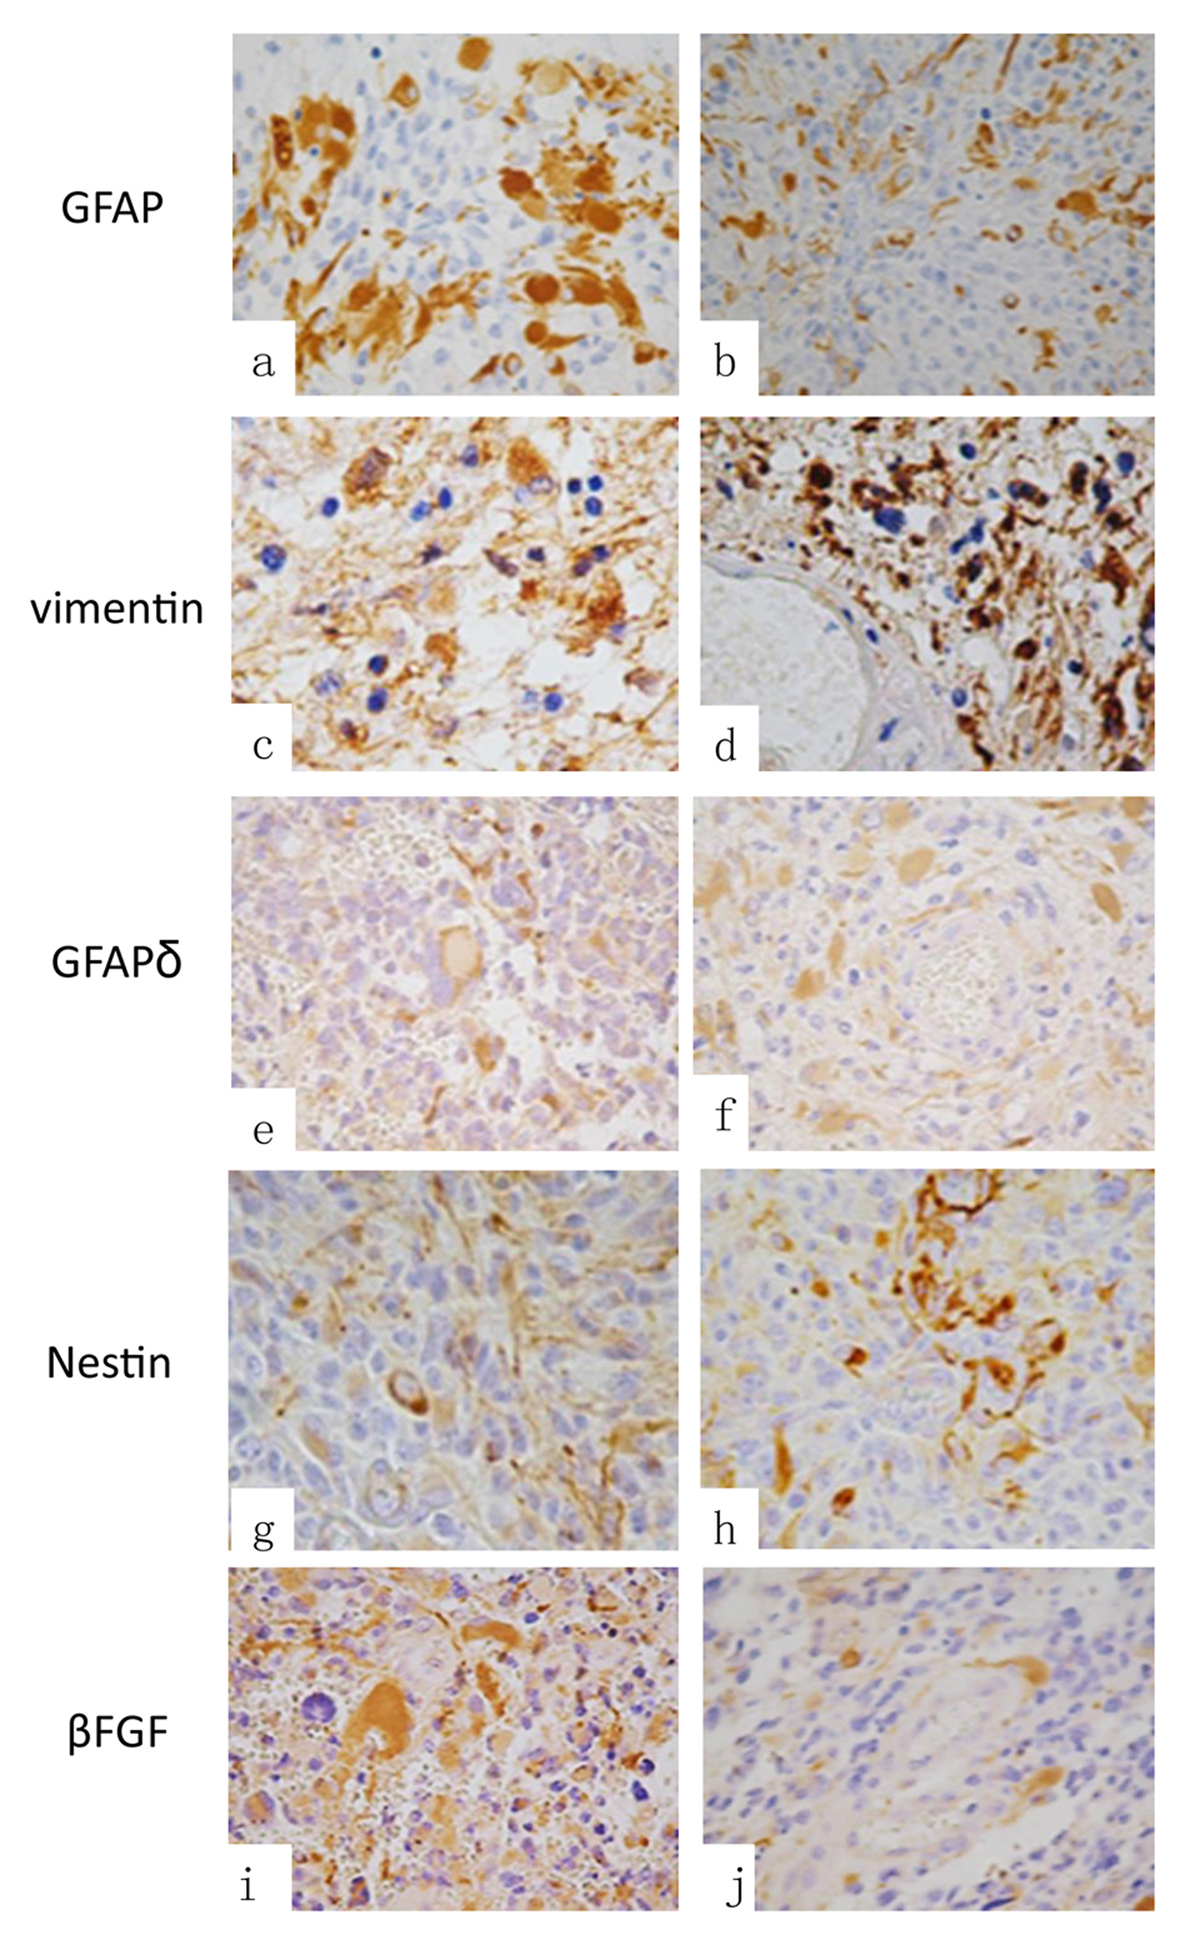
Figure 1. Immunohistochemistry: (a) GFAP in tumor cells, (b) GFAP in perivascular cells, (c) vimentin in cells, (d) perivascular vimentin, (e) GFAP-δ in tumoral cells and in (f) GFAP-δ expression in perivascular cells. (g) Expression of nestin positive cells in tumoral areas and (h) nestin positive perivascular cells. (i) Expression of βFGF in tumoral cells and in (j) observed βFGF positive immunoreaction in peritumoral cells (original magnification × 400).
Figure 2.
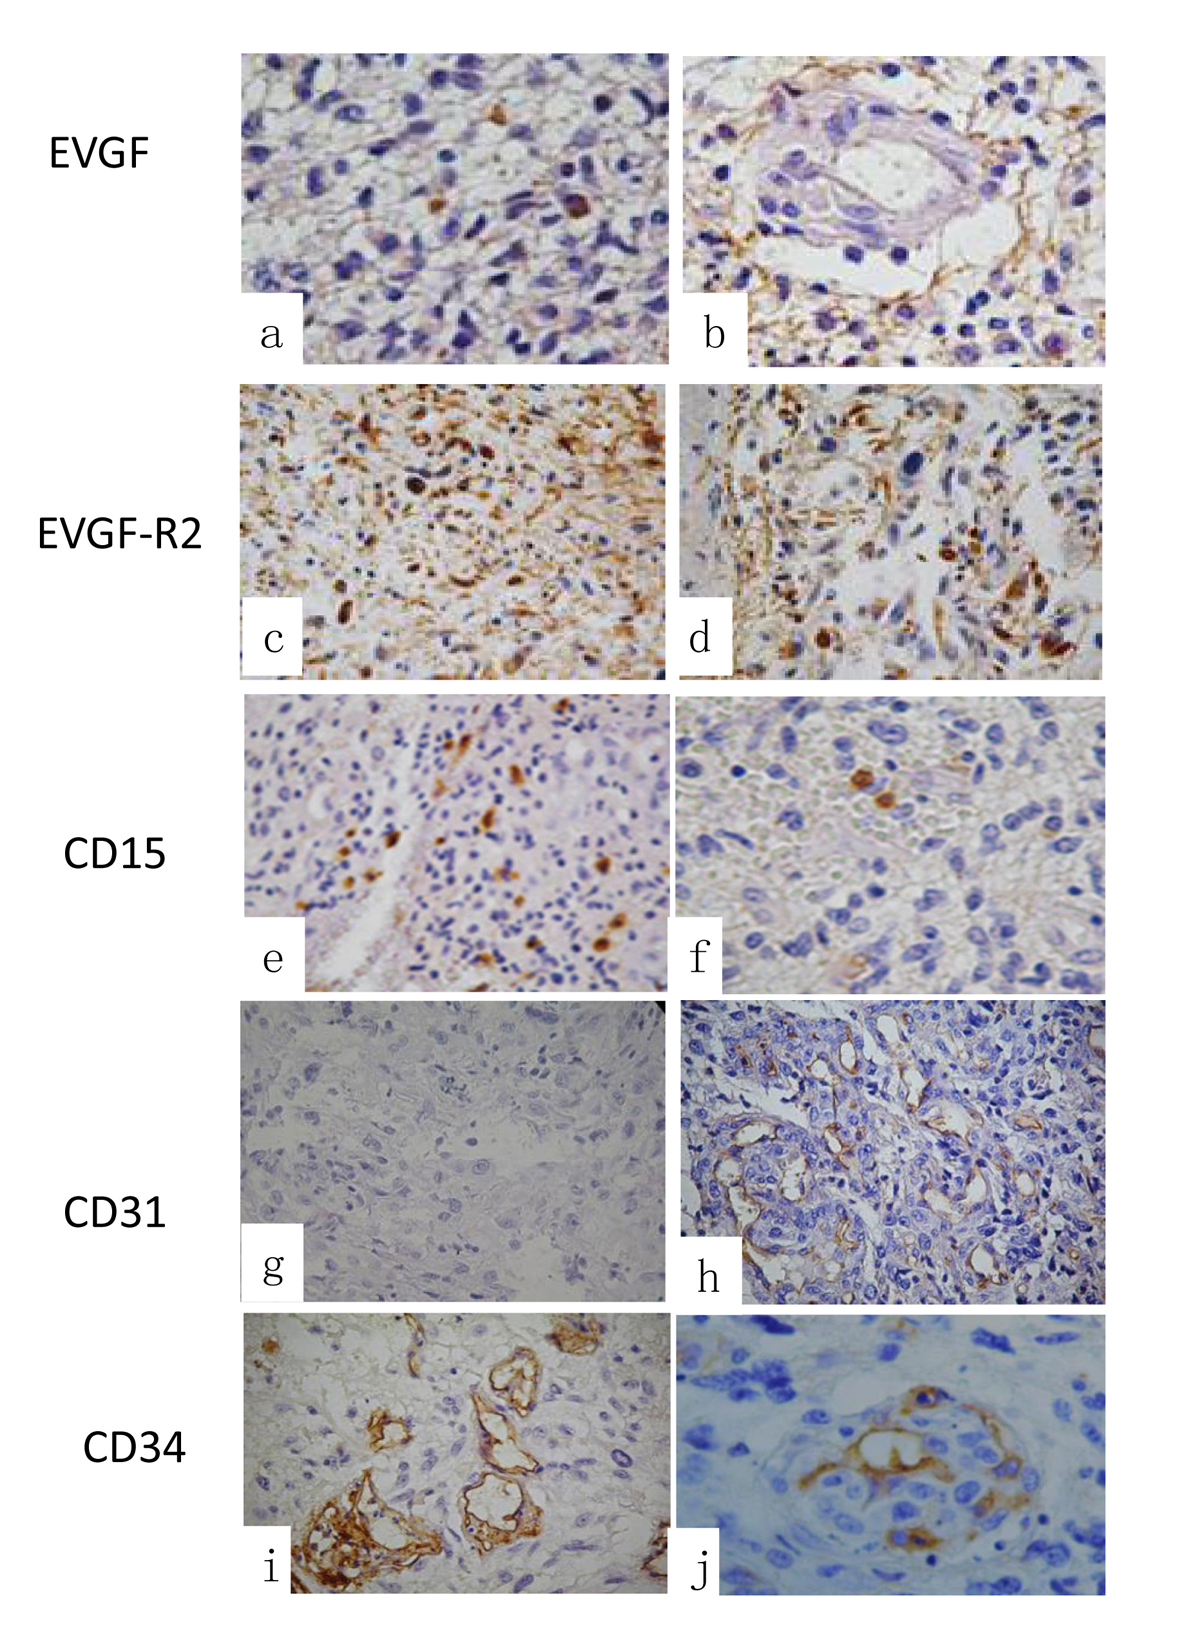
Figure 2. Immunohistochemistry of the different primary antibodies used: (a) expression of EVGF in tumoral cells and in (b) perivascular cells EVGF positive cells. (c) EVGF-R2 immunoexpression in tumoral cells and in (d) in perivascular cells positive reaction. (e) The immunoexpression of CD15 in tumoral cells and in (f) perivascular and endothelial cells. (g) CD31 expression of tumoral cells and in (h) perivascular and endothelial cells. (i) The expression of CD34 in tumoral areas and in (j) perivascular and endothelial cells immunoreaction (original magnification × 400).
Figure 3.
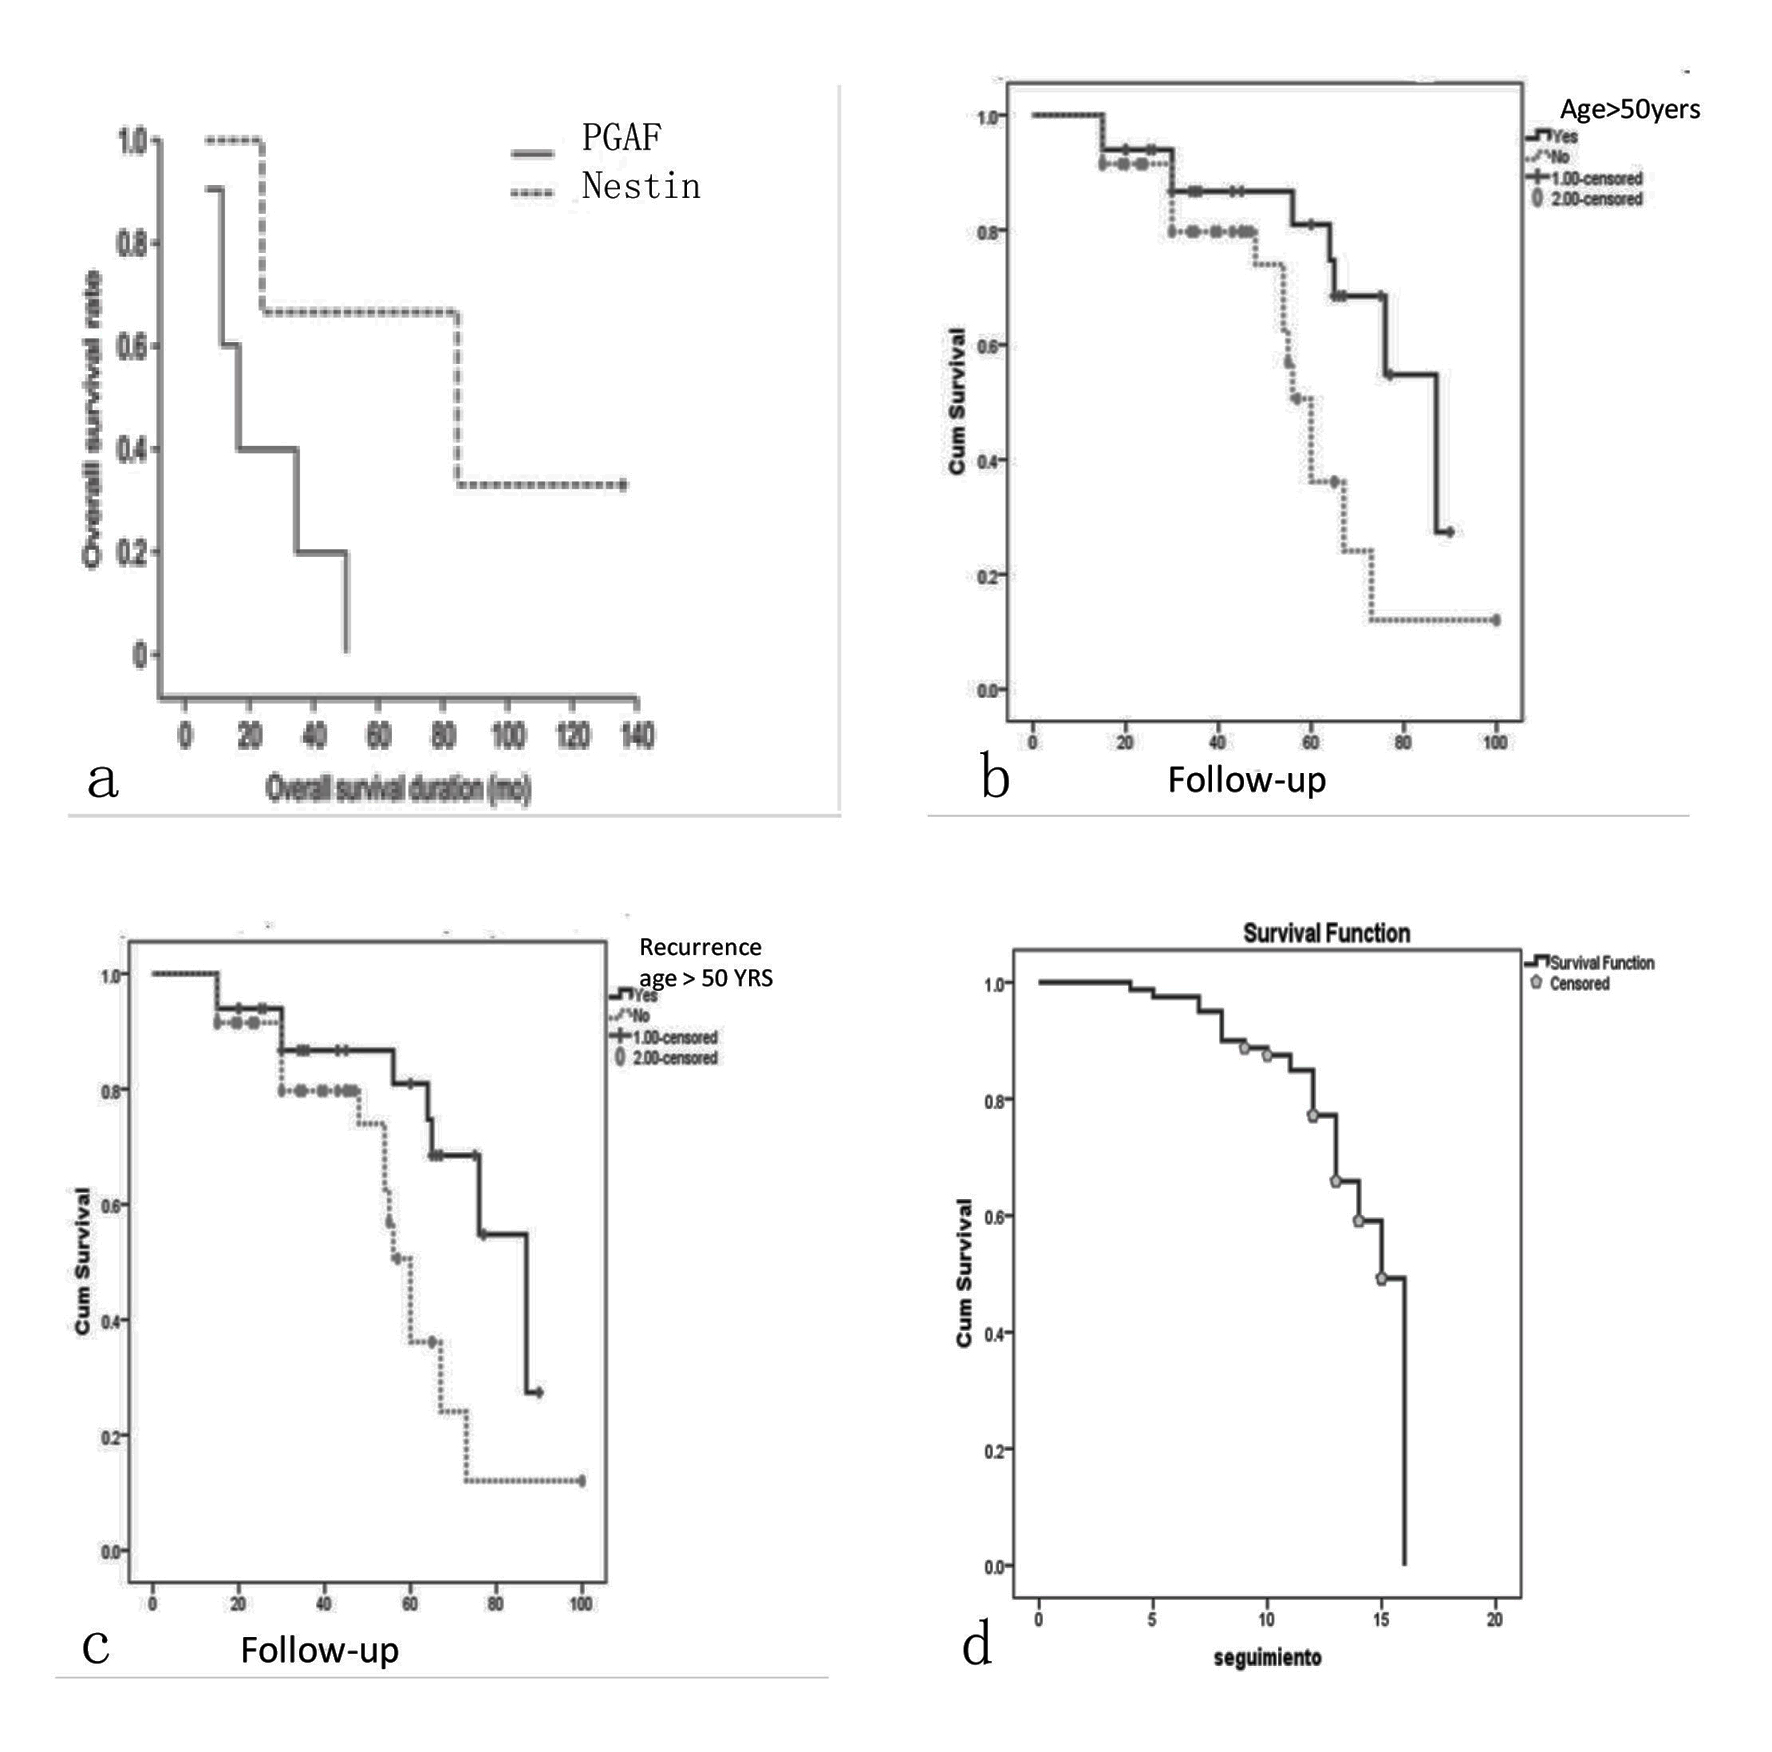
Figure 3. Kaplan-Meier curves stratified by follow-up and survival. (a) Kaplan-Meier curves stratified with nestin and GFAP immunoexpression correlation ship and the follow-up of the patients. (b) The curve of the relation between patients < 50 years and > 50 years and survival. (c) The curve stratified by recurrence and follow-up and in (d) the survival of the all patients, the median survival at 15 months.

Tables

Table 1. Clinical and Epidemiological Data of Patients Operated With Glioblastoma
 
Clinical dataPrimary (n = 35)Secondary (n = 45)P value< 50 years (n = 17)> 50 years (n = 63)P value
The symptoms up onset, follow-up were calculated by median mounts. Age was also calculated by years and median.
Age57 years58 years0.23146 years61 years0.230
Female21 (60)27 (60)0.0009 (53)39 (62)0.448
Male14 (40)18 (40)8 (47)24 (38)
Simtoms upset40 months36 months0.00024 months45 months0.737
Total exeresis12 (43)12 (27)0.5445 (29)19 (30)0.004
Partial exeresis23 (61)33 (73)12 (71)44 (70)
Recurrence32 (91)28 (62)0.00315 (88)350.014
Post treatment status0.2200.140
  Improvement6 (17)6 (13)4 (24)5 (8)
  Deterioration11 (31)11 (24)6 (35)16 (25)
  Unchanged4 (11)30 (67)6 (35)40 (63)
Complementary treatment19 (54)25 (56)0.0217 (41)25 (40)0.012
Death21 (60)25 (56)0.0017 (41)45 (71)0.012
Follow-up (15 months)13 months13 months0.98613 months12 months0.056
Survival4 months2 months0.9986 months2 months0.567


Table 2. Histological Features and Index According to Primary vs. Secondary Tumors and Age
 
Primary (n = 35)Secondary (n = 45)P value< 50 years (n = 17)> 50 years (n = 63)P value
Mitosis index, MIB-1 index and microvascular density index were calculated by median.
Necrosis23 (66)37 (82)0.09111 (65)49 (78)0.123
Inflammation11 (31)25 (56)0.0319 (53)27 (43)0.458
Mitosis index330.521430.097
Ki67-LI18190.03318200.549
MVD (CD31)65620.50658650.117
MVD (CD34)70790.00071890.037


Table 3. Immunoexpression of Primary Antibodies and Labeling Index in Perivascular and Tumoral Areas According to Primary vs. Secondary Tumors
 
Primary antibodiesPrimary tumorsSecondary tumors
Perivascular cellsTumoral cellsPerivascular cellsTumoral cellsP value
In all primary antibodies were evaluated by median.
CD3165.002.0062.002.000.037
CD3469.002.0070.002.000.030
CD152.00.001.50.000.261
Factor VIII6.001.505.001.000.231
Vimentin65.6450.0062.0050.000.043
GFAP6.0070.008.5070.000.285
Nestin78.0043.0071.0042.000.275
GFAP-δ75.002.0070.001.500.000
EVGF62.003.0063.002.000.005
EVGF-R274.501.5071.002.000.000
βFGF65.0055.0062.0048.000.037