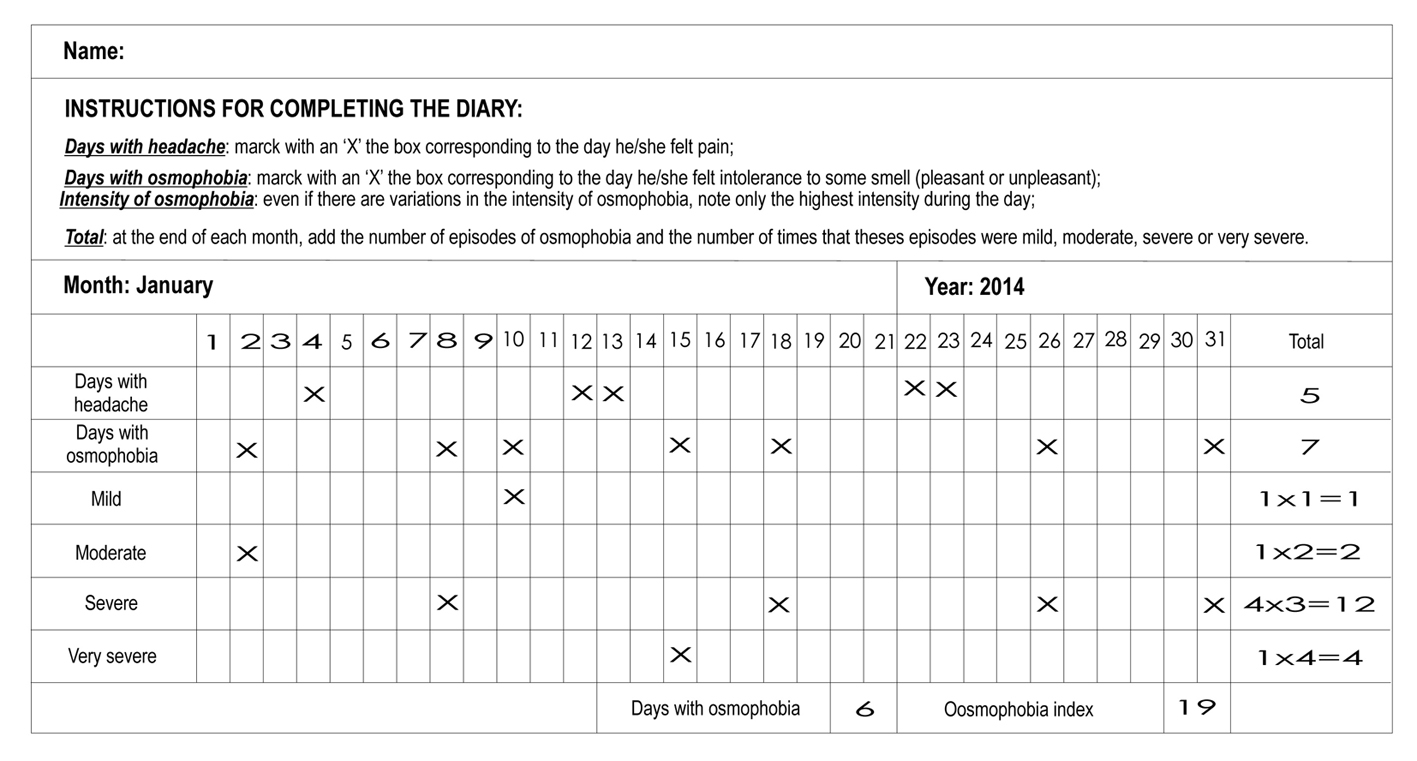
Figure 1. The osmophobia diary.
| Journal of Neurology Research, ISSN 1923-2845 print, 1923-2853 online, Open Access |
| Article copyright, the authors; Journal compilation copyright, J Neurol Res and Elmer Press Inc |
| Journal website http://www.neurores.org |
Original Article
Volume 5, Number 1-2, April 2015, pages 160-166
Evaluation of the Frequency and Intensity of Osmophobia Between Headache Attacks in Migraine Patients Through an Osmophobia Diary
Figure
Tables
| Variables | Diagnostic | P value | |
|---|---|---|---|
| MWA | ETTH | ||
| MWA: migraine without aura; ETTH: episodic tension-type headache; CI: confidence interval. *P value based on the Chi-square test; †P value by the Mann-Whitney test for average difference test between averages of unpaired samples. | |||
| Sex | < 0.001* | ||
| Female (n, %) | 182 (91.0) | 37 (18.5) | |
| Male (n, %) | 18 (9.0) | 163 (81.5) | |
| Age (years) | 0.008† | ||
| Mean | 37.3 (9.0) | 40.0 (10.4) | |
| 95% CI | 36.0 - 38.6 | 38.5 - 41.4 | |
| Symptom | Diagnosis | P value | |||
|---|---|---|---|---|---|
| MWA | ETTH | ||||
| n | % | n | % | ||
| MWA: migraine without aura; ETTH: episodic tension-type headache. aP value by Chi-square test. | |||||
| Osmophobia between headache attacks | 48 | 24.0 | 0 | 0.0 | < 0.014a |
| Female | 37 | 20.3 | 0 | 0.0 | |
| Male | 11 | 61.1 | 0 | 0.0 | |
| Variables | Episodes of osmophobia | ||
|---|---|---|---|
| Number of days (n, %) | Average | 95% CI | |
| VAS: visual analog scale. | |||
| Days with osmophobia | 748 (100.0) | 15.6 ± 6.8 | 13.7 - 17.5 |
| Mild (VAS 1 - 4) | 117 (15.6) | 2.4 ± 3.4 | 1.4 - 3.4 |
| Moderate (VAS 5 - 7) | 171 (22.9) | 3.6 ± 3.4 | 2.6 - 4.5 |
| Severe (VAS 8 - 9) | 264 (35.3) | 5.5 ± 3.9 | 4.4 - 6.6 |
| Very severe (VAS 10) | 196 (26.2) | 4.1 ± 3.2 | 3.2 - 5.0 |
| Patient | Frequency (days) | Intensity | OIa | |||
|---|---|---|---|---|---|---|
| Mild (VAS 1 - 4) | Moderate (VAS 5 - 7) | Severe (VAS 8 - 9) | Very severe (VAS 10) | |||
| VAS: visual analog scale; OI: osmophobia index. aTo calculate the osmophobia index, we multiplied the amount of mild, moderate, severe and very severe intensities, respectively, by the scores 1, 2, 3 and 4. | ||||||
| 1 | 6 | 1 | 0 | 2 | 3 | 19 |
| 2 | 17 | 3 | 7 | 7 | 0 | 38 |
| 3 | 23 | 4 | 4 | 5 | 10 | 67 |
| 4 | 12 | 0 | 0 | 4 | 8 | 44 |
| 5 | 21 | 3 | 10 | 4 | 4 | 51 |
| 6 | 5 | 0 | 0 | 0 | 5 | 20 |
| 7 | 18 | 2 | 3 | 8 | 5 | 52 |
| 8 | 10 | 0 | 3 | 3 | 4 | 31 |
| 9 | 20 | 1 | 0 | 12 | 7 | 65 |
| 10 | 24 | 3 | 11 | 5 | 5 | 60 |
| 11 | 5 | 0 | 0 | 0 | 5 | 20 |
| 12 | 20 | 2 | 4 | 0 | 14 | 66 |
| 13 | 25 | 3 | 14 | 5 | 3 | 58 |
| 14 | 6 | 1 | 0 | 4 | 1 | 17 |
| 15 | 10 | 0 | 0 | 0 | 10 | 40 |
| 16 | 18 | 2 | 3 | 8 | 5 | 52 |
| 17 | 12 | 0 | 2 | 5 | 5 | 39 |
| 18 | 17 | 2 | 3 | 7 | 5 | 49 |
| 19 | 10 | 0 | 0 | 8 | 2 | 32 |
| 20 | 16 | 2 | 3 | 7 | 4 | 45 |
| 21 | 12 | 1 | 1 | 10 | 0 | 33 |
| 22 | 24 | 11 | 7 | 3 | 3 | 36 |
| 23 | 16 | 4 | 3 | 9 | 0 | 37 |
| 24 | 21 | 0 | 6 | 15 | 0 | 57 |
| 25 | 9 | 0 | 3 | 5 | 1 | 25 |
| 26 | 5 | 0 | 0 | 5 | 0 | 15 |
| 27 | 24 | 3 | 10 | 6 | 5 | 61 |
| 28 | 12 | 0 | 1 | 1 | 10 | 45 |
| 29 | 22 | 0 | 3 | 15 | 4 | 67 |
| 30 | 18 | 0 | 3 | 8 | 7 | 58 |
| 31 | 18 | 2 | 3 | 8 | 5 | 56 |
| 32 | 5 | 0 | 4 | 0 | 1 | 12 |
| 33 | 18 | 0 | 3 | 5 | 10 | 61 |
| 34 | 20 | 12 | 8 | 0 | 0 | 28 |
| 35 | 10 | 4 | 1 | 5 | 0 | 21 |
| 36 | 25 | 10 | 6 | 9 | 0 | 49 |
| 37 | 15 | 15 | 0 | 0 | 0 | 15 |
| 38 | 20 | 2 | 4 | 9 | 5 | 57 |
| 39 | 16 | 2 | 3 | 7 | 4 | 45 |
| 40 | 3 | 0 | 0 | 0 | 3 | 12 |
| 41 | 22 | 3 | 4 | 10 | 5 | 61 |
| 42 | 20 | 8 | 4 | 5 | 3 | 46 |
| 43 | 20 | 0 | 6 | 9 | 5 | 59 |
| 44 | 5 | 1 | 1 | 0 | 3 | 15 |
| 45 | 25 | 3 | 5 | 11 | 6 | 70 |
| 46 | 24 | 5 | 11 | 3 | 5 | 56 |
| 47 | 20 | 2 | 4 | 9 | 5 | 57 |
| 48 | 4 | 0 | 0 | 3 | 1 | 13 |