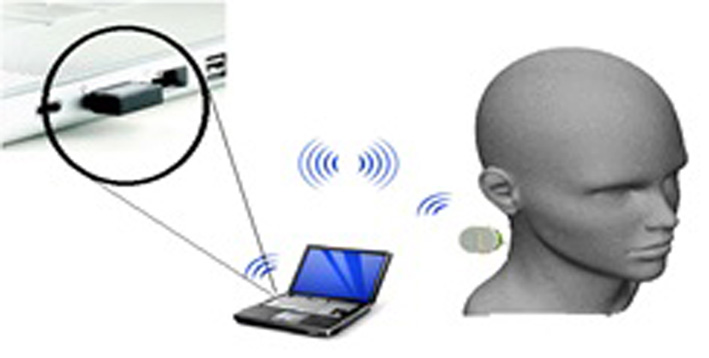
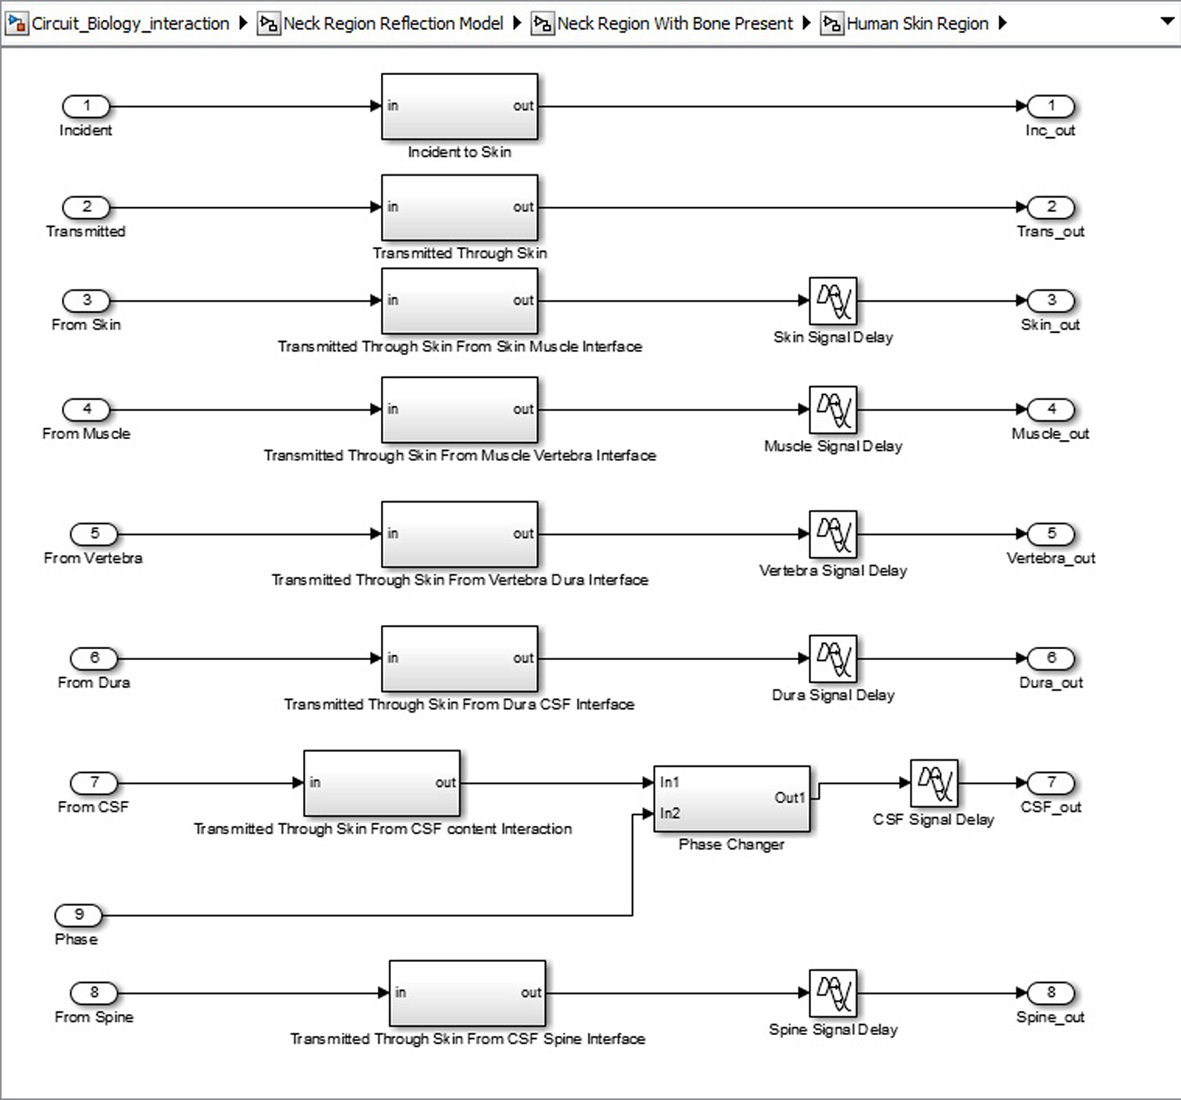
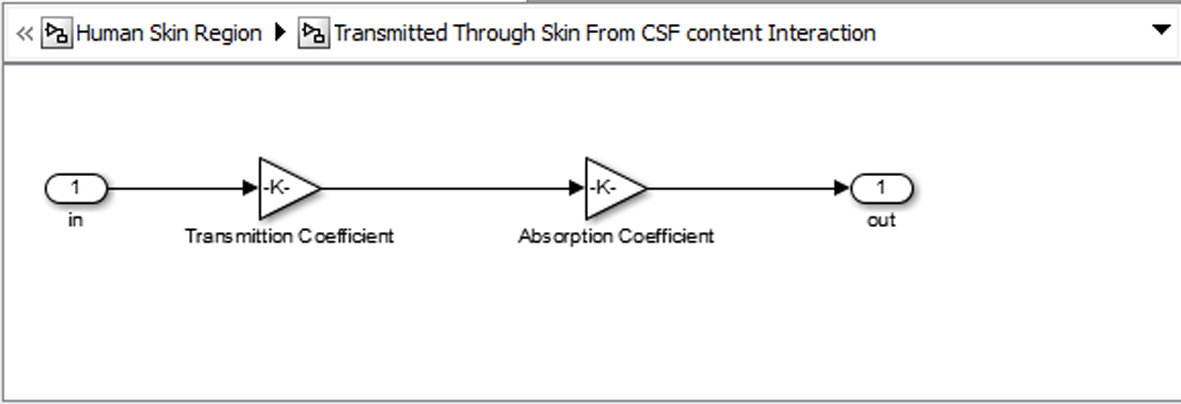
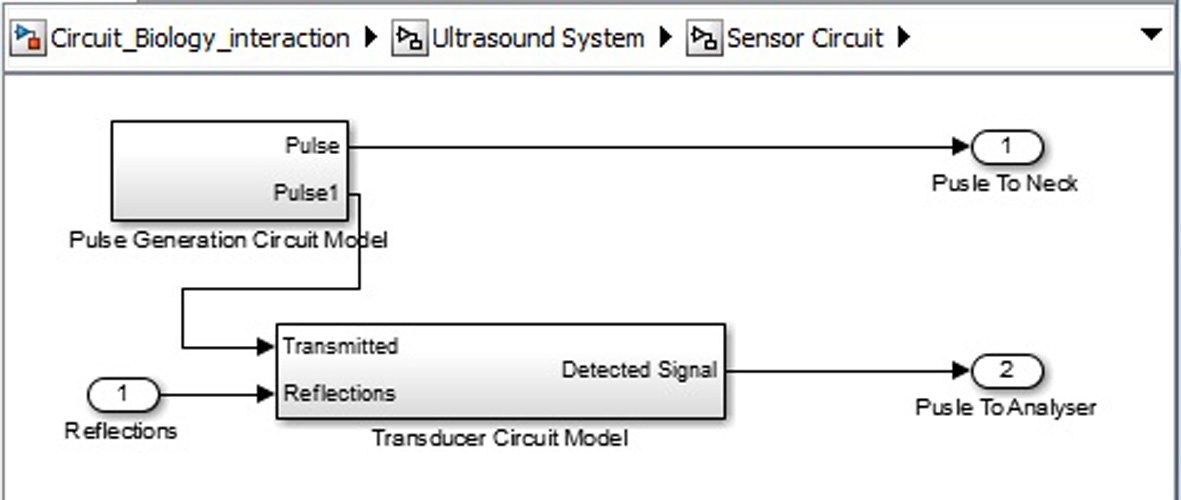
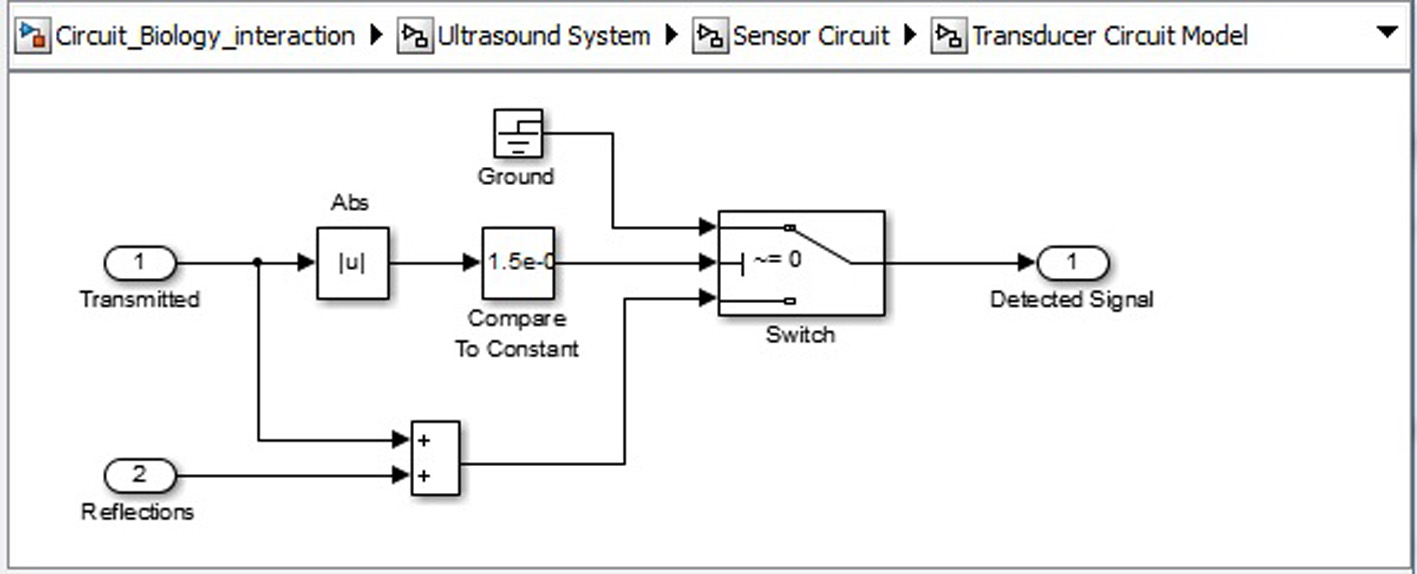
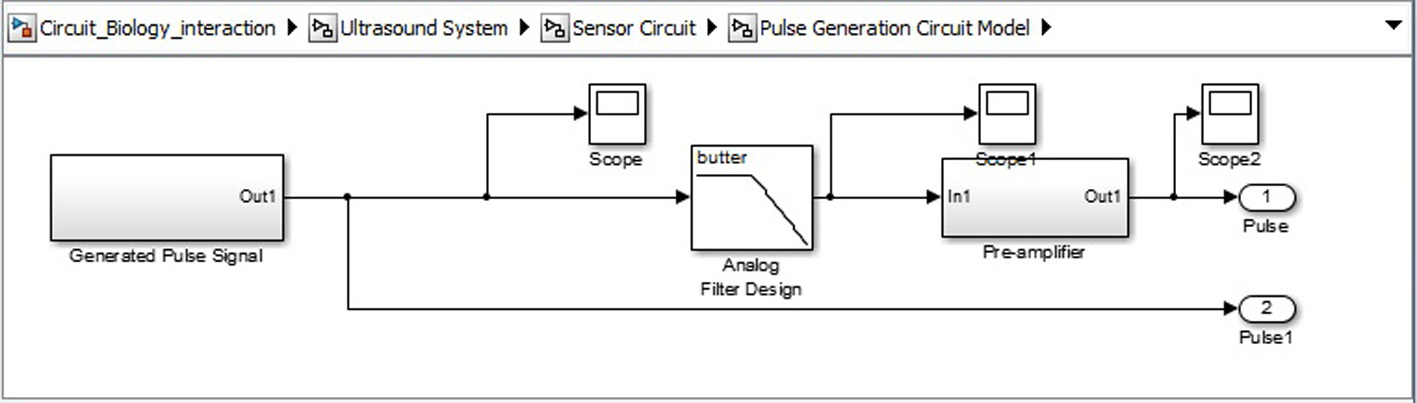
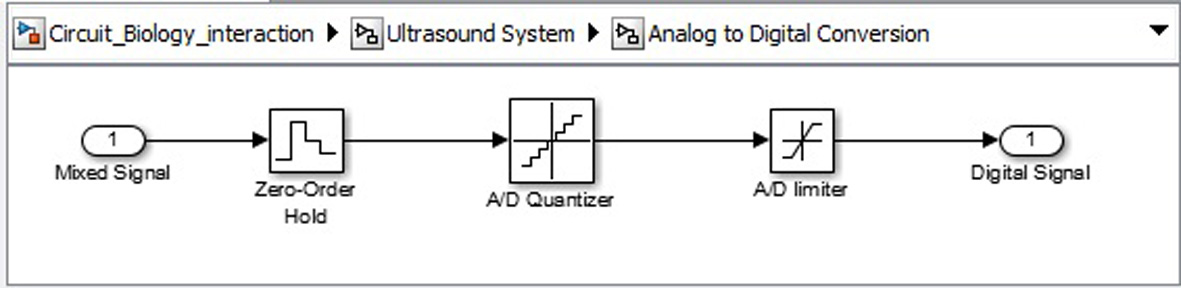
Figure 1. Proposed model for ICP monitoring device.
| Journal of Neurology Research, ISSN 1923-2845 print, 1923-2853 online, Open Access |
| Article copyright, the authors; Journal compilation copyright, J Neurol Res and Elmer Press Inc |
| Journal website http://www.neurores.org |
Original Article
Volume 5, Number 1-2, April 2015, pages 167-180
A Non-Invasive Detection and Monitoring of Intracranial Pressure Using Ultrasound Sensors
Figures


Tables
| Regions | Properties | |||
|---|---|---|---|---|
| Density (kg/m3) | Speed of sound (m/s) | Attenuation (Np/m/MHz) | Tissue thickness (mm) | |
| Transducer | 7,660 | 5200 | - | - |
| Skin | 1,010 - 1,020 | 1,720 - 1,540 | 3.300 | 1.4 - 4 |
| Neck muscle | 1,040 - 1,070 | 1,580 - 1,566 | 20.000 | 14 - 27.5, 10 - 14.5 |
| Vertebra column | 1,400 - 1,810 | 3,299 - 4,080 | 1.000 | 10 - 13.0 |
| Dura mater | 1,010 - 1,020 | 1,720 - 1,540 | 0.025 | 0.4 - 0.9 |
| Cerebrospinal fluid | 990 - 1,000 | 1,527 - 1,519 | 1.000 | 0.3 - 0.5 |
| Spinal cord | 1,010 - 1,020 | 1,720 - 1,540 | 0.025 | 2 - 3.51 |
| Region | Range | |||||||||
|---|---|---|---|---|---|---|---|---|---|---|
| 1 | 2 | 3 | 4 | 5 | 6 | 7 | 8 | 9 | 10 | |
| Density (kg/m3) | ||||||||||
| Skin | 1,010 | 1,011 | 1,012 | 1,013 | 1,014 | 1,015 | 1,016 | 1,017 | 1,018 | 1,020 |
| Muscle | 1,040 | 1,043 | 1,046 | 1,050 | 1,053 | 1,056 | 1,060 | 1,063 | 1,066 | 1,070 |
| Vertebra | 1,400 | 1,445 | 1,491 | 1,536 | 1,582 | 1,627 | 1,673 | 1,718 | 1,764 | 1,810 |
| Dura | 1,010 | 1,011 | 1,012 | 1,013 | 1,014 | 1,015 | 1,016 | 1,017 | 1,018 | 1,020 |
| CSF | 990 | 991 | 992 | 993 | 994 | 995 | 996 | 997 | 998 | 1,000 |
| Spine | 1,010 | 1,011 | 1,012 | 1,013 | 1,014 | 1,015 | 1,016 | 1,017 | 1,018 | 1,020 |
| Speed of sound (m/s) | ||||||||||
| Skin | 1,720 | 1,700 | 1,680 | 1,660 | 1,640 | 1,620 | 1,600 | 1,580 | 1,560 | 1,540 |
| Muscle | 1,580 | 1,578 | 1,577 | 1,575 | 1,574 | 1,572 | 1,571 | 1,569 | 1,568 | 1,566 |
| Vertebra | 3,299 | 3,386 | 3,472 | 3,559 | 3,646 | 3,733 | 3,820 | 3,906 | 3,993 | 4,080 |
| Dura | 1,720 | 1,700 | 1,680 | 1,660 | 1,640 | 1,620 | 1,600 | 1,580 | 1,560 | 1,540 |
| CSF | 1,527 | 1,526 | 1,525 | 1,524 | 1,523.4 | 1,523 | 1,522 | 1,521 | 1,520 | 1,519 |
| Spine | 1,720 | 1,700 | 1,680 | 1,660 | 1,640 | 1,620 | 1,600 | 1,580 | 1,560 | 1,540 |
| Thickness (mm) | ||||||||||
| Skin | 1.40 | 1.70 | 2.00 | 2.30 | 2.60 | 2.80 | 3.10 | 3.40 | 3.70 | 4.00 |
| Muscle | 27.50, 14.50 | 26.00, 14.00 | 24.50, 13.50 | 23.00, 13.00 | 21.50, 12.50 | 20.00, 12.00 | 18.50, 11.50 | 17.00, 11.00 | 15.50, 10.50 | 14.00, 10.00 |
| Vertebra | 10.00 | 10.30 | 10.70 | 11.00 | 11.30 | 11.70 | 12.00 | 12.30 | 12.70 | 13.00 |
| Dura | 0.40 | 0.46 | 0.51 | 0.57 | 0.62 | 0.70 | 0.73 | 0.80 | 0.84 | 0.90 |
| CSF | 0.30 | 0.32 | 0.34 | 0.37 | 0.39 | 0.41 | 0.43 | 0.45 | 0.48 | 0.50 |
| Spine | 2.00 | 2.20 | 2.30 | 2.50 | 2.70 | 2.80 | 3.00 | 3.20 | 3.30 | 3.50 |
| Speed of sound (m/s) | Fresnel length (mm) | Region thickness (mm) | ||||||||
|---|---|---|---|---|---|---|---|---|---|---|
| 2 MHz | 3 MHz | 5 MHz | 8 MHz | 10 MHz | 12 MHz | 15 MHz | 18 MHz | 20 MHz | ||
| Skin region | ||||||||||
| 1,720 | 4.651 | 6.976 | 11.627 | 18.604 | 23.255 | 27.906 | 34.882 | 41.860 | 46.511 | 1.40 |
| 1,700 | 4.705 | 7.058 | 11.764 | 18.823 | 23.529 | 28.235 | 35.294 | 42.352 | 47.058 | 1.70 |
| 1,680 | 4.761 | 7.142 | 11.904 | 19.047 | 23.809 | 28.571 | 35.714 | 42.857 | 47.619 | 2.00 |
| 1,660 | 4.819 | 7.228 | 12.048 | 19.277 | 24.390 | 28.915 | 36.144 | 43.373 | 48.192 | 2.30 |
| 1,640 | 4.878 | 7.317 | 12.195 | 19.512 | 24.391 | 29.268 | 36.585 | 43.902 | 48.780 | 2.60 |
| 1,620 | 4.938 | 7.407 | 12.345 | 19.753 | 24.691 | 29.629 | 37.037 | 44.444 | 49.382 | 2.80 |
| 1,600 | 5.000 | 7.500 | 12.500 | 20.000 | 25.000 | 30.000 | 37.500 | 45.000 | 50.000 | 3.10 |
| 1,580 | 5.063 | 7.594 | 12.658 | 20.253 | 25.316 | 30.379 | 37.974 | 45.569 | 50.632 | 3.40 |
| 1,560 | 5.128 | 7.692 | 12.820 | 20.512 | 25.641 | 30.769 | 38.461 | 46.153 | 51.282 | 3.70 |
| 1,540 | 5.194 | 7.792 | 12.987 | 20.779 | 25.974 | 31.168 | 38.961 | 46.753 | 51.948 | 4.00 |
| Muscle region | ||||||||||
| 1,580 | 5.063 | 7.594 | 12.658 | 20.253 | 25.316 | 30.379 | 37.974 | 45.569 | 50.632 | 14.0, 10.0 |
| 1,578 | 5.068 | 7.602 | 12.670 | 20.273 | 25.341 | 30.409 | 38.012 | 45.614 | 50.682 | 15.5, 10.5 |
| 1,577 | 5.073 | 7.609 | 12.683 | 20.293 | 25.366 | 30.439 | 38.049 | 45.659 | 50.732 | 17.0, 11.0 |
| 1,575 | 5.078 | 7.617 | 12.695 | 20.313 | 25.391 | 30.469 | 30.087 | 45.704 | 50.782 | 18.5, 11.5 |
| 1,574 | 5.083 | 7.624 | 12.708 | 20.333 | 25.416 | 30.499 | 38.124 | 45.749 | 50.833 | 20.0, 12.0 |
| 1,572 | 5.088 | 7.632 | 12.720 | 20.353 | 25.441 | 30.530 | 38.162 | 45.795 | 50.883 | 21.5, 12.5 |
| 1,571 | 5.093 | 7.640 | 12.733 | 20.373 | 25.466 | 30.560 | 38.200 | 45.840 | 50.933 | 23.0, 13.0 |
| 1,569 | 5.098 | 7.647 | 12.746 | 20.393 | 25.492 | 30.590 | 38.238 | 45.885 | 50.984 | 24.5, 13.5 |
| 1,568 | 5.103 | 7.655 | 12.758 | 20.413 | 25.517 | 30.620 | 38.276 | 45.931 | 51.034 | 26.0, 14.0 |
| 1,566 | 5.108 | 7.662 | 12.771 | 20,434 | 25,542 | 30.651 | 38.314 | 45.977 | 51.085 | 27.5, 14.5 |
| Vertebra region | ||||||||||
| 3,299 | 2.424 | 3.637 | 6.062 | 9.699 | 12.124 | 14.559 | 18.187 | 21.824 | 24.249 | 10.0 |
| 3,386 | 2.362 | 3.544 | 5.907 | 9.451 | 11.814 | 14.176 | 17.721 | 21.265 | 23.628 | 10.3 |
| 3,472 | 2.303 | 3.455 | 5.759 | 9.215 | 11.518 | 13.822 | 17.278 | 20.734 | 23.037 | 10.7 |
| 3,559 | 2.247 | 3.371 | 5.619 | 8.990 | 11.238 | 13.485 | 16.875 | 20.228 | 22.476 | 11.0 |
| 3,646 | 2.194 | 3.291 | 5.485 | 8.776 | 10.970 | 13.164 | 16.455 | 19.747 | 21.941 | 11.3 |
| 3,733 | 2.143 | 3.214 | 5.357 | 8.572 | 10.715 | 12.858 | 16.073 | 19.288 | 21.431 | 11.7 |
| 3,820 | 2.094 | 3.141 | 5.236 | 8.377 | 10.472 | 12.566 | 15.708 | 18.849 | 20.944 | 12.0 |
| 3,906 | 2.047 | 3.071 | 5.119 | 8.191 | 10.239 | 12.287 | 17.359 | 18.431 | 20.478 | 12.3 |
| 3,993 | 2.003 | 3.005 | 5.008 | 8.013 | 10.016 | 12.020 | 15.025 | 18.030 | 20.033 | 12.7 |
| 4,080 | 1.960 | 2.941 | 4.901 | 7.843 | 9.803 | 11.764 | 14.705 | 17.647 | 19.607 | 13.0 |
| Dura region | ||||||||||
| 1,720 | 4.651 | 6.976 | 11.627 | 18.604 | 23.255 | 27.906 | 34.882 | 41.860 | 46.511 | 0.40 |
| 1,700 | 4.705 | 7.058 | 11.764 | 18.823 | 23.529 | 28.235 | 35.294 | 42.352 | 47.058 | 0.46 |
| 1,680 | 4.761 | 7.142 | 11.904 | 19.047 | 23.809 | 28.571 | 35.714 | 42.857 | 47.619 | 0.51 |
| 1,660 | 4.819 | 7.228 | 12.048 | 19.277 | 24.390 | 28.915 | 36.144 | 43.373 | 48.192 | 0.57 |
| 1,640 | 4.878 | 7.317 | 12.195 | 19.512 | 24.391 | 29.268 | 36.585 | 43.902 | 48.780 | 0.62 |
| 1,620 | 4.938 | 7.407 | 12.345 | 19.753 | 24.691 | 29.629 | 37.037 | 44.444 | 49.382 | 0.70 |
| 1,600 | 5.000 | 7.500 | 12.500 | 20.000 | 25.000 | 30.000 | 37.500 | 45.000 | 50.000 | 0.73 |
| 1,580 | 5.063 | 7.594 | 12.658 | 20.253 | 25.316 | 30.379 | 37.974 | 45.569 | 50.632 | 0.80 |
| 1,560 | 5.128 | 7.692 | 12.820 | 20.512 | 25.641 | 30.769 | 38.461 | 46.153 | 51.282 | 0.84 |
| 1,540 | 5.194 | 7.792 | 12.987 | 20.779 | 25.974 | 31.168 | 38.961 | 46.753 | 51.948 | 0.90 |
| CSF region | ||||||||||
| 1,527 | 5.239 | 7.858 | 13.097 | 20.956 | 26.195 | 31.434 | 39.292 | 47.151 | 52.390 | 0.30 |
| 1,526 | 5.242 | 7.863 | 13.105 | 20.968 | 26.210 | 31.452 | 39.315 | 47.187 | 52.420 | 0.32 |
| 1,525 | 5.245 | 7.867 | 13.112 | 20.980 | 26.225 | 31.470 | 39.338 | 47.206 | 52.451 | 0.34 |
| 1,524 | 5.248 | 7.872 | 13.120 | 20.992 | 26.240 | 31.489 | 39.631 | 47.233 | 52.481 | 0.37 |
| 1,523.4 | 5.251 | 7.876 | 13.128 | 21.005 | 26.256 | 31.507 | 39.384 | 47.261 | 52.512 | 0.39 |
| 1,523 | 5.254 | 7.881 | 13.135 | 21.017 | 26.271 | 31.525 | 39.407 | 47.288 | 52.543 | 0.41 |
| 1,522 | 5.257 | 7.886 | 13.143 | 21.029 | 26.286 | 31.544 | 39.430 | 47.316 | 52,573 | 0.43 |
| 1,521 | 5.260 | 7.890 | 13.151 | 21.041 | 26.302 | 31.562 | 39.453 | 47.344 | 52.604 | 0.45 |
| 1,520 | 5.263 | 7.895 | 13.158 | 21.054 | 26.317 | 31.581 | 39.476 | 47.371 | 52.635 | 0.48 |
| 1,519 | 5.266 | 7.899 | 13.166 | 21.066 | 26.333 | 31.599 | 39.499 | 47.399 | 52.666 | 0.50 |
| Spinal region | ||||||||||
| 1,720 | 4.651 | 6.976 | 11.627 | 18.604 | 23.255 | 27.906 | 34.882 | 41.860 | 46.511 | 2.00 |
| 1,700 | 4.705 | 7.058 | 11.764 | 18.823 | 23.529 | 28.235 | 35.294 | 42.352 | 47.058 | 2.20 |
| 1,680 | 4.761 | 7.142 | 11.904 | 19.047 | 23.809 | 28.571 | 35.714 | 42.857 | 47.619 | 2.30 |
| 1,660 | 4.819 | 7.228 | 12.048 | 19.277 | 24.390 | 28.915 | 36.144 | 43.373 | 48.192 | 2.50 |
| 1,640 | 4.878 | 7.317 | 12.195 | 19.512 | 24.391 | 29.268 | 36.585 | 43.902 | 48.780 | 2.70 |
| 1,620 | 4.938 | 7.407 | 12.345 | 19.753 | 24.691 | 29.629 | 37.037 | 44.444 | 49.382 | 2.80 |
| 1,600 | 5.000 | 7.500 | 12.500 | 20.000 | 25.000 | 30.000 | 37.500 | 45.000 | 50.000 | 3.00 |
| 1,580 | 5.063 | 7.594 | 12.658 | 20.253 | 25.316 | 30.379 | 37.974 | 45.569 | 50.632 | 3.20 |
| 1,560 | 5.128 | 7.692 | 12.820 | 20.512 | 25.641 | 30.769 | 38.461 | 46.153 | 51.282 | 3.30 |
| 1,540 | 5.194 | 7.792 | 12.987 | 20.779 | 25.974 | 31.168 | 38.961 | 46.753 | 51.948 | 3.50 |
| Region thickness (mm) | Wavelength (mm) | Travel time (µs) | Attenuation (Gain) | Coefficients | |||||
|---|---|---|---|---|---|---|---|---|---|
| Reflection | Transmission | ||||||||
| A | B | A | B | A | B | A | B | ||
| Test set 1 - 10 MHz | |||||||||
| 1.40 | 0.1720 | 0.81 | 0.81 | 0.9999 | 0.9999 | 0.8398 | 0.8398 | 0.1602 | 0.1602 |
| 14.0, 10.0 | 0.1580 | 8.90 | 17.33 | 0.9935 | 0.9967 | 0.0008 | 0.0008 | 0.9999 | 0.9992 |
| 10.0 | 0.3299 | 3.03 | - | 0.9801 | - | 0.2257 | - | 0.7742 | - |
| 0.40 | 0.1720 | 0.23 | 0.23 | 0.9999 | 0.9999 | 0.2055 | 0.2055 | 0.7945 | 0.7945 |
| 0.30 | 0.1527 | 0.20 | 0.20 | 0.9999 | 0.9999 | 0.0048 | 0.0048 | 0.9952 | 0.9952 |
| 2.00 | 0.1720 | 1.20 | 1.20 | 0.9999 | 0.9999 | 0.0048 | 0.0048 | 0.9952 | 0.9952 |
| Test set 2 - 10 MHz | |||||||||
| 1.70 | 0.1700 | 1.00 | 1.00 | 0.9999 | 0.9999 | 0.8400 | 0.8400 | 0.1600 | 0.1600 |
| 15.5, 10.5 | 0.1578 | 8.87 | 16.5 | 0.9936 | 0.9779 | 0.0005 | 0.0005 | 0.9995 | 0.9995 |
| 10.3 | 0.3386 | 3.04 | - | 0.9790 | - | 0.2466 | - | 0.7534 | - |
| 0.46 | 0.1700 | 0.27 | 0.27 | 0.9999 | 0.9999 | 0.3145 | 0.3145 | 0.6855 | 0.6854 |
| 0.32 | 0.1526 | 0.21 | 0.21 | 0.9999 | 0.9999 | 0.7056 | 0.7056 | 0.2944 | 0.2944 |
| 2.20 | 0.1700 | 1.29 | 1.29 | 0.9999 | 0.9999 | 0.0041 | 0.0041 | 0.9959 | 0.9959 |
| Test set 3 - 12 MHz | |||||||||
| 2.00 | 0.1680 | 1.20 | 1.20 | 0.9999 | 0.9999 | 0.8430 | 0.8430 | 0.1570 | 0.1570 |
| 17.0, 11.0 | 0.1577 | 8.56 | 15.53 | 0.9765 | 0.9765 | 0.0002 | 0.0002 | 0.9998 | 0.9998 |
| 10.7 | 0.3472 | 3.08 | - | 0.9730 | - | 0.2670 | - | 0.7330 | - |
| 0.51 | 0.1640 | 0.30 | 0.30 | 0.9999 | 0.9999 | 0.2556 | 0.0002 | 0.7444 | 0.9998 |
| 0.34 | 0.1525 | 0.23 | 0.23 | 0.9999 | 0.9999 | 0.0034 | 0.0034 | 0.9966 | 0.9966 |
| 2.30 | 0.1700 | 1.37 | 1.37 | 0.9999 | 0.9999 | 0.0034 | 0.0034 | 0.9966 | 0.9966 |
| Test set 4 - 12 MHz | |||||||||
| 2.30 | 0.1660 | 1.40 | 1.40 | 0.9999 | 0.9999 | 0.8445 | 0.8445 | 0.1554 | 0.1554 |
| 18.5, 11.5 | 0.1575 | 8.30 | 14.6 | 0.9933 | 0.9793 | 0.0001 | 0.0001 | 0.9999 | 0.9999 |
| 11.0 | 0.3559 | 3.10 | - | 0.9714 | - | 0.2867 | - | 0.7133 | - |
| 0.57 | 0.1660 | 0.34 | 0.34 | 0.9999 | 0.9999 | 0.2804 | 0.0001 | 0.7196 | 0.9999 |
| 0.37 | 0.1524 | 0.24 | 0.24 | 0.9999 | 0.9999 | 0.0028 | 0.0028 | 0.9972 | 0.9972 |
| 2.50 | 0.1660 | 1.56 | 1.56 | 0.9999 | 0.9999 | 0.0028 | 0.0028 | 0.9972 | 0.9972 |
| Test set 5 - 12 MHz | |||||||||
| 2.60 | 0.1640 | 1.60 | 1.60 | 0.9999 | 0.9999 | 0.8461 | 0.8461 | 0.1539 | 0.1539 |
| 20.0, 12.0 | 0.1574 | 7.90 | 14.0 | 0.9938 | 0.9819 | 0.0001 | 0.0001 | 0.9999 | 0.9999 |
| 11.3 | 0.3646 | 3.10 | - | 0.9698 | - | 0.3064 | - | 0.6935 | - |
| 0.62 | 0.1640 | 0.38 | 0.38 | 0.9999 | 0.9999 | 0.3051 | 0.0001 | 0.6948 | 0.9999 |
| 0.39 | 0.15234 | 0.26 | 0.26 | 0.9999 | 0.9999 | 0.0021 | 0.0021 | 0.9978 | 0.9978 |
| 2.70 | 0.1640 | 1.65 | 1.65 | 0.9999 | 0.9999 | 0.0021 | 0.0021 | 0.9978 | 0.9978 |
| Test set 6 - 12 MHz | |||||||||
| 2.80 | 0.1620 | 1.73 | 1.73 | 0.9999 | 0.9999 | 0.8477 | 0.8477 | 0.1523 | 0.1523 |
| 21.5, 12.5 | 0.1572 | 7.63 | 12.72 | 0.9943 | 0.9843 | 0.0001 | 0.0001 | 0.9999 | 0.9999 |
| 11.7 | 0.3733 | 3.13 | - | 0.9676 | - | 0.3257 | - | 0.6743 | - |
| 0.70 | 0.1620 | 0.43 | 0.43 | 0.9999 | 0.9999 | 0.3293 | 0.0001 | 0.6706 | 0.9999 |
| 0.41 | 0.1523 | 0.27 | 0.27 | 0.9999 | 0.9999 | 0.0016 | 0.0016 | 0.9983 | 0.9983 |
| 2.80 | 0.1620 | 1.73 | 1.73 | 0.9999 | 0.9999 | 0.0016 | 0.0016 | 0.9983 | 0.9983 |
| Test set 7 - 15 MHz | |||||||||
| 3.10 | 0.1600 | 1.94 | 1.94 | 0.9998 | 0.9998 | 0.8493 | 0.8493 | 0.1510 | 0.1510 |
| 23.0, 13.0 | 0.1571 | 7.32 | 11.80 | 0.9948 | 0.9865 | 0.0001 | 0.0002 | 0.9998 | 0.9998 |
| 12.0 | 0.3820 | 3.14 | - | 0.9660 | - | 0.3441 | - | 0.6560 | - |
| 0.73 | 0.1600 | 0.46 | 0.46 | 0.9999 | 0.9999 | 0.3533 | 0.0002 | 0.6466 | 0.9998 |
| 0.43 | 0.1522 | 0.28 | 0.28 | 0.9999 | 0.9999 | 0.0012 | 0.0012 | 0.9988 | 0.9988 |
| 3.00 | 0.1600 | 1.90 | 1.90 | 0.9998 | 0.9998 | 0.0012 | 0.0012 | 0.9988 | 0.9988 |
| Test set 8 - 15 MHz | |||||||||
| 3.40 | 0.1580 | 2.15 | 2.15 | 0.9998 | 0.9998 | 0.8510 | 0.8510 | 0.1491 | 0.1491 |
| 24.5, 13.5 | 0.1569 | 7.01 | 10.83 | 0.9952 | 0.9886 | 0.0003 | 0.0003 | 0.9997 | 0.9997 |
| 12.3 | 0.3906 | 3.15 | - | 0.9643 | - | 0.3622 | - | 0.6377 | - |
| 0.80 | 0.1580 | 0.51 | 0.51 | 0.9999 | 0.9999 | 0.3765 | 0.0003 | 0.6234 | 0.9997 |
| 0.45 | 0.1521 | 0.30 | 0.30 | 0.9999 | 0.9999 | 0.0008 | 0.0008 | 0.9991 | 0.9991 |
| 3.20 | 0.1580 | 2.02 | 2.02 | 0.9998 | 0.9998 | 0.0008 | 0.0008 | 0.9991 | 0.9991 |
| Test set 9 - 15 MHz | |||||||||
| 3.70 | 0.1560 | 2.37 | 2.37 | 0.9998 | 0.9998 | 0.8525 | 0.8525 | 0.1475 | 0.1475 |
| 26.0, 14.0 | 0.1568 | 6.70 | 9.88 | 0.9956 | 0.9905 | 0.0007 | 0.0007 | 0.9993 | 0.9993 |
| 12.7 | 0.3993 | 3.18 | - | 0.9620 | - | 0.3799 | - | 0.6200 | - |
| 0.84 | 0.1560 | 0.54 | 0.54 | 0.9999 | 0.9999 | 0.3994 | 0.0007 | 0.6005 | 0.9993 |
| 0.48 | 0.1520 | 0.32 | 0.32 | 0.9999 | 0.9999 | 0.0005 | 0.0005 | 0.9995 | 0.9995 |
| 3.30 | 0.1560 | 2.12 | 2.12 | 0.9998 | 0.9998 | 0.0005 | 0.0005 | 0.9995 | 0.9995 |
| Test set 10 - 15 MHz | |||||||||
| 4.00 | 0.1540 | 2.60 | 2.60 | 0.9998 | 0.9998 | 0.8539 | 0.8539 | 0.1460 | 0.1460 |
| 27.5, 14.5 | 0.1566 | 6.40 | 8.94 | 0.9960 | 0.9923 | 0.0010 | 0.0010 | 0.9989 | 0.9989 |
| 13.0 | 0.4080 | 3.20 | - | 0.9602 | - | 0.3971 | - | 0.6029 | - |
| 0.90 | 0.1540 | 0.58 | 0.58 | 0.9999 | 0.9999 | 0.4215 | 0.4215 | 0.5785 | 0.9989 |
| 0.50 | 0.1519 | 0.33 | 0.33 | 0.9999 | 0.9999 | 0.0003 | 0.0003 | 0.9997 | 0.9997 |
| 3.50 | 0.1540 | 2.27 | 2.27 | 0.9998 | 0.9998 | 0.0003 | 0.0003 | 0.9997 | 0.9997 |