Journal of Neurology Research, ISSN 1923-2845 print, 1923-2853 online, Open Access
Article copyright, the authors; Journal compilation copyright, J Neurol Res and Elmer Press Inc
Journal website http://www.neurores.org

Original Article

Volume 4, Number 4, August 2014, pages 101-109


The Assessment of Basic Features of Electroencephalography in Metabolic Encephalopathies

Figures

Figure 1.
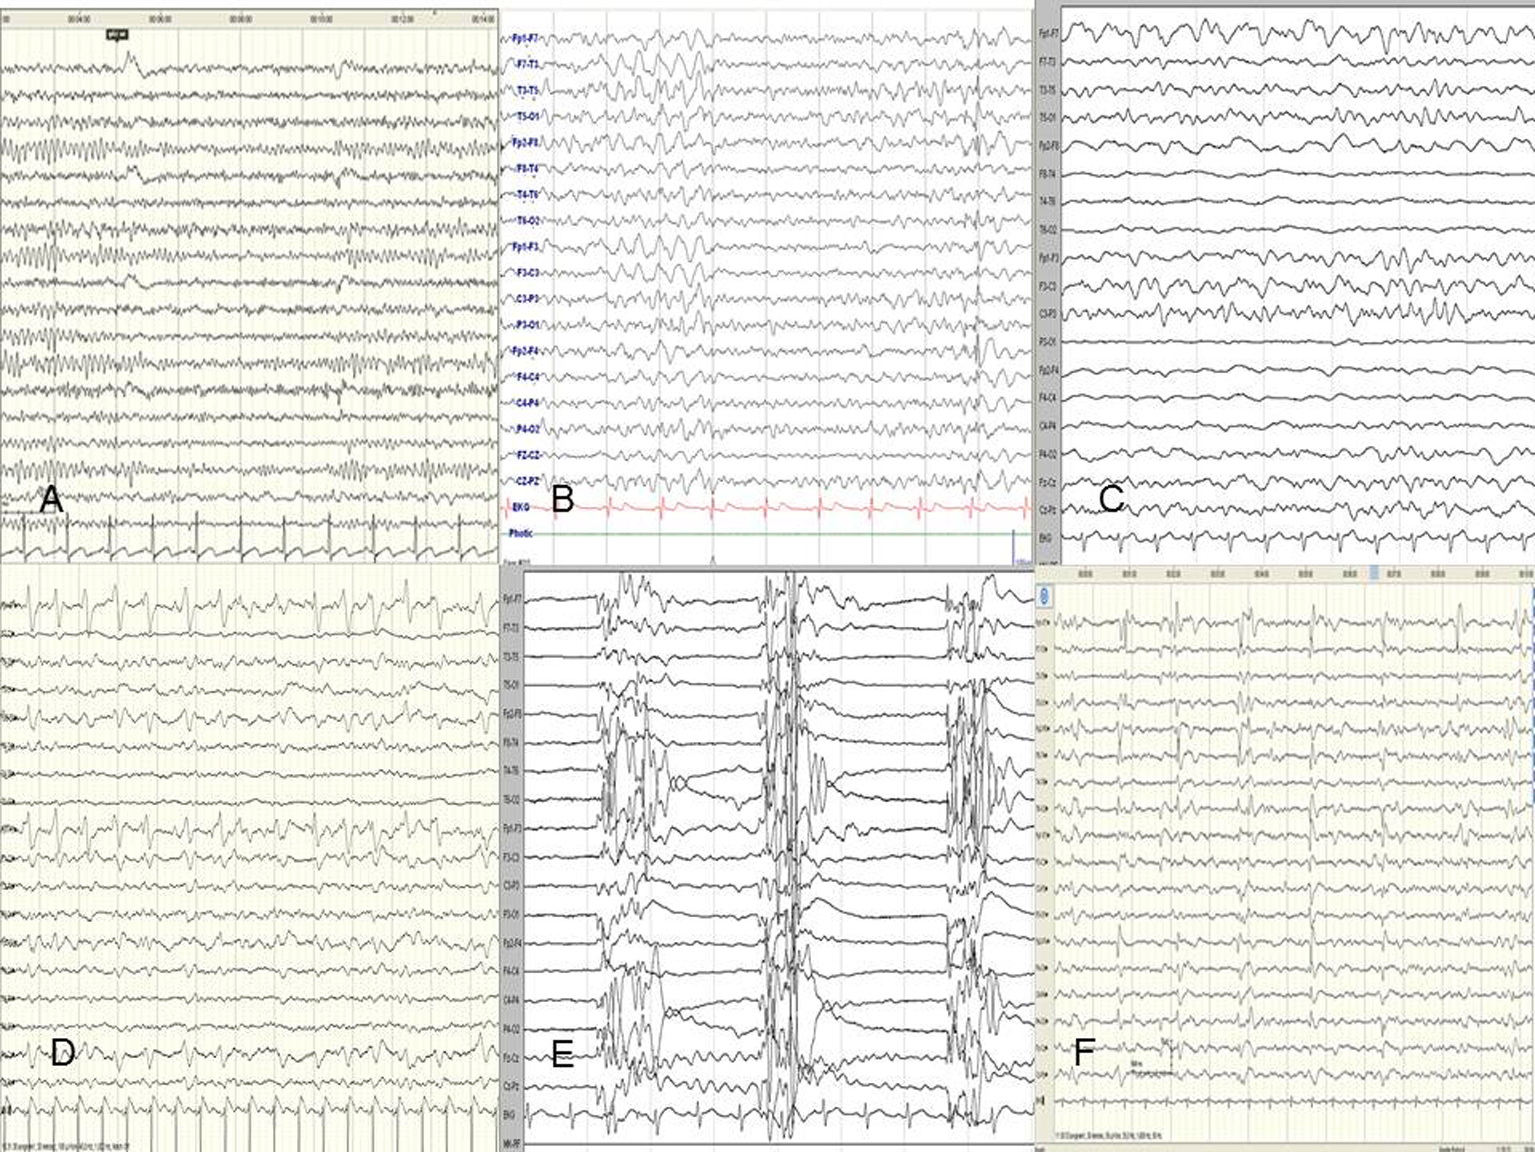
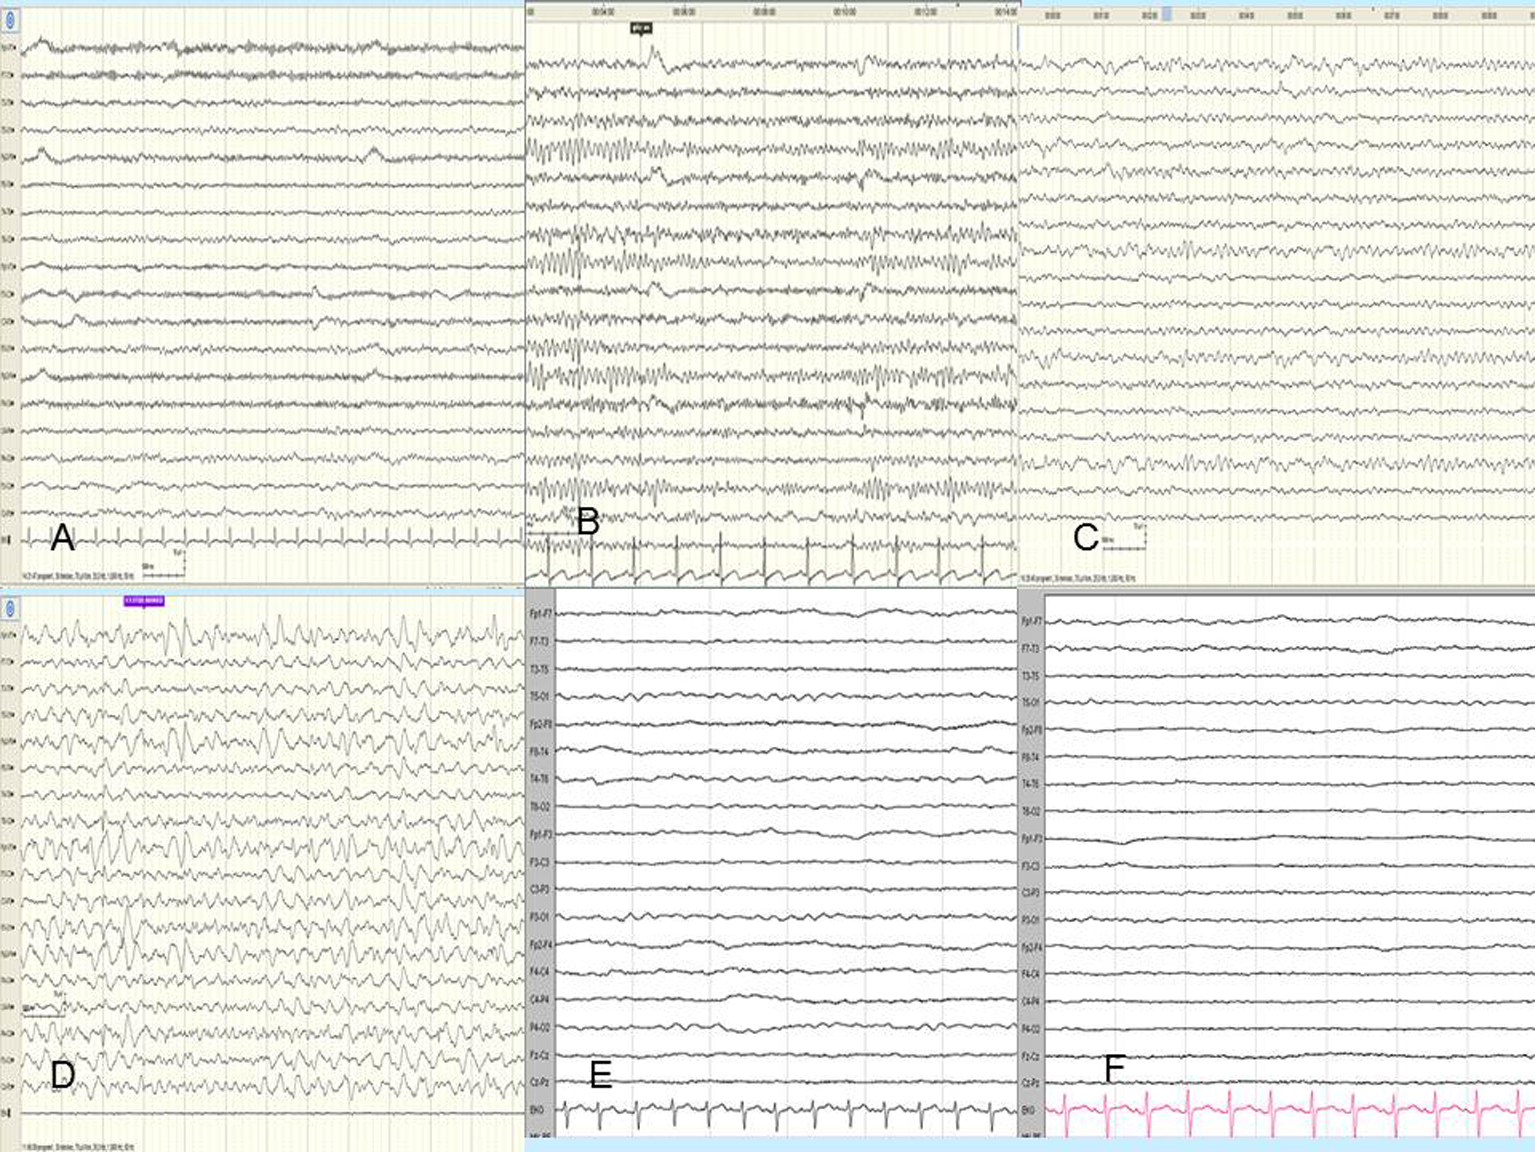
Figure 1. (A) Normal ground rhythm. (B) Decreased alpha activity that reacts to opening and closing of the eye and the recordings with partially increased tetha waves. (C) Recordings that show locally observed alpha activity that does not react to opening and closing of the eye, extensive tetha activity and sometimes brief paroxysms of concomitant delta activity. (D) Ground activity with extensive high-amplitude delta activity. (E) Ground rhythm with low-amplitude delta activity. (F) Isoelectric EEG recording.
Figure 2.
Figure 2. (A) Decrease in alpha frequency. (B) Generalized asynchronous slow waves. (C) Focal slow activities. (D) Triphasic waves. (E) Burst-suppression pattern. (F) Generalized or focal spike-sharp activities.

Tables

Table 1. Demographic Results
 
Diagnostic subgroupsWomanManAge
Data are shown as n (%) and median (minimum-maximum).
Hyponatremia (n = 80)44 (11.4)36 (11.8)68 (21 - 77)
Hypoxic (n = 73)24 (7.8)49 (16)66 (30 - 76)
Renal failure (n = 44)17 (5.6)27 (8.8)58 (23 - 69)
Hepatic insufficiency (n = 36)16 (5.2)20 (6.5)56 (19 - 67)
Diabetes mellitus (n = 25)14 (4.6)11 (3.6)67 (20 - 80)
Endocrinopathy (n = 27)20 (6.5)7 (2.3)54 (19 - 66)
Hypernatremia (n = 21)10 (3.3)11 (3.6)69 (26 - 88)


Table 2. Disease Groups and the Level of Consciousness
 
Diagnostic subgroupsNormalConfusedLethargicStuporComa
Data are shown as n (%).
Hyponatremia (n = 80)8 (2.6)22 (7.2)35 (11.4)12 (3.9)3 (1)
Hypoxic (n = 73)0 (0)31 (10.1)20 (6.5)11 (3.6)11 (3.6)
Renal failure (n = 44)14 (4.6)13 (4.2)9 (2.9)6 (2)2 (0.7)
Hepatic insufficiency (n = 36)0 (0)3 (1)3 (1)16 (5.2)14 (4.6)
Diabetes mellitus (n = 25)4 (1.3)11 (3.6)4 (1.3)2 (0.7)4 (1.3)
Endocrinopathy (n = 27)4 (1.3)10 (3.3)4 (1.3)5 (1.6)4 (1.3)
Hypernatremia (n = 21)0 (0)10 (3.3)5 (1.6)4 (1.3)2 (0.7)


Table 3. Disease Groups and EEG Findings, According to the Basic Activity
 
Diagnostic subgroupsStage 1Stage 2Stage 3Stage 4Stage 5Stage 6
Data are shown as n (%).
Hyponatremia (n = 80)6 (2)11 (3.6)31 (10.1)10 (3.3)3 (1)1 (0.3)
Hypoxic (n = 73)5 (1.6)23 (7.5)13 (4.2)9 (2.9)4 (1.3)4 (1.3)
Renal failure (n = 44)5 (1.6)20 (6.5)10 (3.3)8 (2.6)1 (0.3)0 (0)
Hepatic insufficiency (n = 36)0 (0)1 (0.3)4 (1.3)20 (6.5)5 (1.6)6 (2)
Diabetes mellitus (n = 25)0 (0)24 (7.8)0 (0)3 (1)0 (0)0 (0)
Endocrinopathy (n = 27)0 (0)10 (3.3)3 (1)6 (2)2 (0.7)0 (0)
Hypernatremia (n = 21)0 (0)10 (3.3)4 (1.3)6 (2)1 (0.3)0 (0)


Table 4. Disease Groups and the EEG Was Abnormal According to Patterns
 
Diagnostic subgroupsAlpha reductionGeneralizedasynchronousslow waveactivityFocal slowactivityTrifazik waveBurst-suppressionpatternFokal yada Jen. Keskin
Data are shown as n (%).
Hyponatremia (n = 80)24 (7.8)32 (10.5)14 (4.6)1 (0.3)01 (0.3)
Hypoxic (n = 73)33 (10.7)30 (9.8)6 (2)1 (0.3)3 (1)0 (0)
Renal failure (n = 44)26 (8.5)16 (5.2)2 (0.7)0 (0)00 (0)
Hepatic insufficiency (n = 36)5 (1.6)9 (2.9)3 (1)16 (5.2)03 (1)
Diabetes mellitus(n = 25)0 (0)9 (2.9)6 (2)0 (0)01 (0.3)
Endocrinopathy (n = 27)3 (1)15 (4.9)0 (0)1 (0.3)01 (0.3)
Hypernatremia (n = 21)1 (0.3)10 (3.3)6 (2)1 (0.3)02 (0.7)


Table 5. Prognosis and Abnormal EEG Patterns
 
PrognosisAlpha reductionGeneralized asynchronous slow wave activityFocal slow activityTrifazik waveBurst-suppressionpatternFokal yada Jen. Keskin
Data are shown as n (%).
Düzelme/improvement92 (30)120 (39.2)36 (11.8)7 (2.3)07 (2.3)
Exitus/exitus0 (0)1 (0.3)1 (0.3)6 (2 )3 (1)1 (0.39)


Table 6. Prognosis and EEG Investigations, According to the Basic Activity
 
PrognosisStage 1Stage 2Stage 3Stage 4Stage 5Stage 6
Data are shown as n (%).
Improvement16 (5.2)99 (32.4)64 (20.9)60 (19.6)11 (3.6)7 (2.3)
Exitus0 (0)0 (0)1 (0.3)2 (0.7)5 (1.6)4 (1.3)