Figures
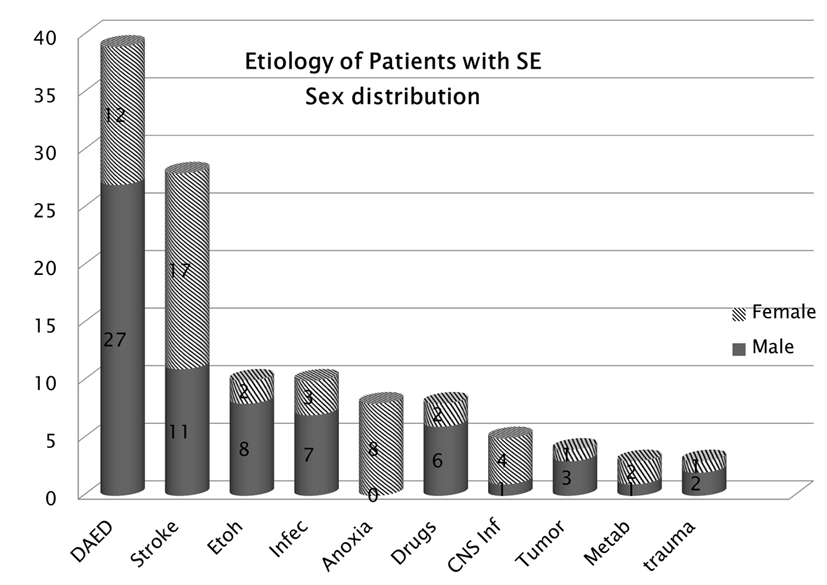
Figure 1. Etiology of SE according to sex.Strokes were the most common cause of SE in females while noncompliance was common in males.
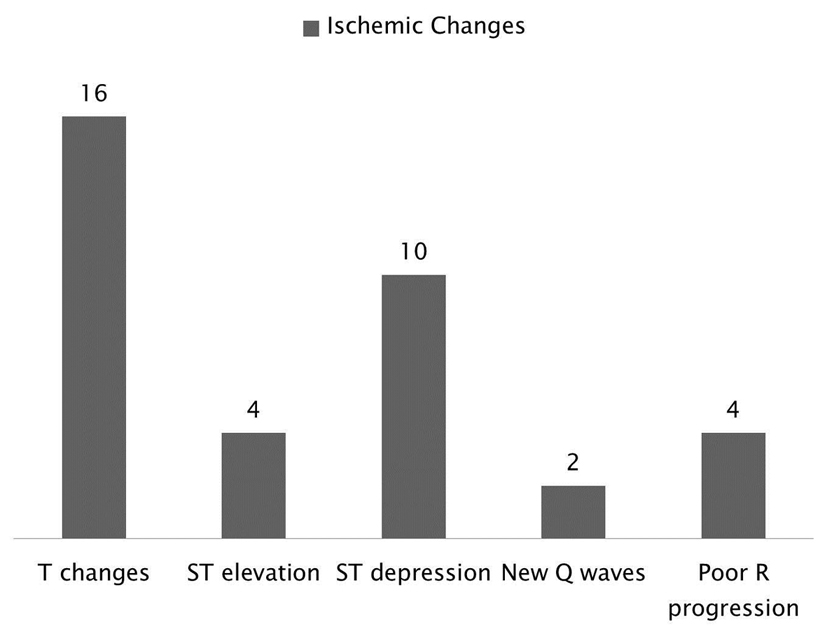
Figure 2. Breakdown of the ischemic changes following SE and it shows that the most common changes were T changes followed by ST depression.
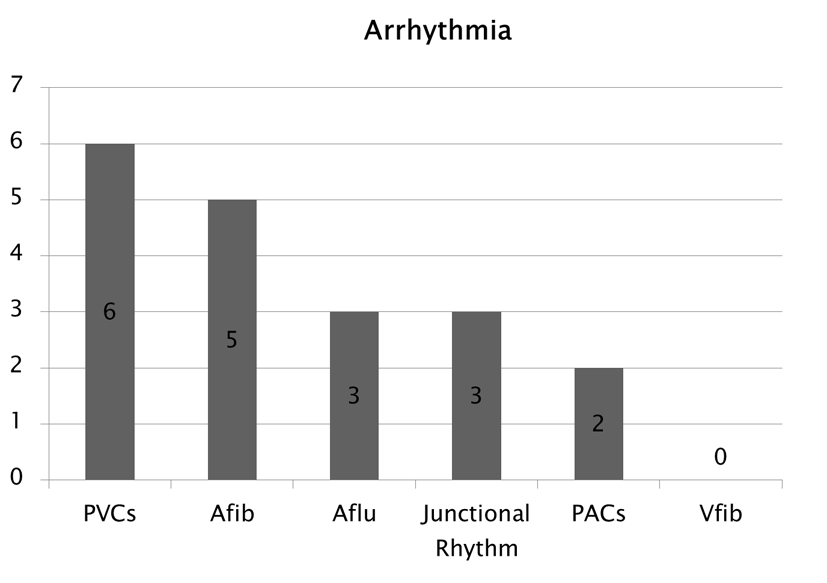
Figure 3. Type of arrhythmias observed following SE.
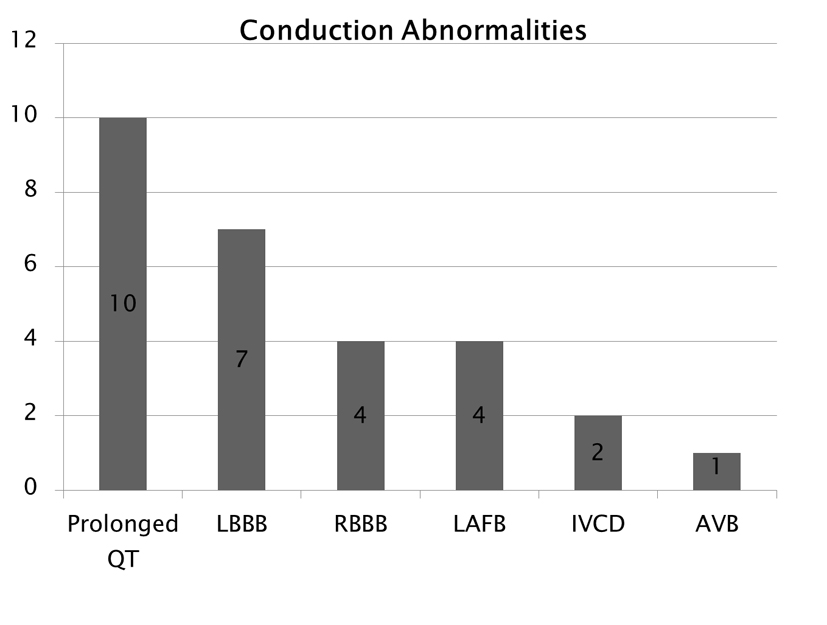
Figure 4. Conduction abnormalities. Note that prolonged QT was the cost common abnormality which can also be associated with phenytoin side effect.
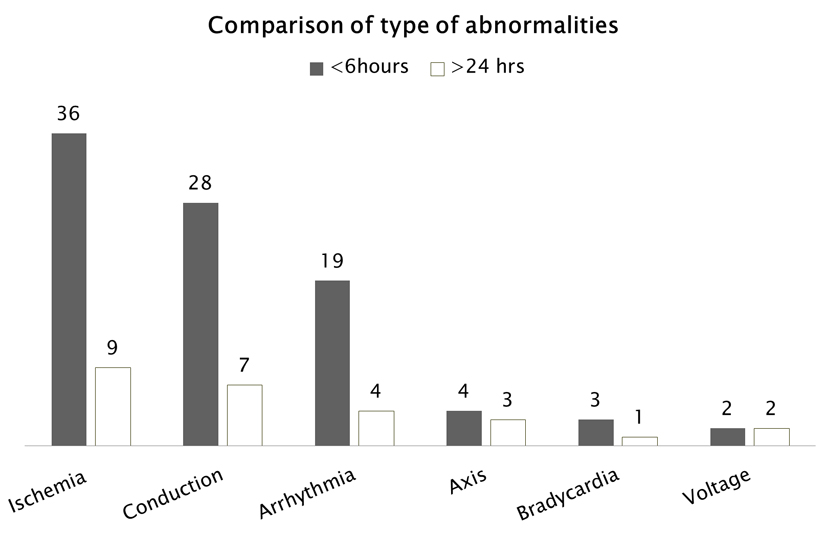
Figure 5. ECG abnormalities occurring during SE (within 6 h) and more than 24 h after SE.
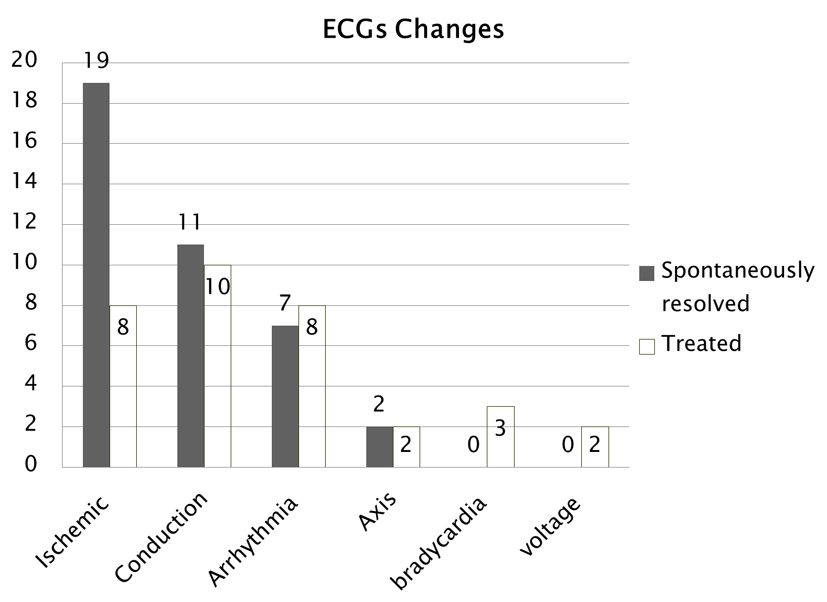
Figure 6. Comparison of ECG changes that occurred and either resolved spontaneously or needed treatment.
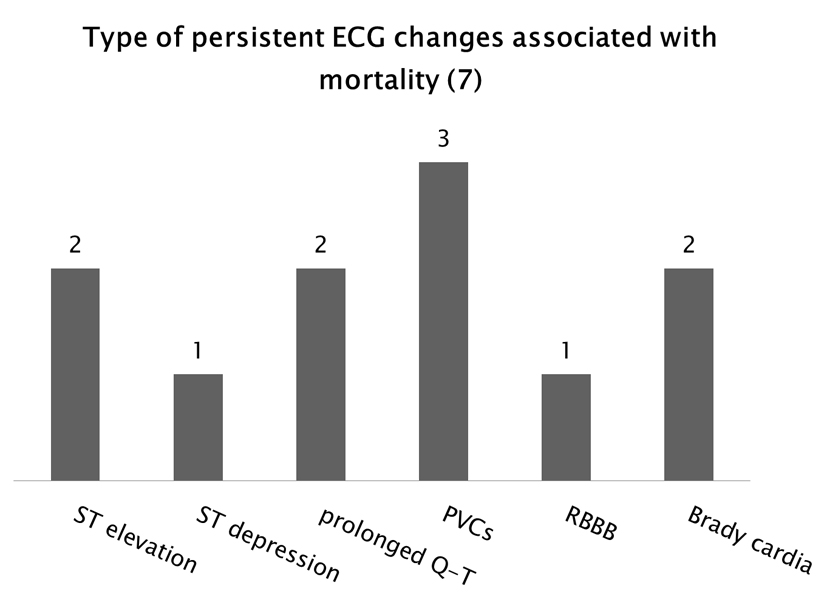
Figure 7. Types of persistent ECG abnormalities associated with mortality. There were seven patients with persistent ECG abnormalities who died. Some of these patients experienced more than one type of abnormality.
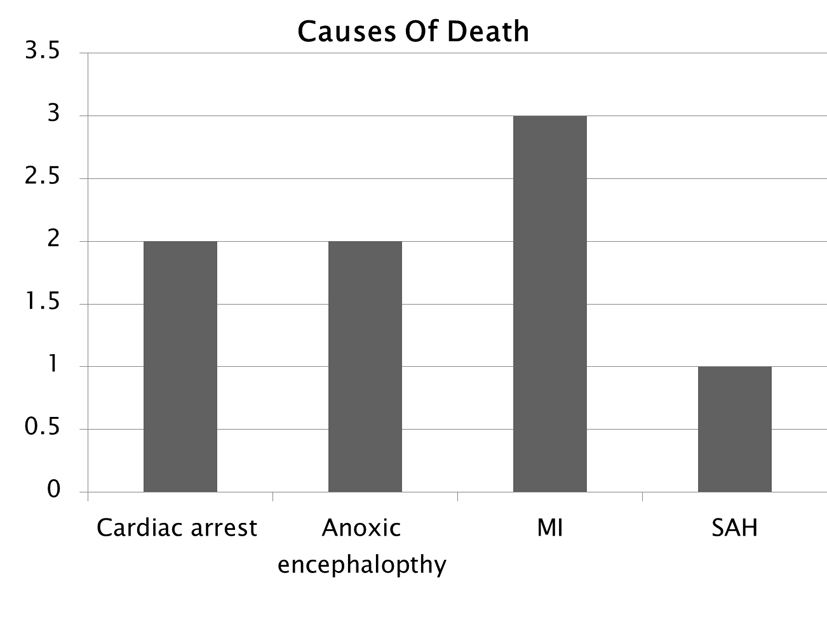
Figure 8. Determined cause of death.
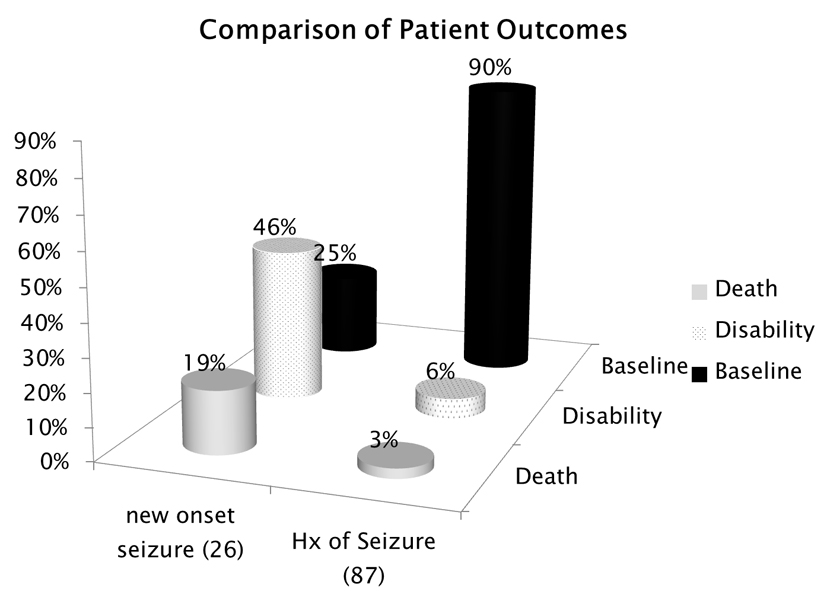
Figure 9. Patient outcomes comparing those with new onset epilepsy to those patients who had a history of epilepsy.
Table
Table 1. In a Review of the Literature, One Other Study by Boggs et al in 1993, Has Documented ECG Changes in a Series of 60 Patients. There Is a Striking Similarity to the Types of Changes Noted in These Studies, Particularly With Ischemic Changes and Arrhythmia.
| EKG abn | Our study (N = 113) | Boggs et al (1993) MCV (N = 60) |
|---|
| Ischemia | 39% | 40% |
| Conduction | 30% | 15% |
| Arrhythmia | 21% | 20% |
| Axis | 4% | 20% |
| Bradycardia | 3% | 3% |
| Voltage | 2% | 3% |