Figures
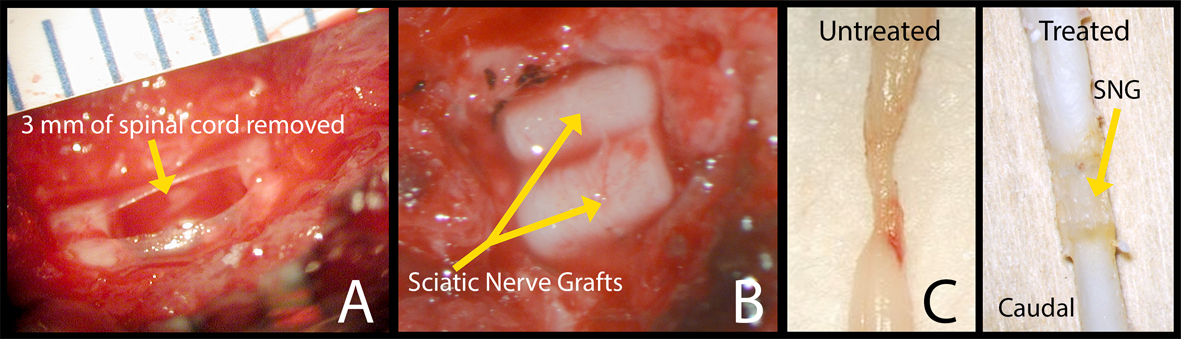
Figure 1. Surgery photos showing (A) 3 mm of spinal cord removed at the T10 level and (B) 2 pre-degenerated PNGs placed in the spinal canal. (C) Pictures of harvested spinal cords, left side: control and right side: a rat that was treated with an OPF tube releasing ChABC, at 8 weeks.
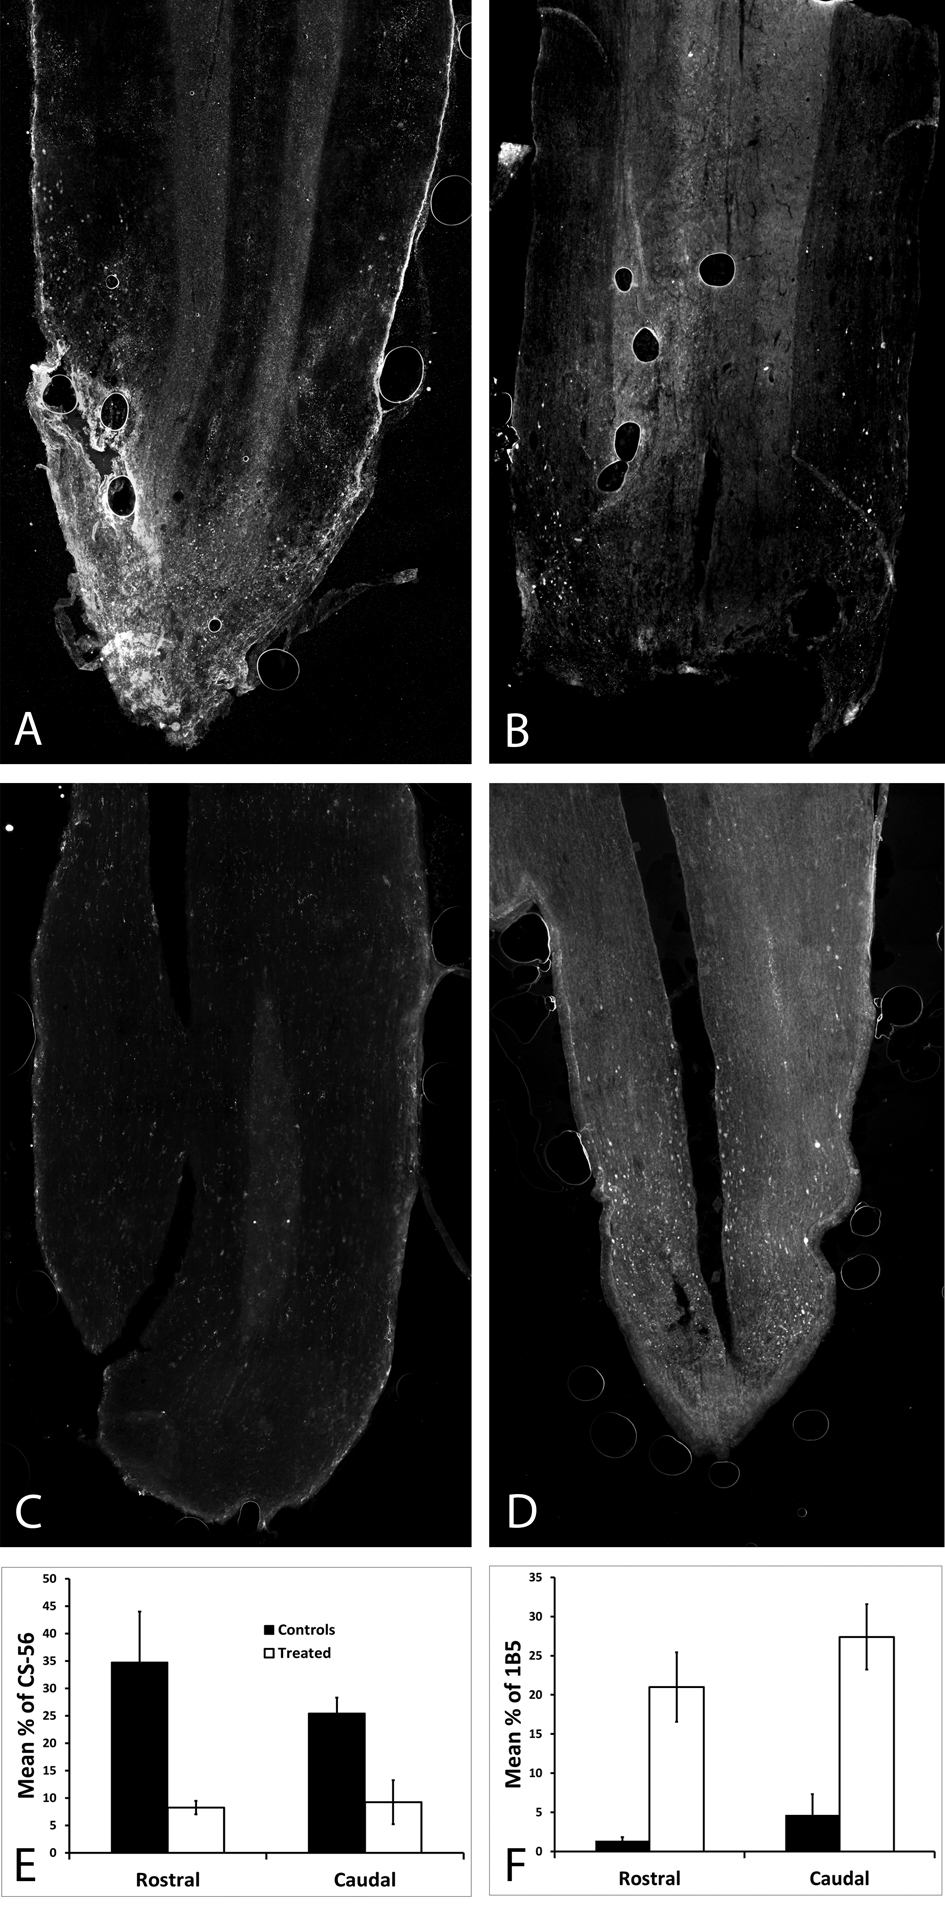
Figure 2. In order to check that ChABC was being released in vivo, full length and broken down CSPGs were labeled on horizontal spinal cord sections harvested 4 weeks post-operatively. (A) CSPGs were abundant in an untreated spinal cord, as opposed to (B) almost none being viewed in the treated spinal cord; both were stained with CS-56. (C) There were no broken down CSPSs in the untreated spinal cord, as opposed to (D) the treated spinal cord which had a significant amount of broken down CSPGs (p < 0.05), both were stained with 1B5. (E) The percent area stained for CS-56 was significantly higher both rostral and caudal in the untreated spinal cord (p < 0.05). (F) The percent area stained for 1B5 was significantly higher both rostral and caudal in the ChABC treated spinal cord.
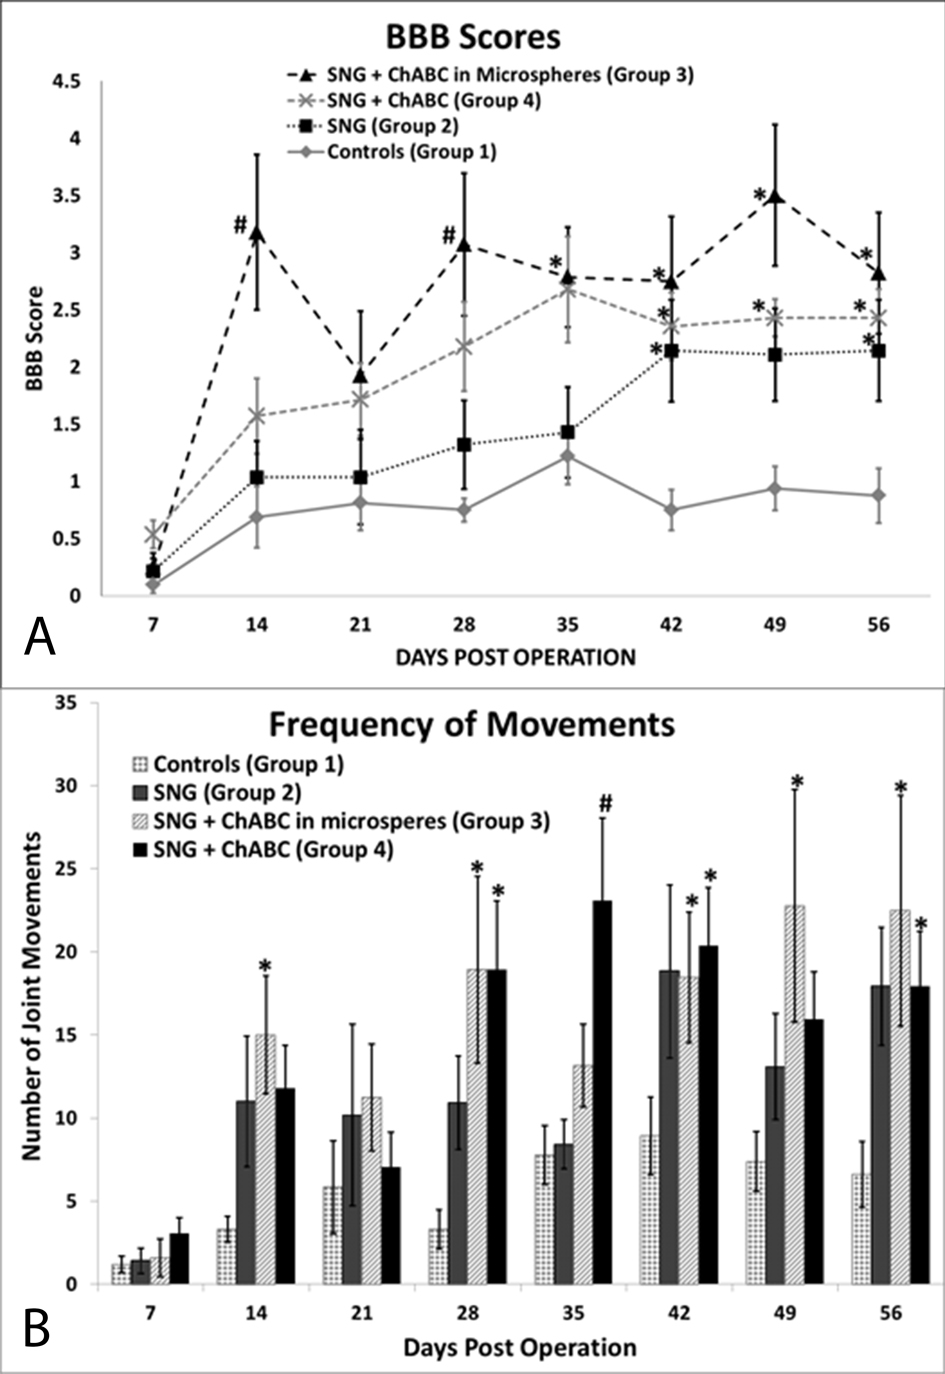
Figure 3. Functional recovery assessment results. (A) Hindlimb locomotor BBB scores show that all groups treated with PNGs did significantly better than controls, (B) ChABC treated groups moved their hindlimbs significantly more than controls on day 56. *Denotes P <0.05 compared to control, #denotes P < 0.05 compared to control and to PNG only group, error bars represent ± SEM.
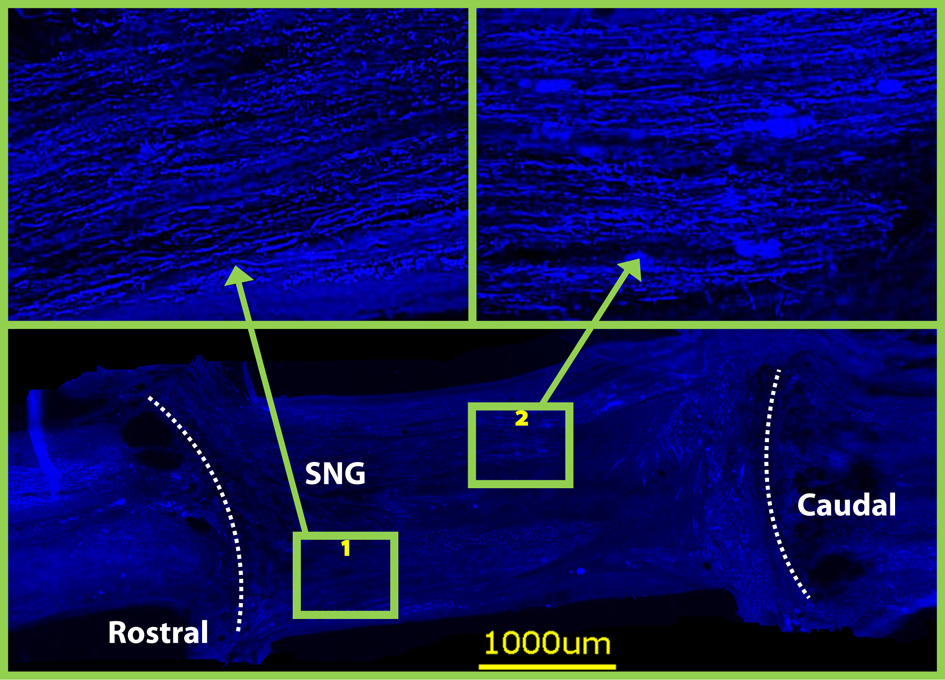
Figure 4. Neurofilament staining on horizontal sections at 8 weeks revealed that both grafts were densely populated with axons. Dotted lines indicate graft spinal cord interface.
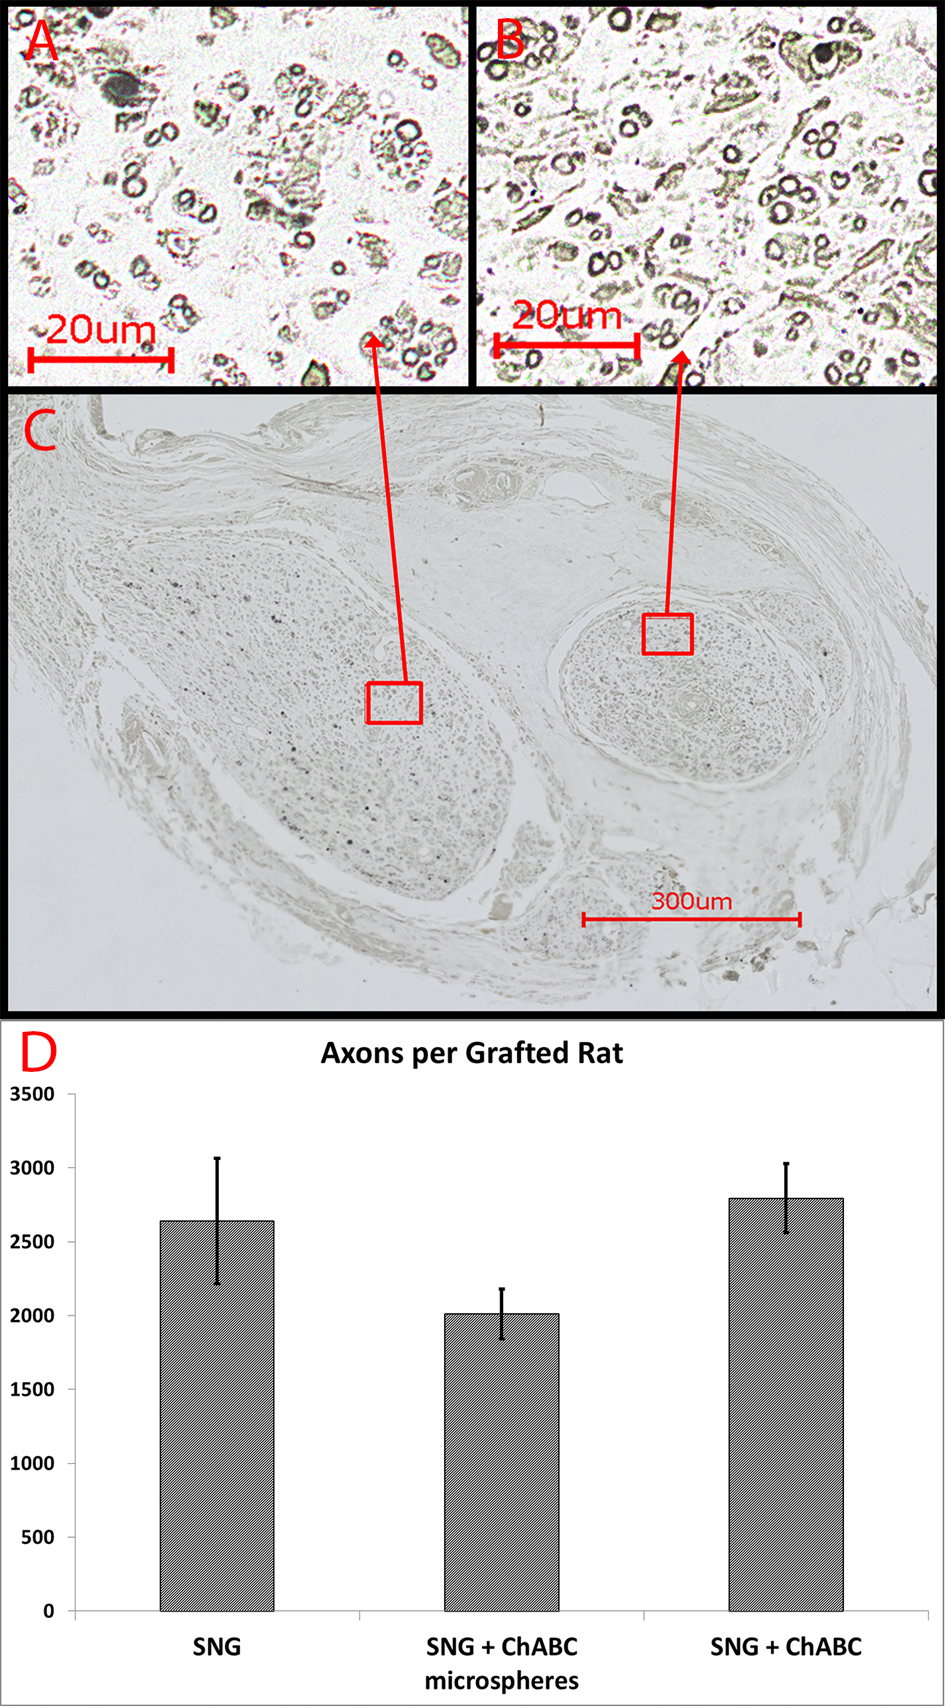
Figure 5. (A-B) Myelin staining with osmium tetroxide revealed numerous heavily myelinated axons of small and large caliber that regenerated into both PNGs, shown on a transverse section (C) through the midpoint of the PNGs at eight weeks. (D) Number of heavily mylinated axons in the PNGs (n = 4 from each group). Error Bars Represent ± SEM.
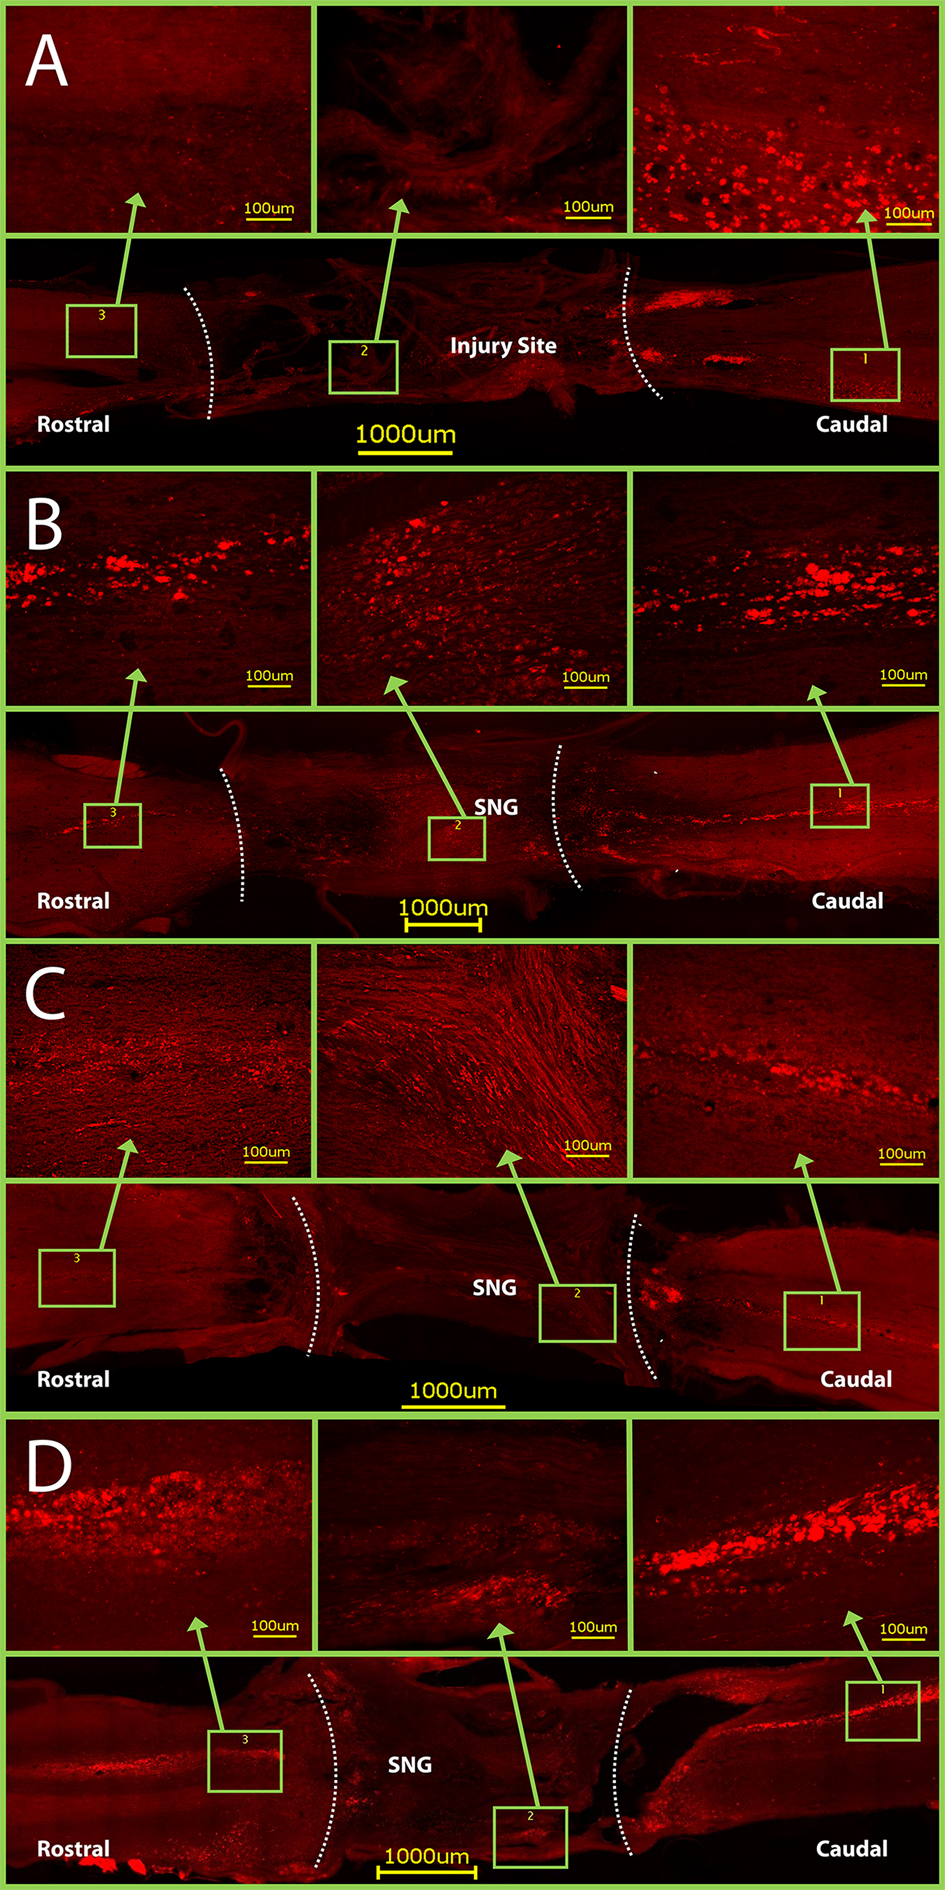
Figure 6. CTB staining in horizontal sections of spinal cords. Dotted lines indicate graft- spinal cord interface. (A) Control rats have CTB staining only caudal to the injury site. Conversely, CTB crossed through the PNGs and into the rostral spinal cord in groups with: (B) only a PNG, (C) a PNG with OPF tubes releasing ChABC from microspheres, and (D) a PNG with just an OPF tube releasing ChABC. Note: the graft- spinal cord interface on the caudal side of Figure D was torn slightly during spinal cord harvest.
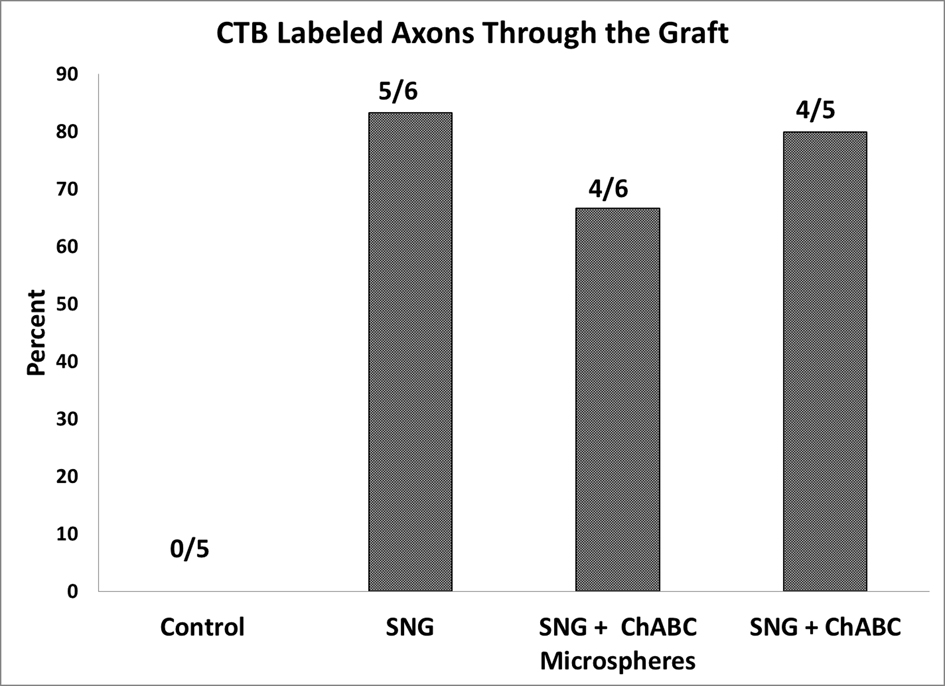
Figure 7. Quantification of rats that have positive CTB labeled axons on the rostral side of the PNGs. All 22 rats listed had positive CTB staining caudal to the PNGs.