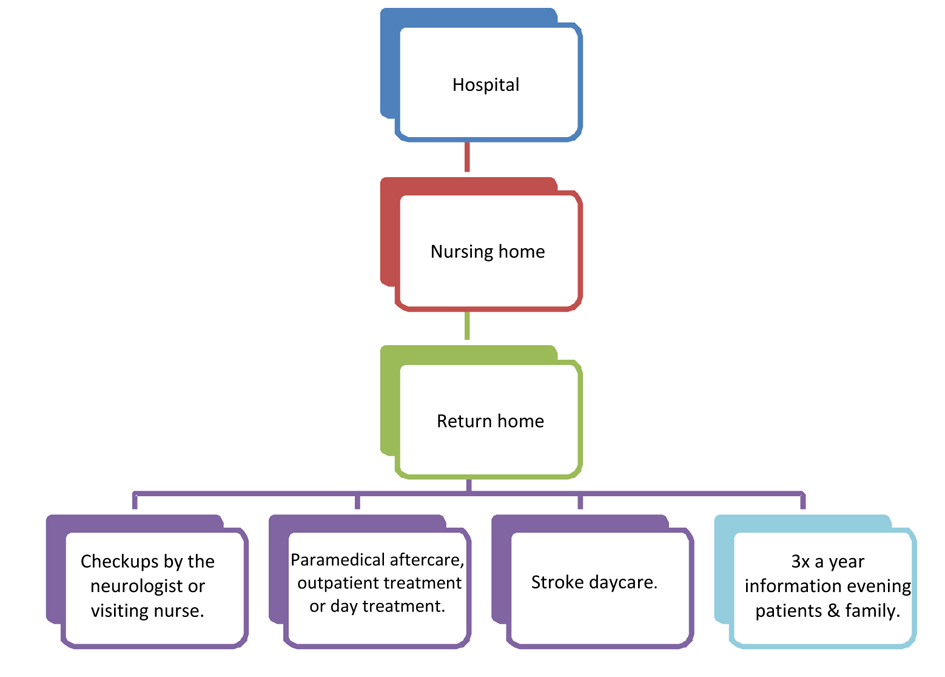
Figure 1. The conventional follow-up care (ORP).
| Journal of Neurology Research, ISSN 1923-2845 print, 1923-2853 online, Open Access |
| Article copyright, the authors; Journal compilation copyright, J Neurol Res and Elmer Press Inc |
| Journal website http://www.neurores.org |
Original Article
Volume 3, Number 1, February 2013, pages 20-33
Daily Functioning and Quality of Life of Patients One Year Post Stroke: A Comparison of Two Different Follow-Up Care Programmes
Figures
Tables
| Variables | ATC (%) | ORP (%) | P* |
|---|---|---|---|
| * Fisher’s exact test. | |||
| Patients included | 45 | 48 | |
| Gender | |||
| Men | 22 (49) | 17 (35) | |
| Women | 23 (51) | 31 (65) | |
| Age, average (range) | 78 (61 - 92) | 77 (60 - 89) | |
| Living situation | |||
| Living alone | 21 (47) | 30 (62.5) | |
| Living with a partner | 24 (53) | 18 (37.5) | |
| Brain hemisphere | 0.351 | ||
| Left side | 19 (42) | 27 (56) | |
| Right side | 22 (49) | 21 (44) | |
| Unknown | 4 (9) | - | |
| NIHSS, average (range) | 5 (0 - 23) | 5 (0 - 22) | 0.522 |
| Risk factors present before stroke | |||
| No risk factors | 7 (16) | 3 (6) | 0.189 |
| Hypertension | 24 (53) | 17 (43) | 0.082 |
| Hypercholesterolemia | 9 (20) | 7 (14) | 0.489 |
| Diabetes | 5 (11) | 8 (20) | 0.440 |
| Cardiac embolus | 11 (24) | 12 (22) | 0.951 |
| Smoking | 10 (22) | - | |
| History | |||
| No history | 7 (16) | 3 (6) | 0.189 |
| Ischemic heart disease | 13 (29) | 7 (15) | 0.093 |
| Stroke/TIA | 12 (27) | 14 (29) | 0.788 |
| Atrial fibrillation | 7 (16) | 12 (25) | 0.259 |
| Heart failure | 2 (4) | 4 (8) | 0.678 |
| COPD | 4 (11) | 9 (19) | 0.303 |
| Depression | 4 (9) | 2 (4) | 0.425 |
| Variables | ATC group | ORP group | |||||
|---|---|---|---|---|---|---|---|
| N | Median (range) | P* | N | Median (range) | P* | P# | |
| * Kruskall-Wallis1 and Mann-Whitney2 test, # Interaction rank transform ANOVA. | |||||||
| Gender2 | |||||||
| Male | 22 | 20 (8 - 21) | 0.467 | 17 | 19 (2 - 21) | 0.018 | 0.434 |
| Female | 23 | 20.5 (7 - 21) | 31 | 21 (17 - 21) | |||
| Social situation2 | |||||||
| Living alone | 21 | 20 (8 - 21) | 0.820 | 18 | 20 (2 - 21) | 0.834 | 0.619 |
| Living with partner | 24 | 20.5 (7 - 21) | 30 | 20 (16 - 21) | |||
| Stroke location2 | |||||||
| Left side | 19 | 21 (8 - 21) | 0.075 | 27 | 20 (11 - 21) | 0.282 | 0.300 |
| Right side | 22 | 19 (7 - 21) | 21 | 20 (2 - 21) | |||
| Housekeeping1 | |||||||
| More | 0.000 | 0.014 | 0.619 | ||||
| As much as before | 16 | 21 (18 - 21) | 15 | 21 (17 - 21) | |||
| Less | 19 | 19 (16 - 21) | 26 | 20 (13 - 21) | |||
| Quit | 10 | 17.5 (7 - 21) | 7 | 17 (2 - 20) | |||
| Physical activity1 | |||||||
| More | . | . | 0.012 | 0.014 | 0.407 | ||
| As much as before | 16 | 21 (18 - 21) | 17 | 21 (13 - 21) | |||
| Less | 25 | 19 (15 - 21) | 26 | 19 (11 - 21) | |||
| Quit | 4 | 8 (7 - 21) | 5 | 17 (2 - 20) | |||
| Hobbies1 | |||||||
| More | 1 | 0.014 | 0.043 | 0.051 | |||
| As much as before | 21 | 21 (16 - 21) | 21 | 21 (13 - 21) | |||
| Less | 18 | 20 (8 - 21) | 16 | 19.5 (16 - 21) | |||
| Quit | 5 | 17 (7 - 19) | 11 | 20 (2 - 20) | |||
| Visiting1 | |||||||
| More | 0.000 | ||||||
| As much as before | 20 | 21 (18 - 21) | 31 | 20 (13 - 21) | 0.214 | 0.551 | |
| Less | 19 | 20 (16 - 21) | 16 | 20 (11 - 21) | |||
| Quit | 6 | 11.5 (7 - 19) | 1 | 2 | |||
| Experienced quality of life2 | |||||||
| The same | 22 | 21 (8 - 21) | 0.079 | 21 | 19 (13 - 21) | 0.367 | 0.331 |
| Diminished | 22 | 19 (7 - 21) | 27 | 20 (2 - 21) | |||
| GP contact2 | |||||||
| No | 3 | 21 (19 - 21) | 0.364 | ||||
| Yes | 42 | 20 (7 - 21) | |||||
| > 10 times | 26 | 20 (2 - 21) | 0.864 | ||||
| < 10 times | 22 | 20 (11 - 21) | |||||
| Neurologist contact2 | |||||||
| No | 11 | 20 (17 -21) | 0.972 | 5 | 19 (13 - 21) | 0.719 | |
| Yes | 26 | 20.5 (8 - 21) | 43 | 20 (2 - 21) | |||
| Physiotherapy2 | |||||||
| No | 13 | 21 (15 - 21) | 0.070 | 34 | 20 (2 - 21) | 0.136 | 0.264 |
| Yes | 32 | 19 (7 - 21) | 14 | 18.5 (11 - 21) | |||
| Speech therapy2 | |||||||
| No | 31 | 19 (7 - 21) | 0.216 | 32 | 20 (2 - 21) | 0.320 | 0.698 |
| Yes | 14 | 21 (8 - 21) | 16 | 20 (16 - 21) | |||
| Occupational2 therapy | |||||||
| No | 28 | 21 (7 - 21) | 0.105 | 34 | 20 (13 - 21) | 0.127 | 0.160 |
| Yes | 17 | 19 (8 - 21) | 14 | 19 (2 - 21) | |||
| District nursing services2/3 | |||||||
| No | 29 | 21 (8 - 21) | 0.000 | 24 | 20 (2 - 21) | 0.470 | |
| Yes | 19 | 20 (11 - 21) | |||||
| More | 15 | 18 (7 - 21) | |||||
| Less | 5 | 21 (18 - 21) | |||||
| Local Authority home help2 | |||||||
| No | 19 | 19 (7 - 21) | 0.766 | 18 | 20 (16 - 21) | 0.374 | 0.780 |
| Yes | 25 | 20 (8 - 21) | 30 | 20 (2 - 21) | |||
| Day center2 | |||||||
| No | 33 | 21 (7 - 21) | 0.103 | 43 | 20 (2 - 21) | 0.222 | 0.425 |
| Yes | 12 | 19 (8 - 21) | 5 | 20 (17 - 21) | |||
| Hospital admittance2 | |||||||
| No | 38 | 20 (7 - 21) | 0.780 | 38 | 20 (13 - 21) | 0.496 | 0.316 |
| Yes | 7 | 19 (17 -21) | 10 | 19.5 (2 - 21) | |||
| Rand-36 | ATC | ORP | P* |
|---|---|---|---|
| Median (range) | Median (range) | ||
| *Mann-Whitney test. | |||
| Physical functioning | 45 (0 - 95) | 55 (0 - 95) | 0.301 |
| Social functioning | 87.5 (25 - 100) | 100 (0 - 100) | 0.836 |
| Role limitations - physical | 50 (0 - 100) | 25 (0 - 100) | 0.012 |
| Role limitations - emotional | 100 (33.3 - 100) | 100 (0 - 100) | 0.552 |
| Mental Health | 82 (12 - 100) | 76 (24 - 100) | 0.086 |
| Vitality | 65 (0 - 100) | 65 (20 - 100) | 0.727 |
| Bodily Pain | 100 (34.7 - 100) | 100 (10.2 - 100) | 0.673 |
| General Health | 65 (15 - 100) | 50 (5 - 100) | 0.042 |
| Variables | FF | P | SF | P | RLf | P | RLe | P | MH | P | Vit | P | BP | P | GH | P |
|---|---|---|---|---|---|---|---|---|---|---|---|---|---|---|---|---|
| Results of the Kruskal-Wallis1 or Mann-Whitney2 test. FF: median physical functioning, SF: median social functioning, RLf: median role limitations - physical, RLe: median role limitations - emotional, MH: median mental health, Vit: median vitality, BP: median bodily pain, GH: median general health. | ||||||||||||||||
| House-Keeping1 | ||||||||||||||||
| As much | 77.5 | < 0.001 | 75 | 0.244 | 75 | 0.071 | 100 | 0.421 | 78 | 0.704 | 75 | 0.593 | 100 | 0.102 | 70 | 0.939 |
| Less | 45 | 100 | 50 | 100 | 84 | 65 | 89.8 | 65 | ||||||||
| Quit | 10 | 75 | 25 | 100 | 84 | 60 | 94.9 | 65 | ||||||||
| Physical activity1 | ||||||||||||||||
| As much | 72.5 | < 0.001 | 100 | 0.120 | 87.5 | 0.006 | 100 | 0.808 | 84 | 0.615 | 67.5 | 0.037 | 100 | 0.014 | 75 | 0.075 |
| Less | 35 | 81.3 | 37.5 | 100 | 82 | 67.5 | 89.8 | 65 | ||||||||
| Quit | 2.5 | 62.5 | 25 | 100 | 62 | 32.5 | 100 | 32.5 | ||||||||
| Hobbies1 | ||||||||||||||||
| As much | 70 | 0.003 | 100 | 0.005 | 75 | 0.069 | 100 | 0.258 | 80 | 0.312 | 70 | 0.072 | 100 | 0.724 | 70 | 0.006 |
| Less | 45 | 75 | 50 | 100 | 86 | 60 | 94.9 | 55 | ||||||||
| Quit | 20 | 62.5 | 25 | 100 | 76 | 50 | 100 | 40 | ||||||||
| Visiting1 | ||||||||||||||||
| As much | 70 | < 0.001 | 100 | 0.220 | 75 | 0.011 | 100 | 0.782 | 84 | 0.890 | 70 | 0.245 | 100 | 0.864 | 70 | 0.168 |
| Less | 45 | 75 | 50 | 100 | 80 | 65 | 100 | 65 | ||||||||
| Quit | 7.5 | 75 | 0 | 100 | 80 | 60 | 100 | 45 | ||||||||
| Day center2 | ||||||||||||||||
| Yes | 40 | 0.246 | 75 | 0.436 | 50 | 0.568 | 100 | 0.601 | 84 | 0.643 | 60 | 0.558 | 100 | 0.877 | 60 | 0.558 |
| No | 55 | 100 | 50 | 100 | 80 | 70 | 100 | 70 | ||||||||
| Variables | FF | P | SF | P | RLf | P | RLe | P | MH | P | Vit | P | BP | P | GH | P |
|---|---|---|---|---|---|---|---|---|---|---|---|---|---|---|---|---|
| Results of the Kruskal-Wallis1 or Mann-Whitney2 test. FF: median physical functioning, SF: median social functioning, RLf: median role limitations - physical, RLe: median role limitations - emotional, MH: median mental health, Vit: median vitality, BP: median bodily pain, GH: median general health. | ||||||||||||||||
| House-Keeping1 | ||||||||||||||||
| As much | 60 | 0.001 | 87.5 | 0.557 | 25 | 0.660 | 100 | 0.798 | 84 | 0.300 | 70 | 0.164 | 100 | 0.742 | 65 | 0.106 |
| Less | 60 | 100 | 25 | 100 | 76 | 60 | 88.8 | 45 | ||||||||
| Quit | 20 | 75 | 25 | 100 | 72 | 55 | 77.6 | 40 | ||||||||
| Physical activity1 | ||||||||||||||||
| As much | 70 | 0.045 | 100 | 0.009 | 50 | 0.008 | 100 | 0.153 | 80 | 0.104 | 70 | 0.179 | 100 | 0.352 | 65 | 0.208 |
| Less | 52.5 | 75 | 25 | 100 | 72 | 60 | 88.8 | 42.5 | ||||||||
| Quit | 25 | 75 | 25 | 100 | 72 | 65 | 100 | 50 | ||||||||
| Hobbies1 | ||||||||||||||||
| As much | 60 | 0.124 | 100 | 0.155 | 75 | 0.006 | 100 | 0.904 | 80 | 0.035 | 70 | 0.324 | 100 | 0.944 | 65 | 0.274 |
| Less | 60 | 87.5 | 50 | 100 | 76 | 65 | 100 | 50 | ||||||||
| Quit | 35 | 75 | 25 | 100 | 72 | 45 | 100 | 40 | ||||||||
| Visiting1 | ||||||||||||||||
| As much | 55 | 0.066 | 100 | <0.001 | 25 | <0.001 | 100 | 0.707 | 76 | 0.559 | 70 | 0.045 | 79.6 | 0.355 | 65 | 0.222 |
| Less | 42.5 | 62.5 | 0 | 100 | 74 | 60 | 100 | 45 | ||||||||
| Quit | 0 | 12.5 | 0 | 100 | 72 | 25 | 100 | 20 | ||||||||
| Day center2 | ||||||||||||||||
| Yes | 50 | 0.648 | 62.5 | 0.019 | 0 | 0.036 | 100 | 0.529 | 64 | 0.099 | 45 | 0.599 | 77.6 | 0.658 | 35 | 0.279 |
| No | 55 | 100 | 25 | 100 | 76 | 65 | 100 | 50 | ||||||||
| HRQOL | Activities | P# |
|---|---|---|
| #Interaction rank transform ANOVA. | ||
| Physical functioning | Housekeeping | 0.046 |
| Physical activity | 0.128 | |
| Hobbies | 0.164 | |
| Visiting | 0.870 | |
| Day centre | 0.695 | |
| Social functioning | Housekeeping | 0.860 |
| Physical activity | 0.256 | |
| Hobbies | 0.430 | |
| Visiting | 0.063 | |
| Day centre | 0.141 | |
| Role limitations - physical | Housekeeping | 0.701 |
| Physical activity | 0.804 | |
| Hobbies | 0.190 | |
| Visiting | 0.142 | |
| Day centre | 0.154 | |
| Role limitations - emotional | Housekeeping | 0.564 |
| Physical activity | 0.321 | |
| Hobbies | 0.367 | |
| Visiting | 0.892 | |
| Day centre | 0.847 | |
| Mental health | Housekeeping | 0.218 |
| Physical activity | 0.312 | |
| Hobbies | 0.607 | |
| Visiting | 0.808 | |
| Day centre | 0.131 | |
| Vitality | Housekeeping | 0.732 |
| Physical activity | 0.079 | |
| Hobbies | 0.718 | |
| Visiting | 0.412 | |
| Day centre | 0.882 | |
| Bodily pain | Housekeeping | 0.634 |
| Physical activity | 0.289 | |
| Hobbies | 0.847 | |
| Visiting | 0.565 | |
| Day centre | 0.622 | |
| General health | Housekeeping | 0.351 |
| Physical activity | 0.281 | |
| Hobbies | 0.424 | |
| Visiting | 0.834 | |
| Day centre | 0.471 | |
| Daily Occupations | ATC (%) | ORP (%) | P* |
|---|---|---|---|
| * Fisher’s exact test. | |||
| Housekeeping | |||
| The same | 35.6 | 31.3 | 0.459 |
| Less | 42.2 | 54.2 | |
| Quit | 22.2 | 14.6 | |
| Physical exercise | |||
| The same | 35.6 | 35.4 | 1.000 |
| Less | 55.6 | 54.2 | |
| Quit | 8.9 | 10.4 | |
| Hobbies | |||
| More | 2.2 | 0 | 0.328 |
| The same | 46.7 | 43.8 | |
| Less | 40.0 | 33.3 | |
| Quit | 11.1 | 22.9 | |
| Visiting | |||
| The same | 44.4 | 64.6 | 0.041 |
| Less | 42.2 | 33.3 | |
| Quit | 13.3 | 2.1 | |
| Holidays | |||
| The same | 62.2 | 45.8 | 0.047 |
| Less | 17.8 | 10.4 | |
| Quit | 20.0 | 43.8 | |