


| Journal of Neurology Research, ISSN 1923-2845 print, 1923-2853 online, Open Access |
| Article copyright, the authors; Journal compilation copyright, J Neurol Res and Elmer Press Inc |
| Journal website http://www.neurores.org |
Original Article
Volume 7, Number 3, June 2017, pages 25-38
An Enhanced Patient-Specific Computer Model Using an Iterative Multi-Staged Algorithm
Meide Zhaoa, b, Robert Kufahla, Marlyn E. Clarka, †, Sepideh Amin-Hanjania, Victor Aleticha, Ali Alaraja, Xinjian Dua, Fady T. Charbela
aDepartment of Neurosurgery, University of Illinois at Chicago, IL, USA
†Deceased.
bCorresponding Author: Meide Zhao, Department of Neurosurgery, University of Illinois at Chicago, 912 South Wood Street (MC 799), Chicago, IL 60612, USA
Manuscript accepted for publication April 20, 2017
Short title: An Enhanced Patient-Specific Computer Model
doi: https://doi.org/10.14740/jnr435w
| Abstract | ▴Top |
Background: A previously introduced patient-specific computer model was applied to predict outcomes of the balloon occlusion test (BOT). The goal of this work was to propose an enhanced patient-specific computer model using a new iterative multi-staged algorithm.
Method: This work presents an enhanced patient-specific computer model which converts several more terminals from generic, to patient-specific, resistances and also makes the aortic pressure and the stiffness coefficient patient-specific. A new iterative multi-staged algorithm is proposed to determine the terminal resistances, the aortic pressure, and the stiffness coefficient using vessel sizes and vessel flows measured by quantitative magnetic resonance angiography (qMRA) and cuff pressure. The predictions of the BOT were also evaluated for the validation of the proposed model.
Results: The predictions from the proposed model were accurate in comparison with the clinical outcomes of the two BOTs. The computed stiffness coefficients were consistent with the ages of the two patients. The correlation coefficients between the flow measurements and the computed flows using the proposed computer model at baseline for the two patients were 0.9861 and 0.9995, respectively. The computed aortic pressures were also comparable in waveform shape with the actual aortic pressure measurements obtained during the BOT using a catheter-transducer.
Conclusion: The present study makes the computer model more patient-specific with a new algorithm using non-invasive data from qMRA and cuff pressure. The six more sectors have made the terminal resistances more patient-specific. The patient-specific aortic pressure has made the forcing function patient-specific. And the stiffness coefficient has made the compliance patient-specific.
Keywords: Blood flow modeling; Magnetic resonance imaging; Balloon occlusion test
| Introduction | ▴Top |
In recent years, great emphasis has been placed on the role of cerebrovascular modeling in the management of cerebrovascular diseases [1-4]. A previously introduced computer model was applied to predict outcomes of the balloon occlusion test (BOT) [3, 4]. The use of models started with lumped parameter, one-dimensional (1D), two-dimensional (2D), three-dimensional (3D), and coupled 1D-3D approaches [5-19]. More recent works have been focused on image-based modeling techniques, since these techniques have made patient-specific modeling and its clinical utilization possible [20-23]. The challenge to these patient-specific models is that the parameter identification can be difficult due to the tremendous amount of imaging data available. These models are usually non-linear with multiple differential equations, which must be solved simultaneously, and include many structural and physiological parameters [1, 3, 4, 22, 23].
The sector model had been previously proposed [3, 4] to estimate patient-specific terminal resistances, where a sector was devised in which all of the terminal vessels were melded into one terminal vessel. A sector represents a region in the circulation with one or more primary inlet vessels to the region and an outlet vessel. The resistance on the outlet vessel of a sector was called the sector resistance, which represents the individual arteriovenous capillary system in the region. Seven such sectors were created. Sector adjustor proposed [3, 4] was an iterative algorithm to determine the patient-specific terminal resistance for each sector such that the outlet flow for the sector was approximately equal to the regional blood flow measured by quantitative magnetic resonance angiography (qMRA) [24]. The computer model with the estimated terminal resistances obtained from the sector-adjustor was able to accurately predict which patient would not tolerate the BOT [3, 4]. However, generic resistances in the posterior cerebral area and the chest area, a generic pressure vs. time at the root of ascending aorta as the forcing function, and a generic arterial stiffness were used in the sector model [3, 4].
This paper proposes an enhanced sector model with a total of 13 sectors which cover 13 regions, including both the posterior cerebral area and the chest area. The forcing function, which is the pressure at the root of the ascending aorta, as well as arterial stiffness was made to be patient-specific. A new iterative multi-staged algorithm was proposed to determine these parameters, including the 13 terminal resistances, the forcing function, and the stiffness coefficient. To validate the proposed model using the new algorithm, the brain circulation including the systemic circulation of two patients was modeled and the predicted effect of the BOT was evaluated.
| Materials and Methods | ▴Top |
The data collected for each of the two patients include: 1) the blood flows of 19 - 21 arteries in the head, the neck, and the chest area described below; 2) the cuff pressure including both systolic and diastolic cuff pressure; 3) the heart rate; and 4) the clinical outcomes of the BOT, i.e., pass or failure. The data for 1), 2) and 3) were acquired before or after BOT but before any intervention. The vessel sizes and flows were calculated using the NOVA software (VasSol, River Forest, IL) for qMRA. All enrolled patients had filled the consent form according to protocol, as established by the institutional review board at the University of Illinois at Chicago.
qMRA
The qMRA was performed on a three Tesla (3T) magnetic resonance imager (Excite; GE Healthcare, Milwaukee, WI). The protocol has been described previously [24, 25]. First, a 2D or 3D time of flight (TOF) MRA was performed. Acquired images were transmitted to a computer workstation where the NOVA software was used to create a rotating 3D surface rendering of the vasculature using a marching cube algorithm [25]. The optimal perpendicular scan plan was calculated by a line-fitting algorithm, and a retrospectively gated 2D phase contrast scan was performed with a double-oblique prescription that was perpendicular to the vessel flow direction. The peripheral gating signal was used for cardiac gating during qMRA acquisition. The temporal resolution was 20 data points per cardiac cycle providing a temporal resolution of approximately 50 ms. The acquired phase-contrast images were transferred to the workstation for vessel flow quantification and vessel diameter estimation.
The flow measurement in a total of 19 - 21 vessels included six vessels in the neck, 9 - 11 vessels in the head, and four vessels in the chest. The six neck vessels included the left and right common carotid arteries (LCCA and RCCA), the left and right internal carotid arteries (LICA and RICA), and the left and right vertebral arteries (LVA and RVA). The 9 - 11 head vessels included the basilar artery (BA), the M1 segment of the left and right middle cerebral arteries (LMCA M1 and RMCA M1), the A1 and A2 segment of the left and right anterior cerebral arteries (LACA A1 and A2, and RACA A1 and A2), the P2 segment of the left and right posterior cerebral arteries (LPCA P2 and RPCA P2), and the left and right posterior communicating arteries (LPCOM and RPCOM) if present. The four vessels in the chest included the ascending aorta (AA) and descending aorta (DA), and the left and right subclavian arteries (LSA and RSA).
Enhanced sector model
An enhanced sector model was proposed with a total of 13 sectors (Fig. 1) by splitting the anterior cerebral (AC) sector included in the seven-sector model [4] into the right anterior cerebral (RAC) sector and left anterior cerebral (LAC) sector and adding five more sectors to the original seven-sector model [3, 4]: the right posterior cerebral (RPC) sector, the left posterior cerebral (LPC) sector, the right subclavian (RSUB) sector, the left subclavian (LSUB) sector, and the abdominal (ABD) sector.
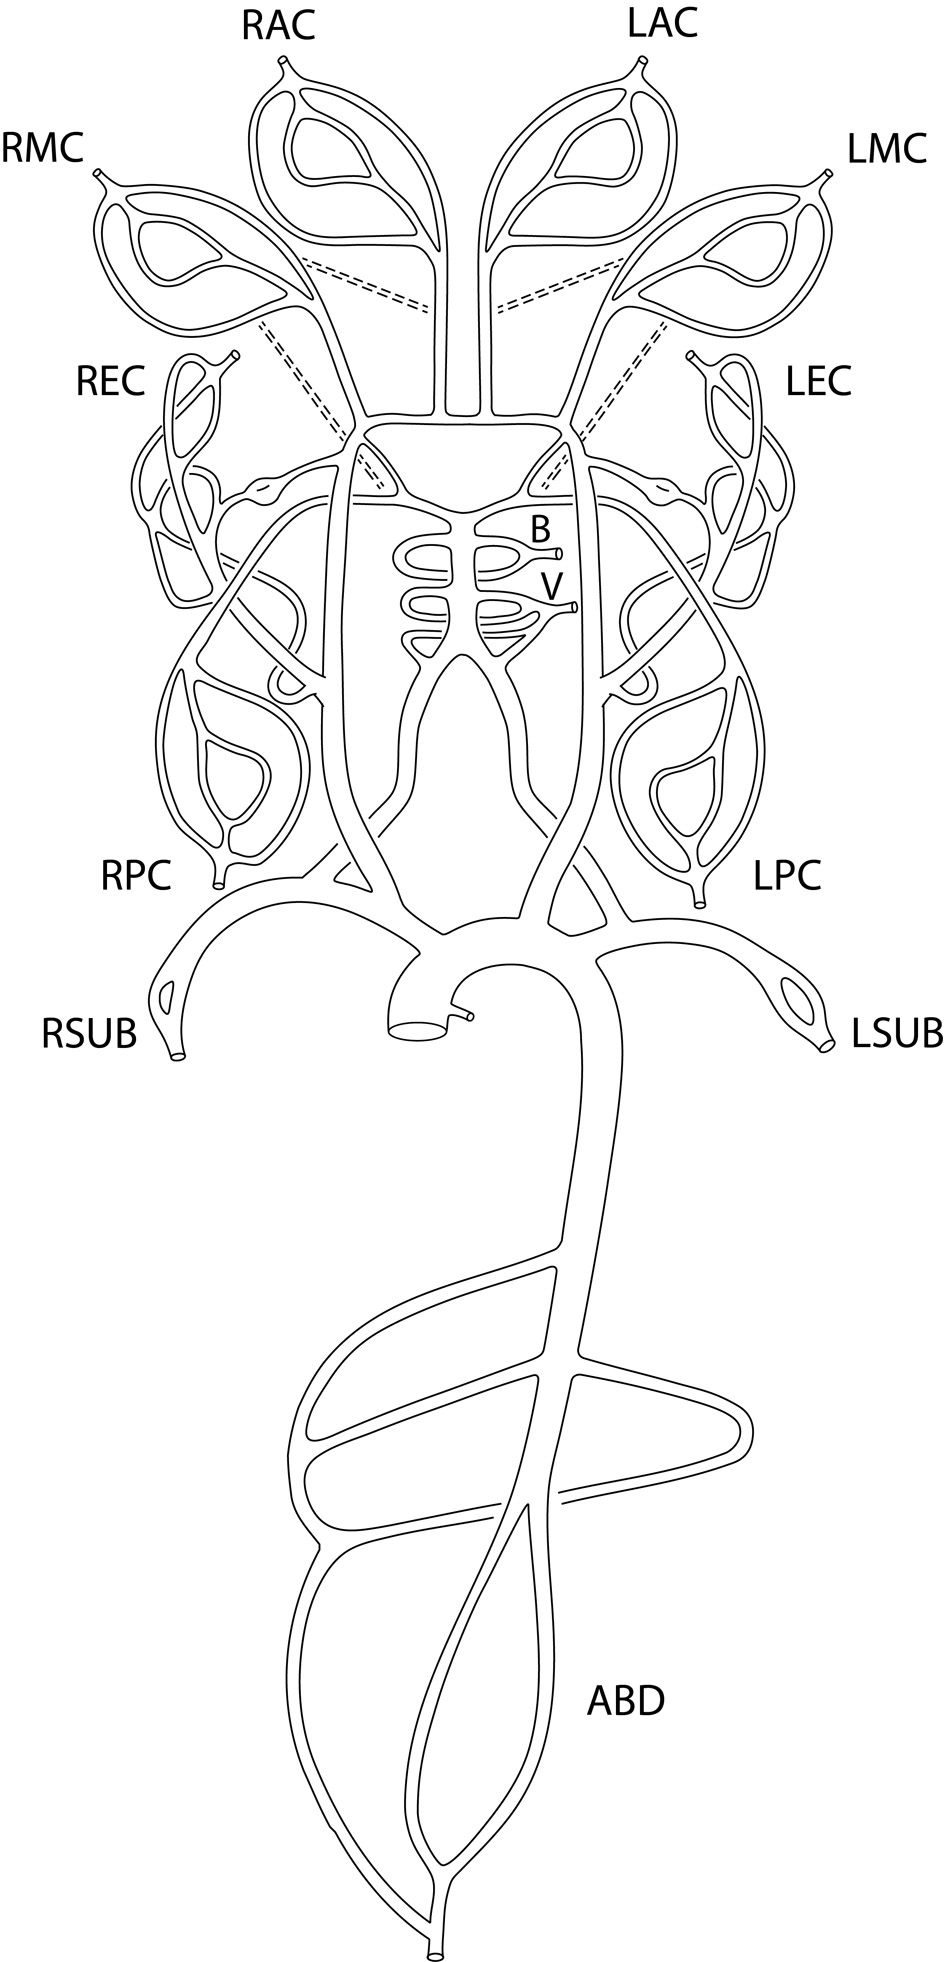 Click for large image | Figure 1. Enhanced sector model of cerebral circulation with the following 13 sectors: right and left middle cerebral sectors (RMC and LMC sectors), right and left anterior cerebral sectors (RAC and LAC sectors), right and left posterior cerebral sectors (RPC and LPC sectors), basilar sector (B sector), vertebral sector (V sector), right and left extracranial sectors (REC and LEC sectors), right and left subclavian sectors (RSUB and LSUB sectors), and abdominal aorta sector (ABD sector). The dashed lines represent the anastomosis between anterior cerebral sectors and middle cerebral sectors, and between posterior cerebral sectors and middle cerebral sectors. |
Each sector consists of one or more primary vessels, zero or more secondary vessels, and one terminal outlet. The sector flow is defined as the total inlet flow to the sector (Table 1) which corresponds to the regional flow calculated by qMRA for most of the regions [24]. The terminal outlet in each sector is also called terminal resistance efferent, which is modeled by a three-element windkessel model [5]. The selection between primary and secondary vessels is based on the availabilities of vessel flow measurements.
 Click to view | Table 1. Primary and Secondary Vessels and Sector Flow of Enhanced Sector Model |
The stiffness parameter β is used to express the stiffness of an artery [26]: ln(P/Ps) = β (R/Rs - 1), where Ps is the standard pressure and Rs is the arterial wall radius at the pressure of Ps. The nominal values for the arteries of the study are given in Table 2 where the values for common carotid artery, extracranial portion of the vertebral artery, internal carotid artery, and intracranial portion of the vertebral artery were from Ref. [26]; the values for other intracranial arteries were taken the same as the value of the intracranial vertebral artery; the values for AA, DA, and subclavian arteries were chosen here in this article. But the arterial stiffness is also related to age, hypertension, and pathologic state [26-28]. To make the arterial stiffness patient-specific, the following equation was used: ln(P/Ps) = CβN(R/Rs - 1), where βN is the nominal values of β and C is a patient-specific constant, called “stiffness coefficient”.
Click to view | Table 2. Nominal Values of Stiffness in Major Arteries |
Iterative multi-staged algorithm
Given the vessel size and flow measurements from qMRA and cuff pressure (both systolic and diastolic pressure), a new multi-staged algorithm shown in Figure 2 is used to decompose the parameter estimation of the arterial stiffness, the pressure at the ascending aorta, and the terminal resistance into multiple stages. First, the sector-adjustor [3, 4] with flow source which was obtained via qMRA at the ascending aorta, was used to get the first estimation for terminal resistances and the first estimation for the pressure at the ascending aorta. The details of the sector-adjustor shown in Figure 3 will be described below. Second, the β-adjustor shown in Figure 4 was used to estimate the stiffness coefficient via the minimization of the error between the pulse cuff pressure and the pulse pressure (the definition of pulse pressure see below) at the left subclavian artery or the right subclavian artery depending on the side the cuff pressure was taken. Pulse pressure = systolic pressure - diastolic pressure. Third, the sector-adjustor with pressure source was used to get the second estimation for terminal resistances where the first estimated pressure at the ascending aorta was used as the pressure source. Fourth, the pressure-adjustor shown in Figure 5 was used to finalize the pressure estimation at the ascending aorta. The detailed explanation for the pressure-adjustor will be described below. Finally, the sector-adjustor with pressure source was used to finalize the terminal resistances where the final estimated pressure at the ascending aorta was used as the pressure source.
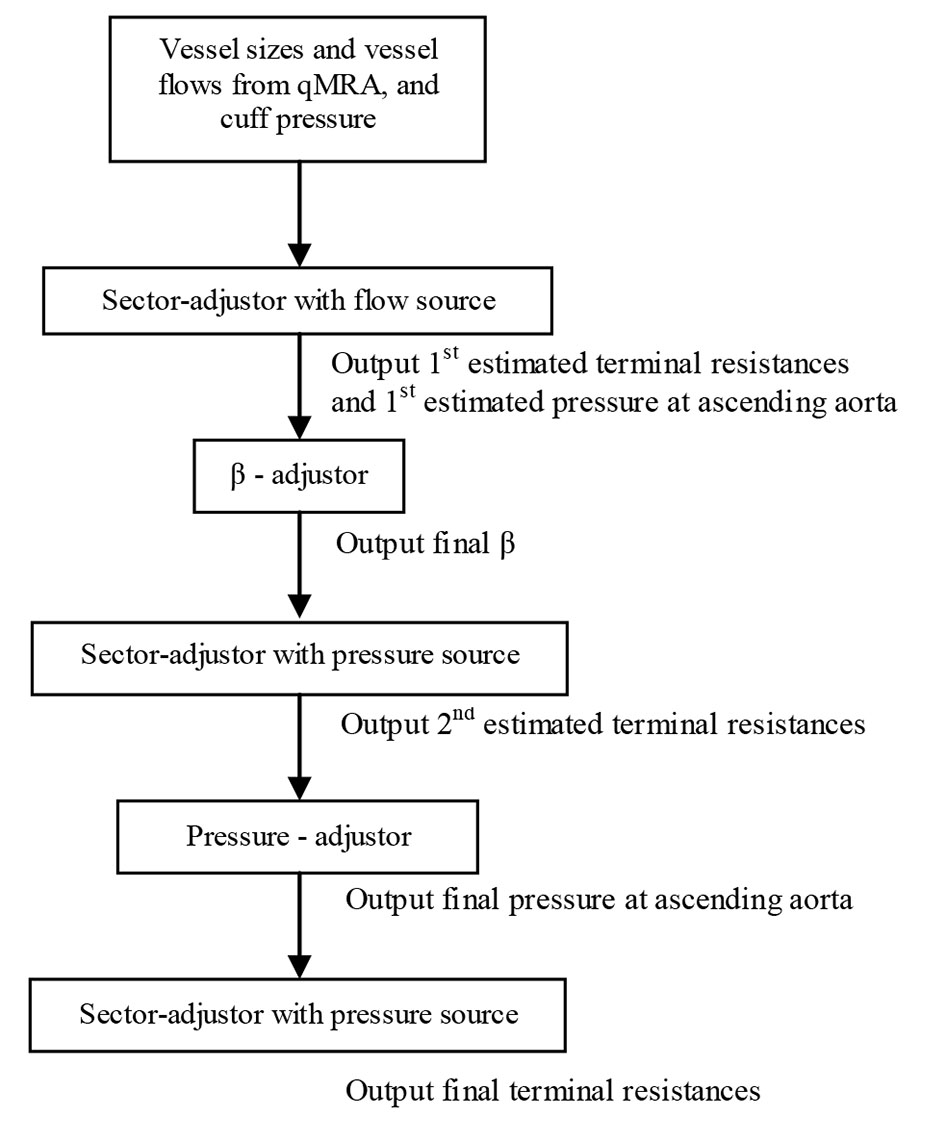 Click for large image | Figure 2. Multi-staged algorithm. |
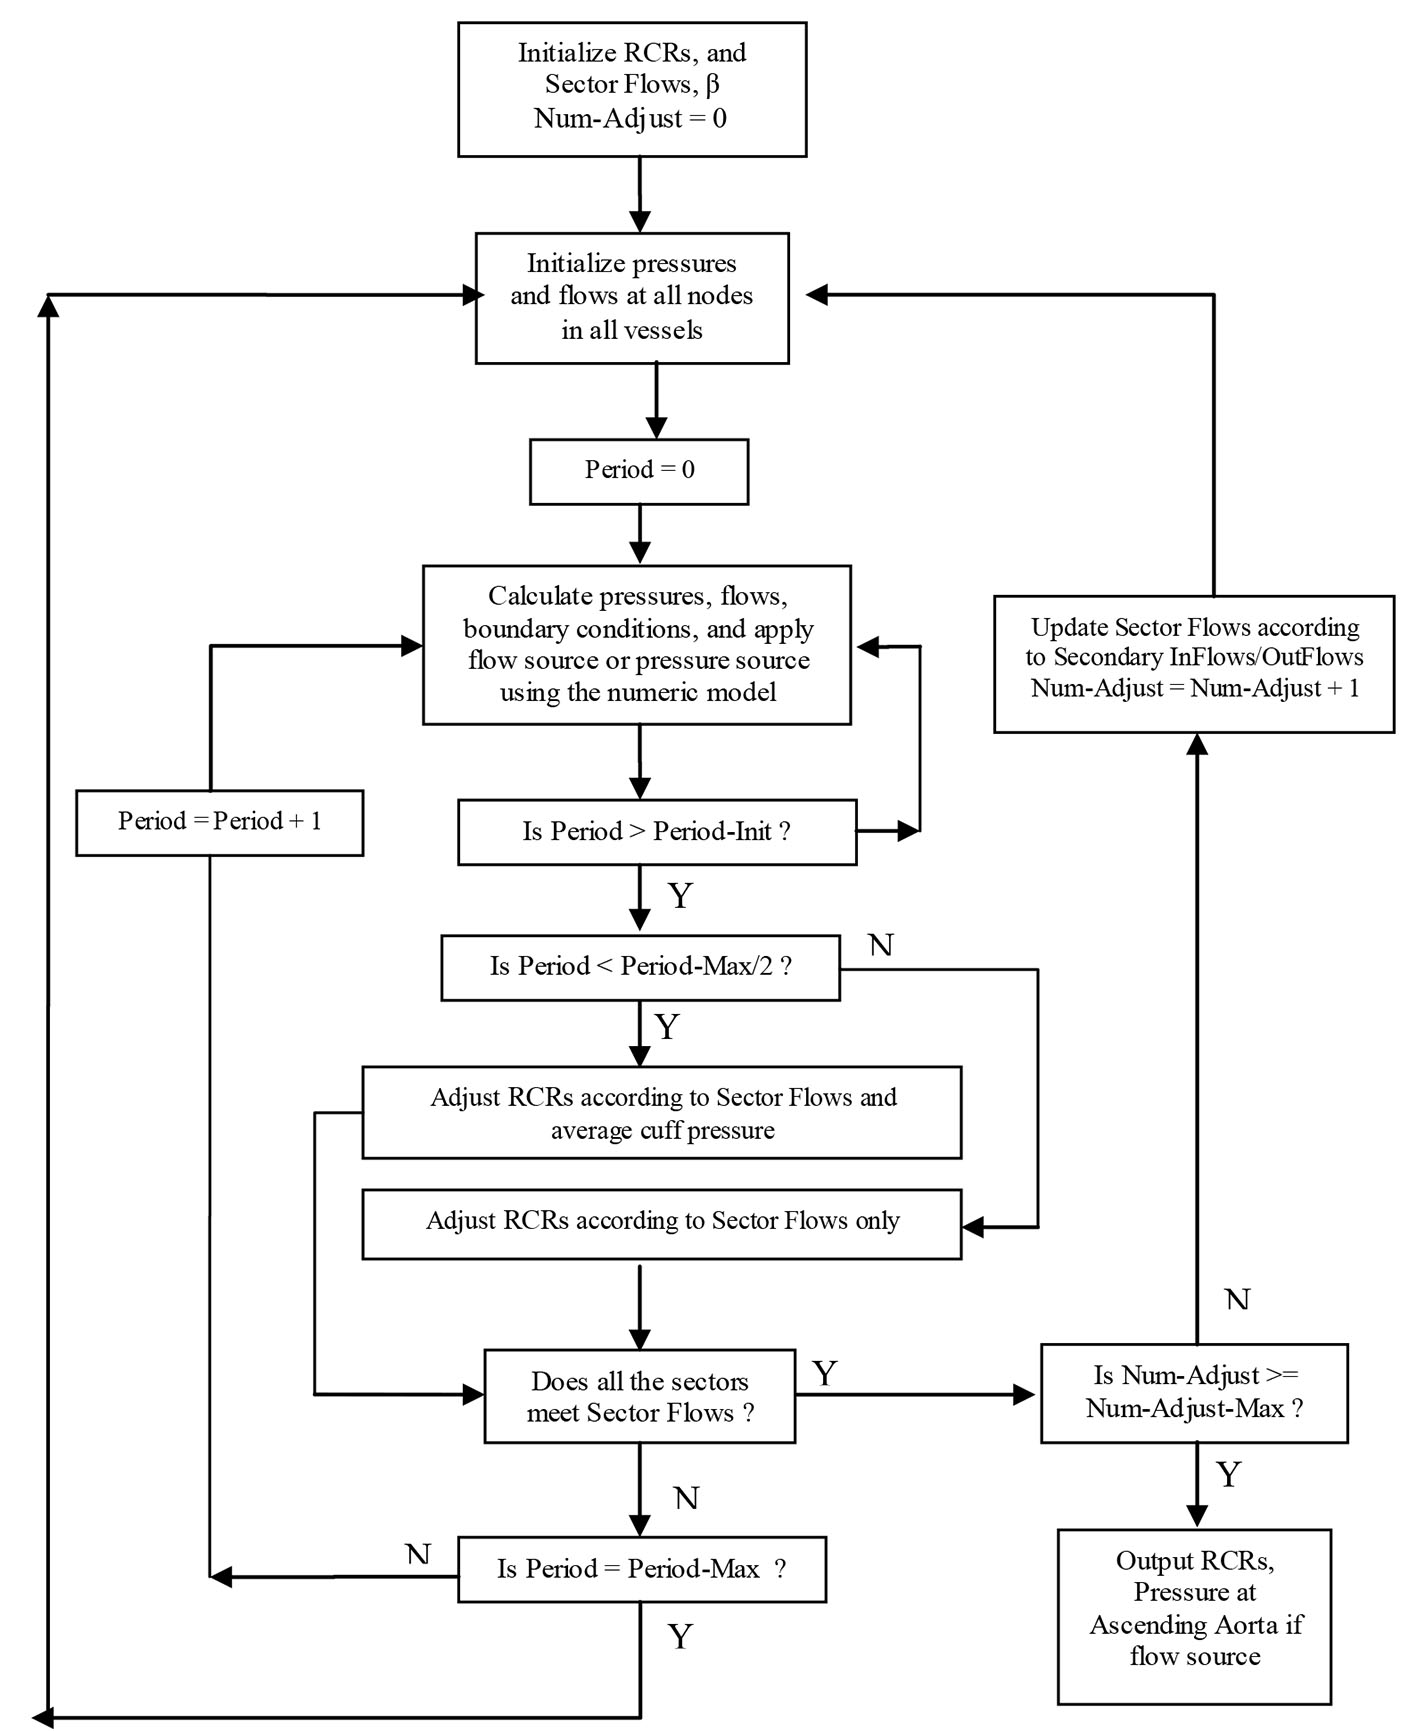 Click for large image | Figure 3. Sector-adjustor with flow source or pressure source (Period-Init: 10, Period-Max: 100, Num-Adjust-Max: 5). |
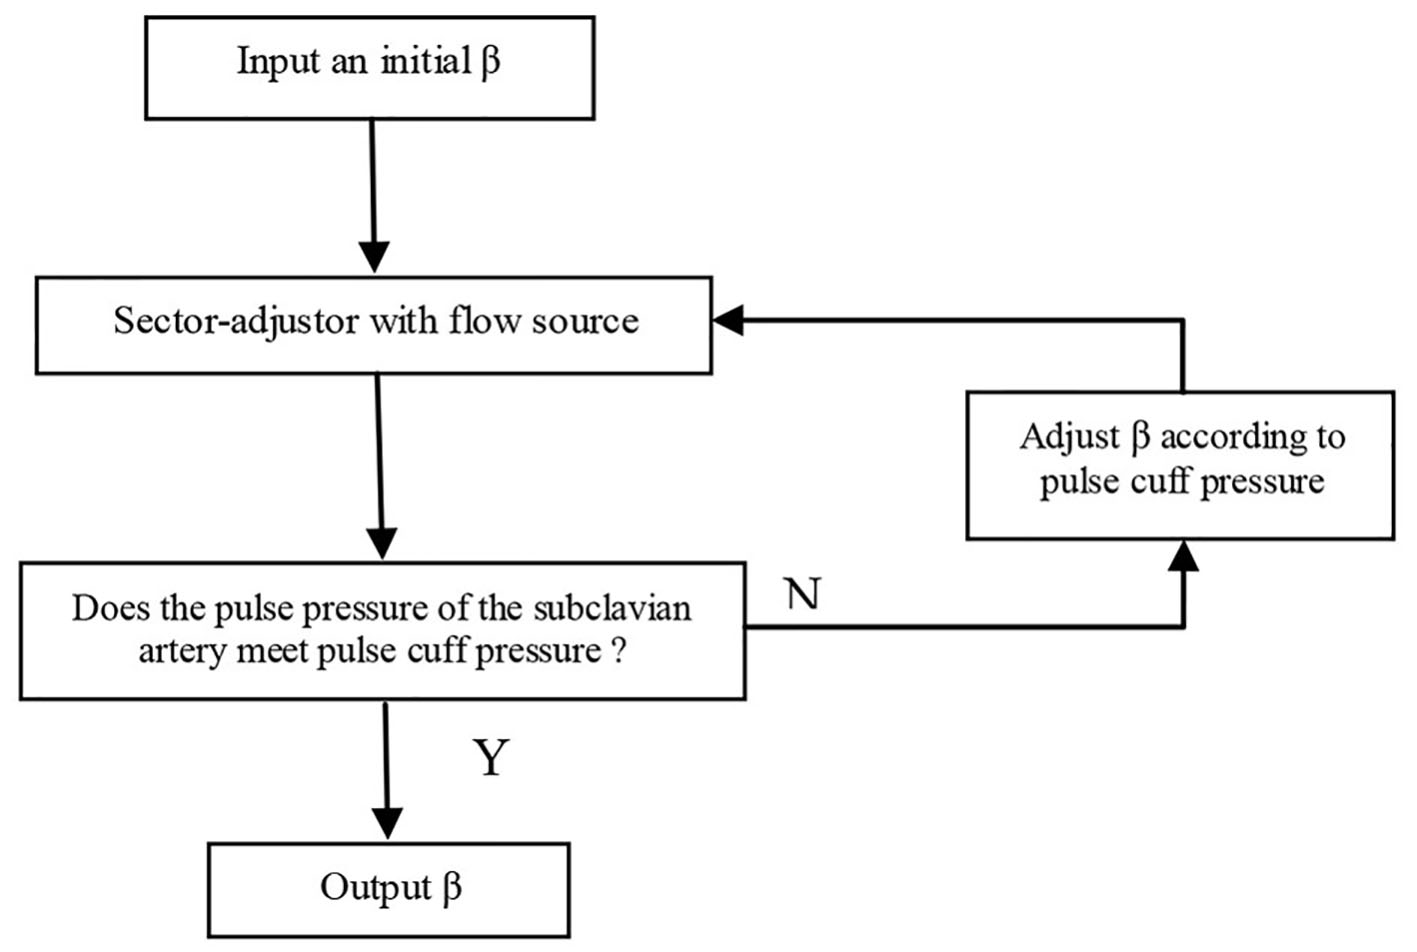 Click for large image | Figure 4. β-adjustor. |
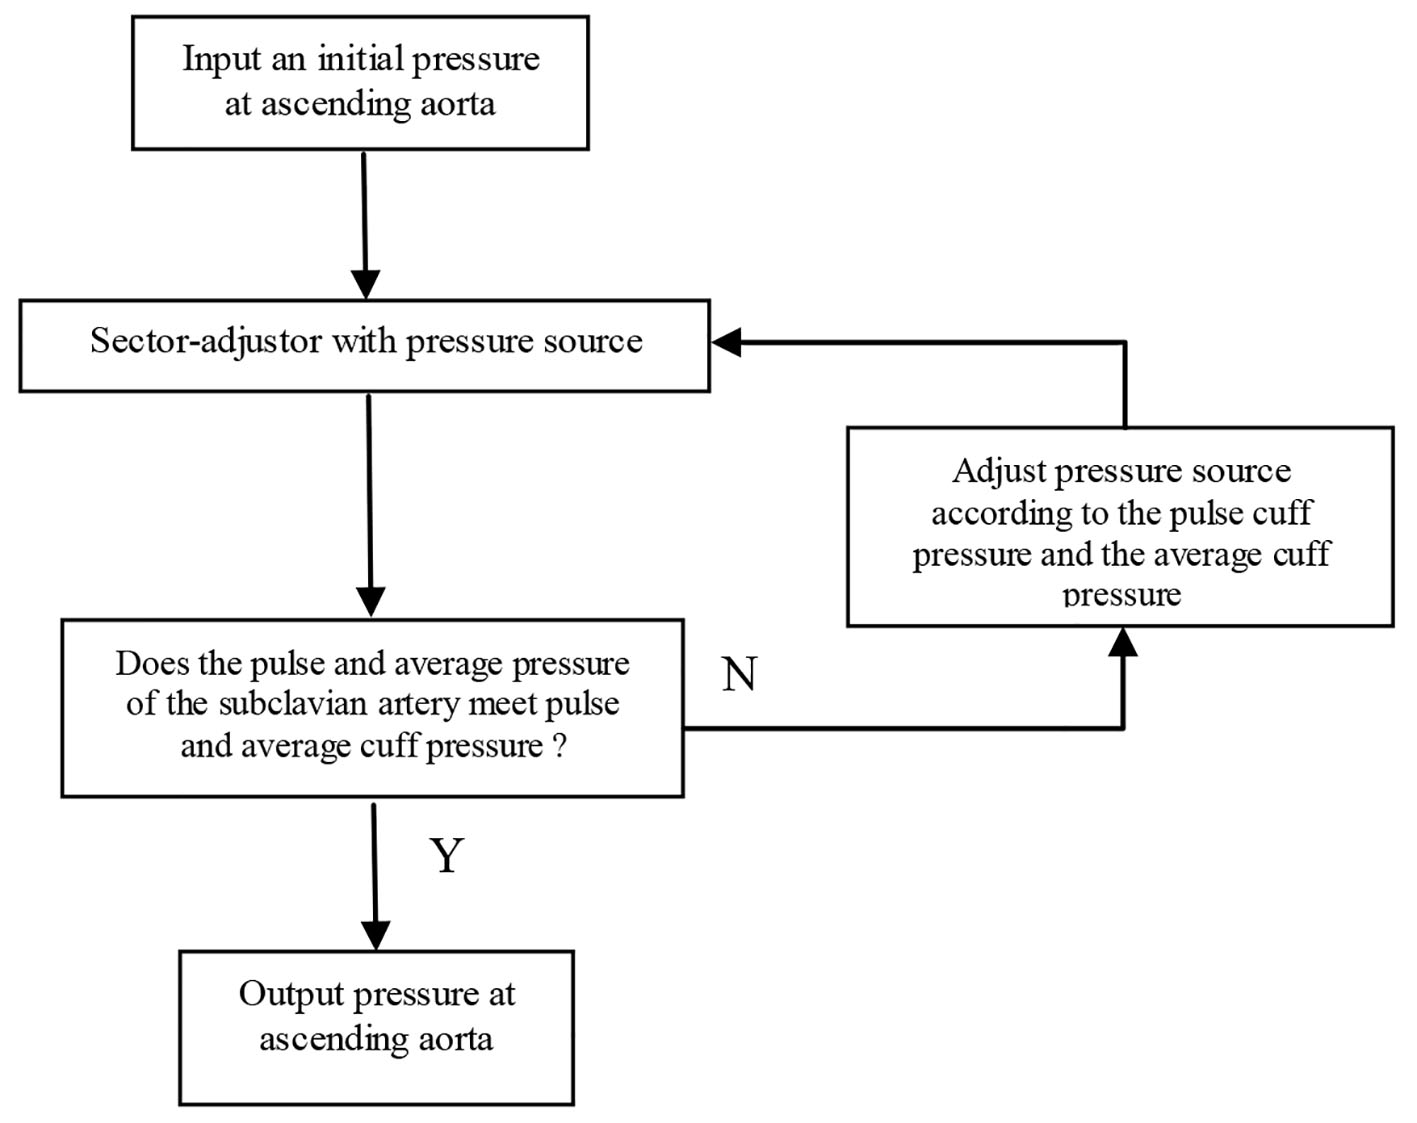 Click for large image | Figure 5. Pressure-adjustor. |
As we can see from Figure 2, the sector-adjustor shown in Figure 3 was repeatedly run between the stages so that the terminal resistances were refined at each stage. The original sector-adjustor [3, 4] is enhanced here to adjust the terminal resistance to meet both the sector flows in the sector outlets and the average cuff pressure (the definition of average pressure see below) in the subclavian artery with either flow or pressure source.
Average pressure = (diastolic pressure × 2 + systolic pressure)/3
The adjustment of the terminal resistances will not occur in sector-adjustor until a steady-state has been reached. Approximately 10 pulse periods (Period-Init was set to 10 in Fig. 3) of calculations are required to bring the pressures and flows into a steady state. The adjustment of the terminal resistance is based not only on the sector flows but also the average cuff pressure when Period > Period-Init and Period < Period-Max/2 (Period-Max was set to 100). If the sector-adjustor still does not converge when Period ≥ Period-Max/2, the adjustment of terminal resistances will only be based on the sector flows, which is similar to the original sector model.
In pressure-adjustor shown in Figure 5, the pressure source was updated with the following equation: P* = C1P + C2, where the constant C1 was determined via the minimization of the error between the pulse cuff pressure and the pulse pressure at the left or right subclavian artery, and the constant C2 was determined via the minimization of the error between the cuff average pressure and the average pressure at the left or right subclavian artery.
Balloon occlusion simulation
The parameters estimated with the above proposed iterative multi-staged algorithm were placed into the computer model to simulate the baseline and the carotid occlusion. The balloon-occlusion was modeled by specifying the diameter of the ICA (either LICA or RICA depending on the side the patient had the BOT on) approaching zero (0.02 mm was used). The percent change of the ipsilateral and contralateral flows of the middle cerebral artery, M1 segment, anterior cerebral artery, A3 segment, posterior cerebral artery, and P2 segment at the baseline and the occlusion were calculated, and were used to predict whether or not the patient will tolerate the occlusion. The occluded vessel is the ICA (either LICA or RICA) and the aneurysm(s) is usually at the ICA or a branch of the ICA. The aneurysm(s) is not modeled under the assumption that the calculated percent changes affecting flow and pressures are not affected by the aneurysm(s).
| Results | ▴Top |
Two patients (patient 1: female, age 38; patient 2: female, age 78) with brain aneurysms were studied using the proposed enhanced sector model. The 3D surface rendering of the vasculatures is shown in Figure 6 (patient 1) and Figure 7 (patient 2). An example of a perpendicular scan plan to the vessel flow direction in the 3D surface rendering and the phase contrast magnetic resonance images acquired using the scan plan are shown in Figure 8. The flow waveforms at the ascending aorta measured by qMRA are shown in Figure 9 (patient 1) and Figure 10 (patient 2). The diameters and the volume flows of major arteries measured by qMRA are demonstrated in Tables 3 and 4. The cuff pressures measured in the left arm and heart rates for patient 1 and patient 2 were 111/68 (average pressure: 82 and pulse pressure: 43), 70 bpm; and 157/86 (average pressure: 109.67 and pulse pressure: 71), 75 bpm, respectively. The sector flows obtained from qMRA are shown in Tables 5 and 6 where the ABD sector flows were calculated as subtracting the flow at the ascending aorta from the sum of the 12 sector flows since the mass balance of the sector model has to be maintained. The BOT was performed at LICA for both patients. Patient 1 was able to tolerate the balloon occlusion at LICA but patient 2 was not able to tolerate.
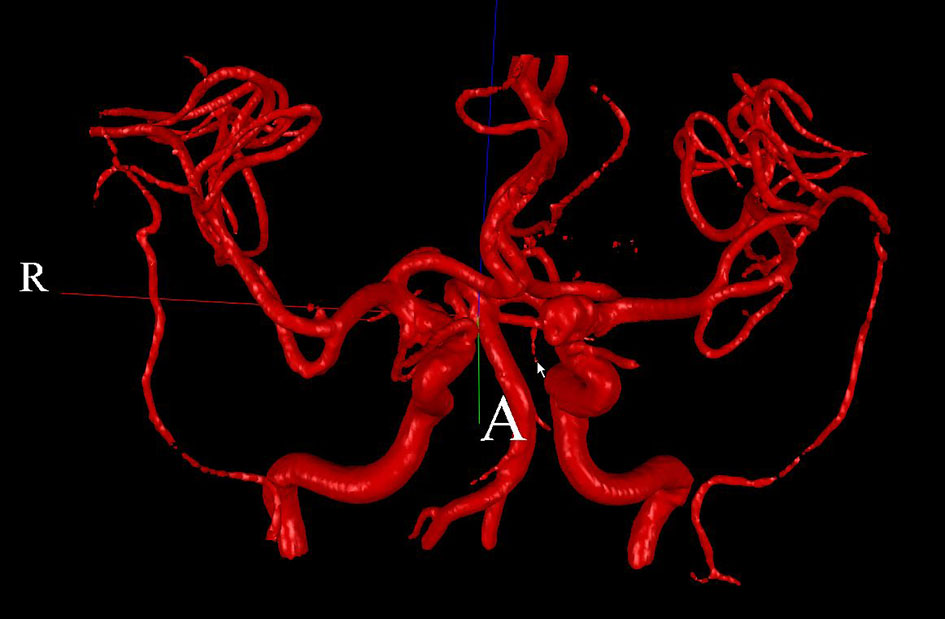 Click for large image | Figure 6. 3D surface rendering for patient 1. |
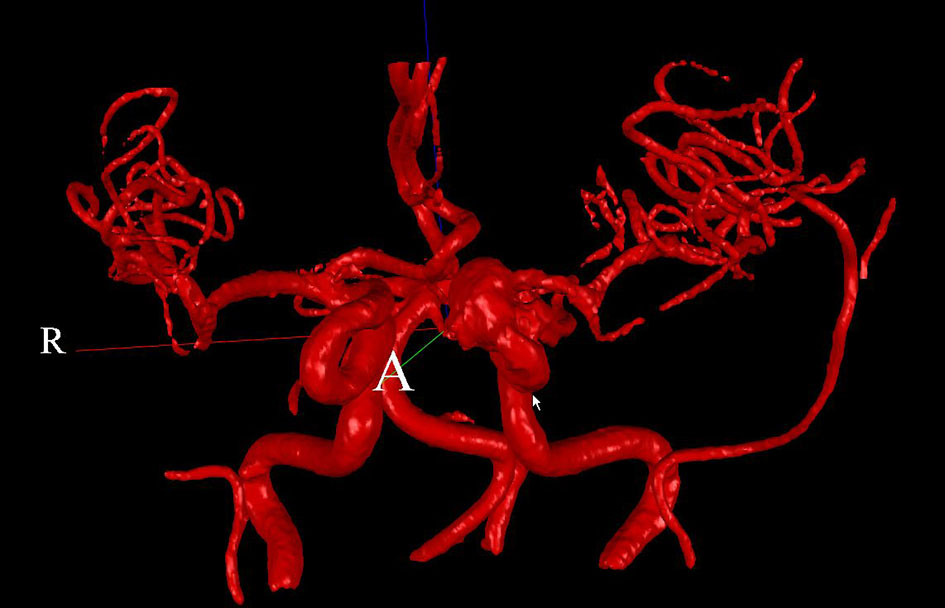 Click for large image | Figure 7. 3D surface rendering for patient 2. |
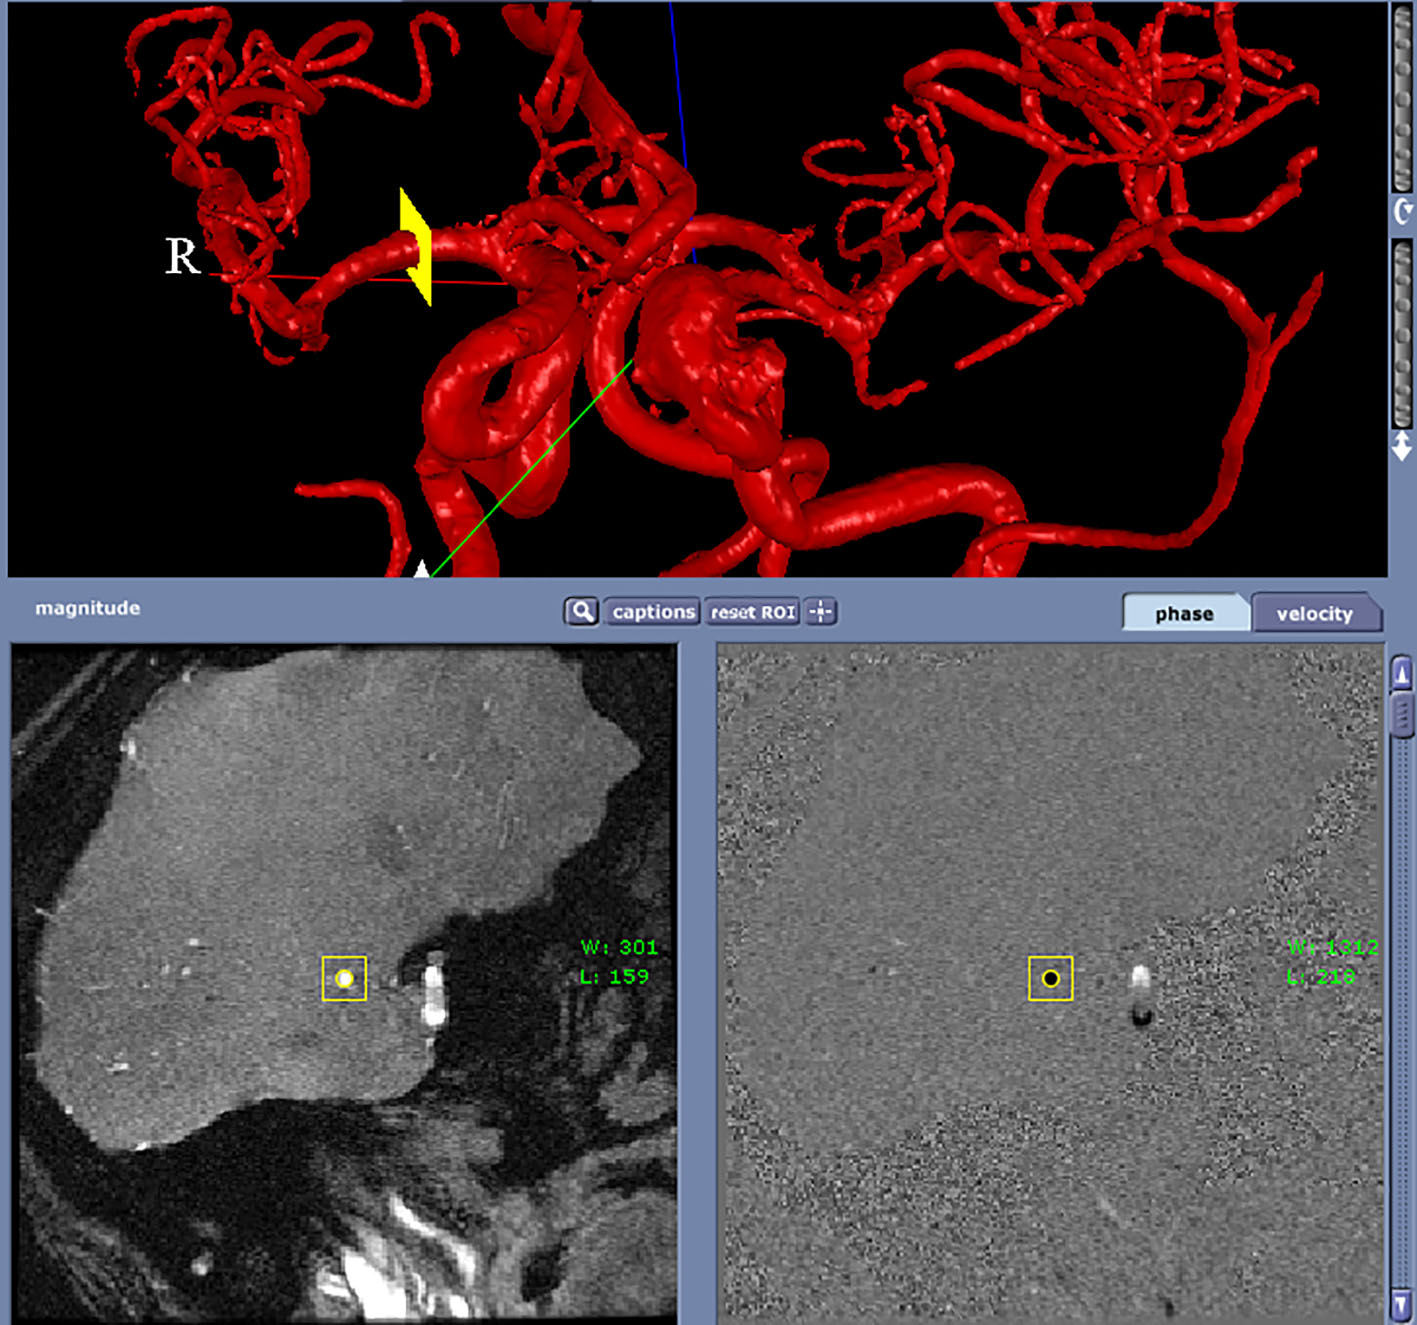 Click for large image | Figure 8. A perpendicular scan plan to the vessel flow direction (RMCA) in the 3D surface rendering and the phase contrast magnetic resonance images acquired using the scan plan. |
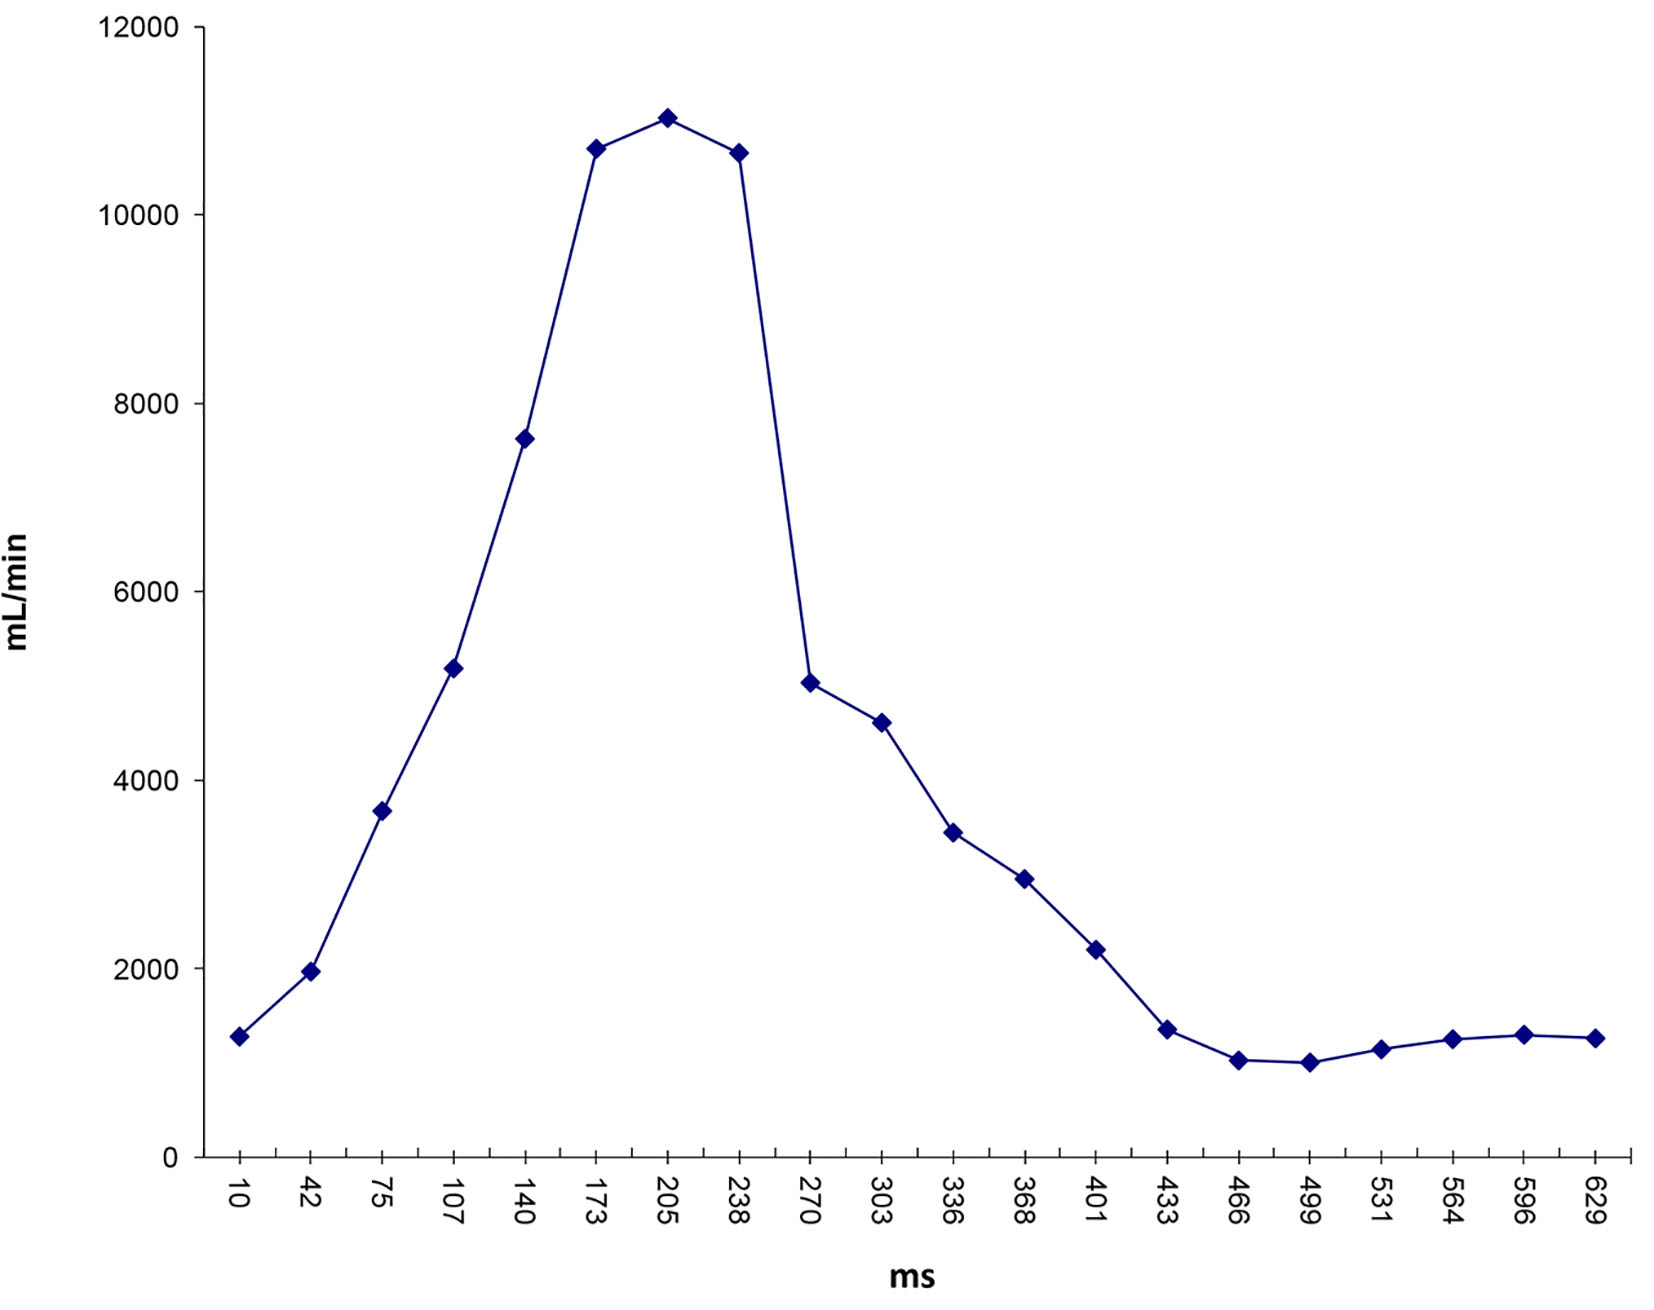 Click for large image | Figure 9. Flow waveform at ascending aorta measured from qMRA for patient 1. |
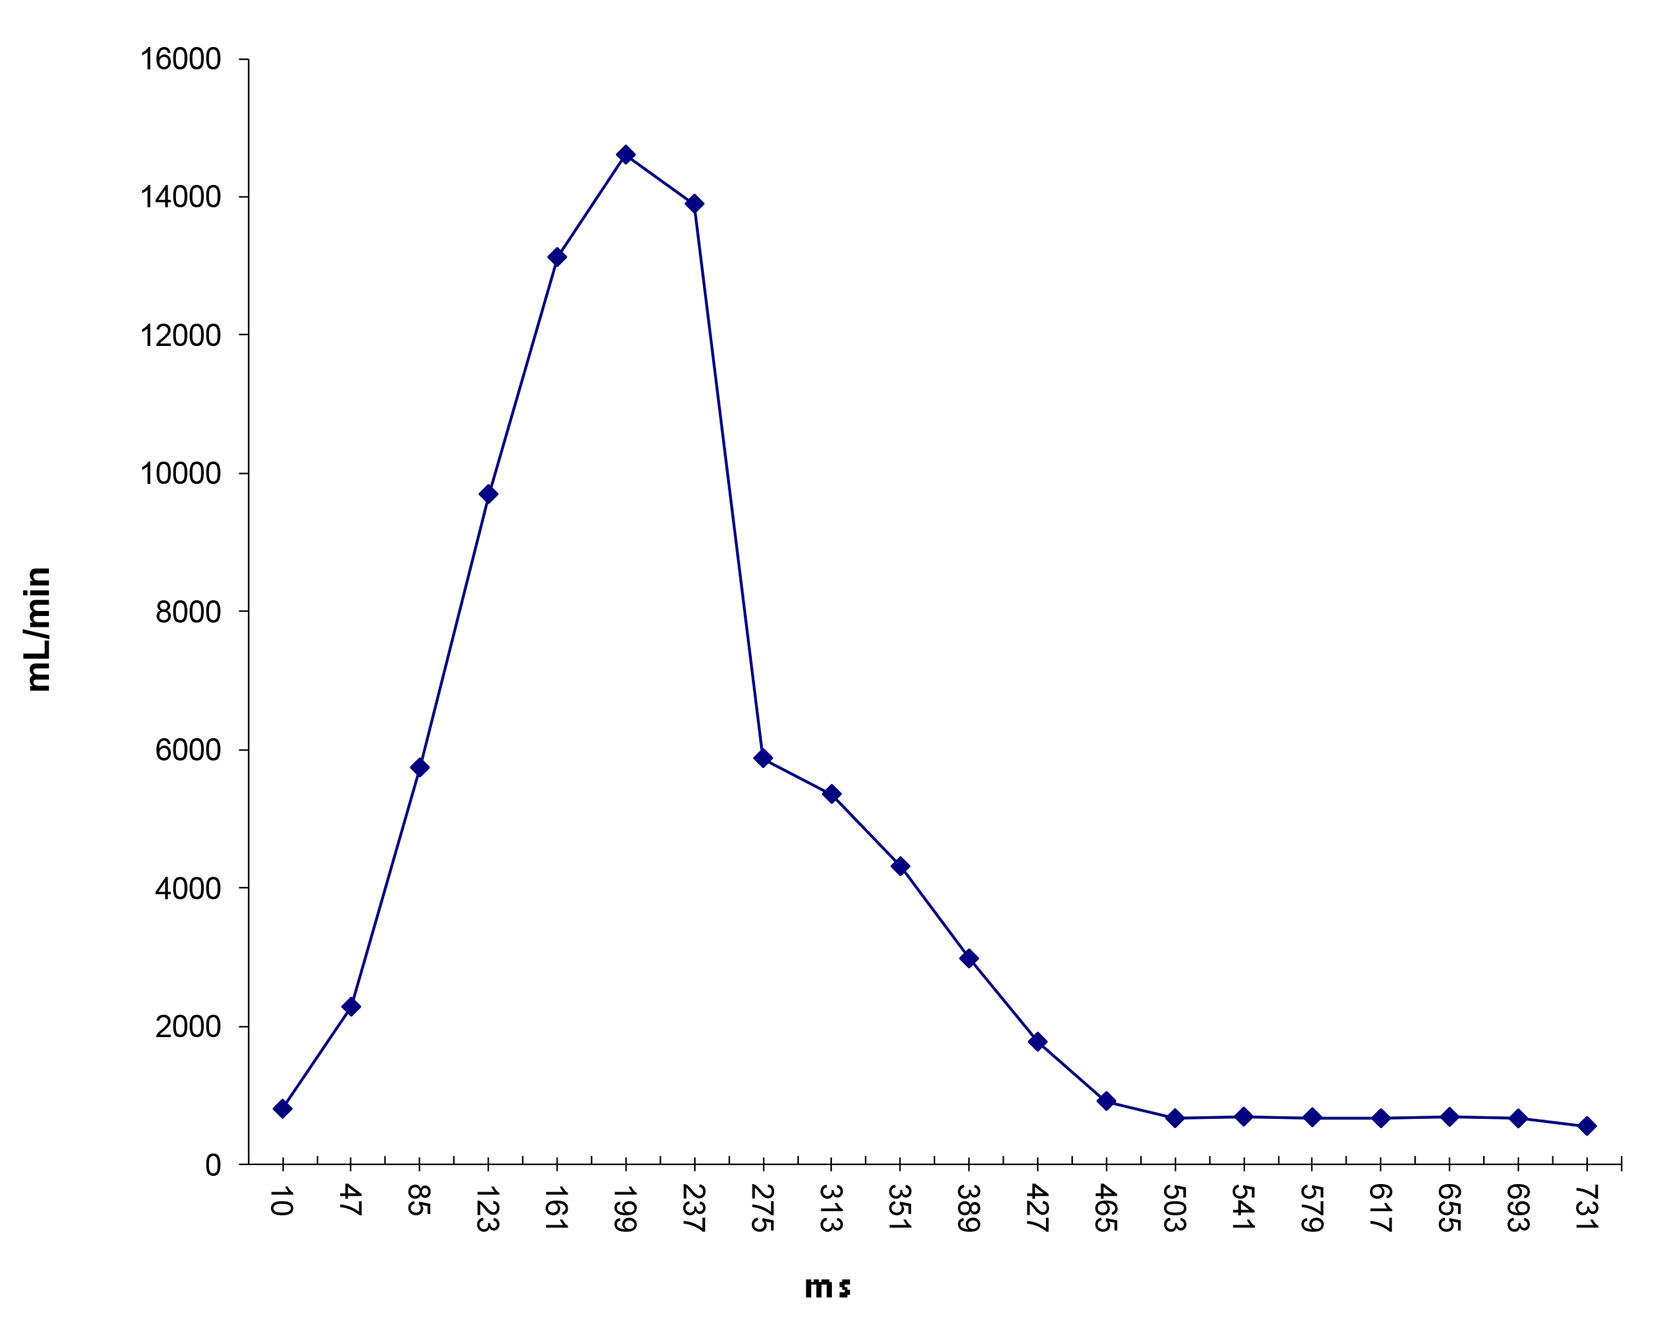 Click for large image | Figure 10. Flow waveform at ascending aorta measured from qMRA for patient 2. |
Click to view | Table 3. Diameters (cm) and Flows (mL/min) of Major Arteries Measured by qMRA for Patient 1 |
Click to view | Table 4. Diameters (cm) and Flows (mL/min) of Major Arteries Measured by qMRA for Patient 2 |
Click to view | Table 5. Sector Flows (mL/min) Between Measurement From qMRA and Proposed Model for Patient 1 |
Click to view | Table 6. Sector Flows (mL/min) Between Measurement From qMRA and Proposed Model for Patient 2 |
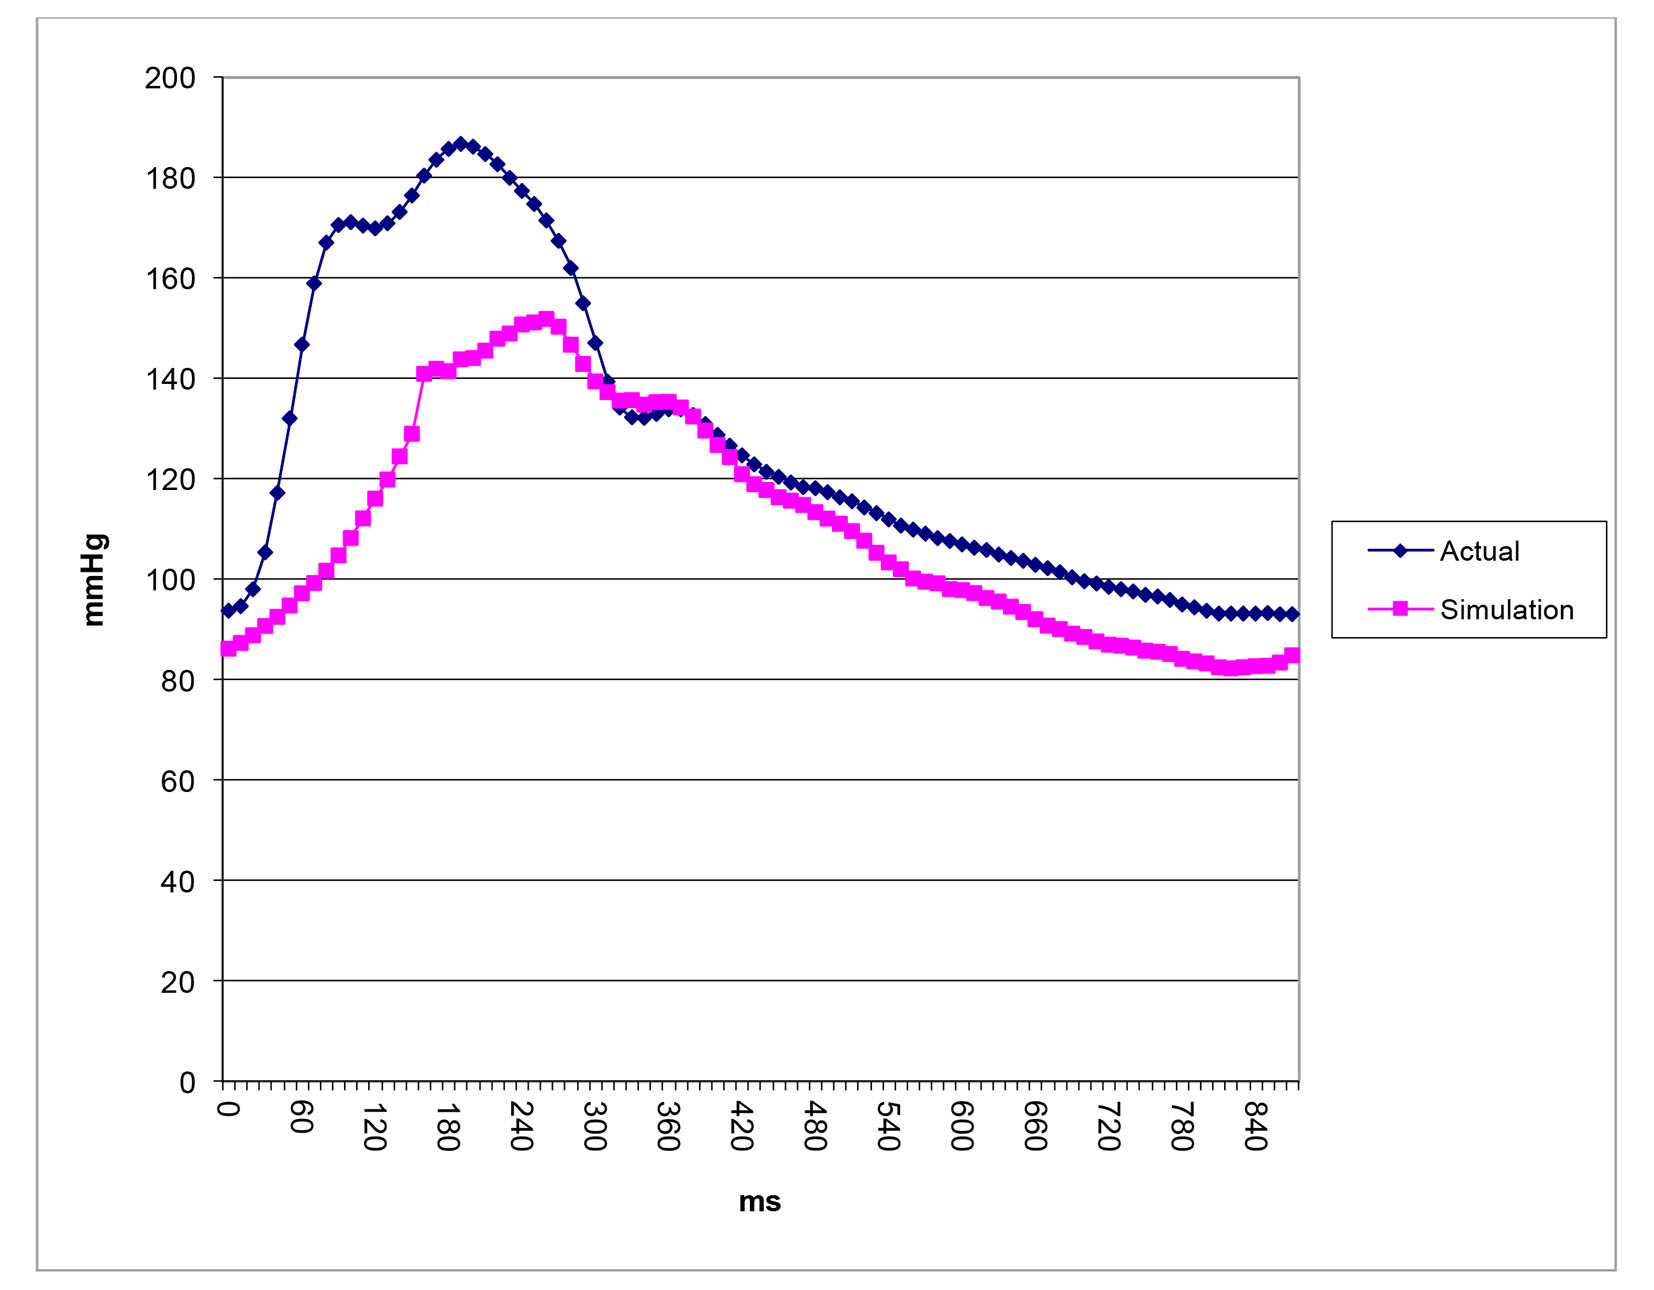
After successfully running the multi-staged algorithm (Figs. 2-5), the estimated stiffness coefficients C for patient 1 and patient 2 were 1.213 and 2.364, respectively. These values are consistent with the ages of the patients. The pressures at the ascending aorta for patient 1 and patient 2 are shown in Figure 11 (patient 1) and Figure 12 (patient 2). The pressures at the ascending aorta for both patients were also compared with the actual arterial pressure measurements at the arch during the BOT using a catheter-transducer (Figs. 11 and 12). The estimated sector flows obtained from the multi-staged algorithm were compared with the measured values from qMRA (Tables 5 and 6). The percent changes between the measured flows and the simulated sector flows are within 3%. The estimated pressures in the left subclavian artery from the multi-staged algorithm for patient 1 and patient 2 were 109.91/68 and 151.90/82.28, respectively. The percent change between the cuff pressure and the simulated pressure at the left subclavian artery are within 5%. The correlations between the measurements from qMRA and the simulated values at baseline are shown in Figures 13 and 14, respectively (correlation coefficient: 0.9861 for patient 1 and 0.9995 for patient 2).
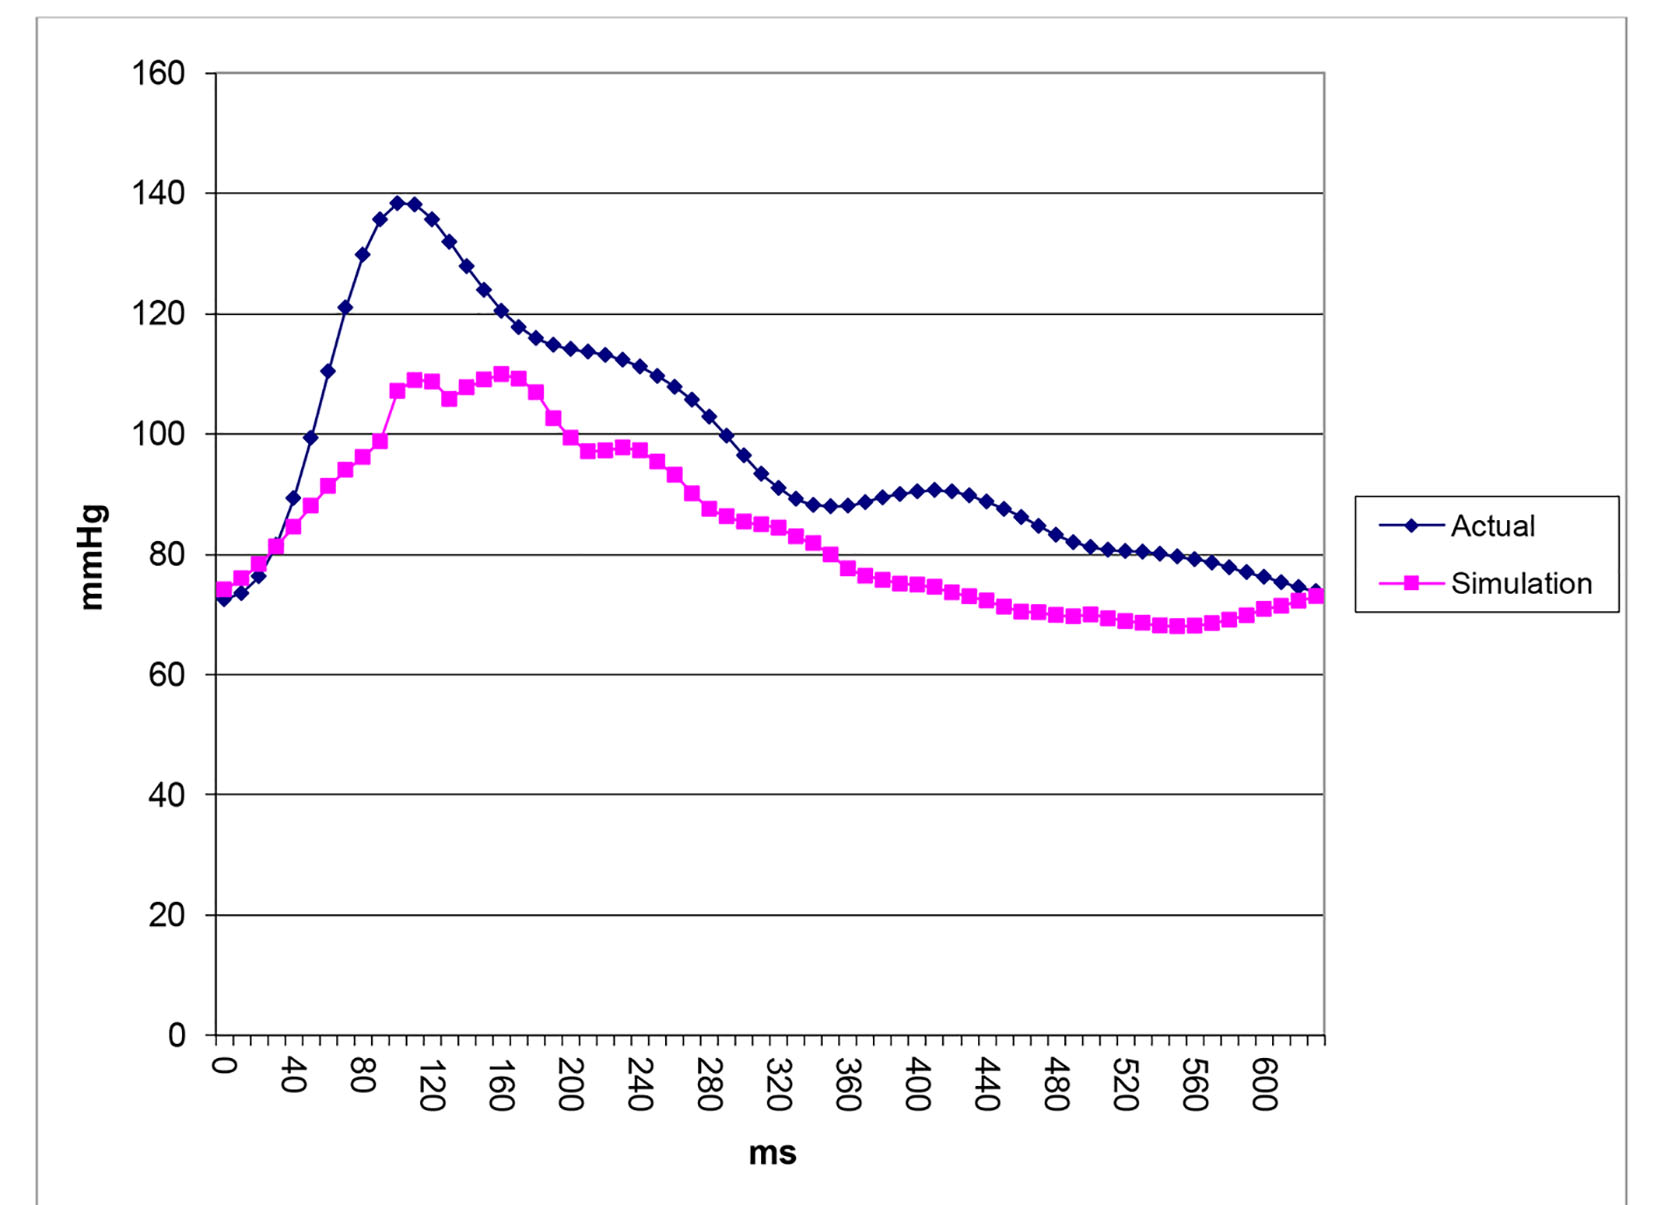 Click for large image | Figure 11. Pressure waveforms: catheter-transducer vs. simulation for patient 1. |
 Click for large image | Figure 12. Pressure waveforms: catheter-transducer vs. simulation for patient 2. |
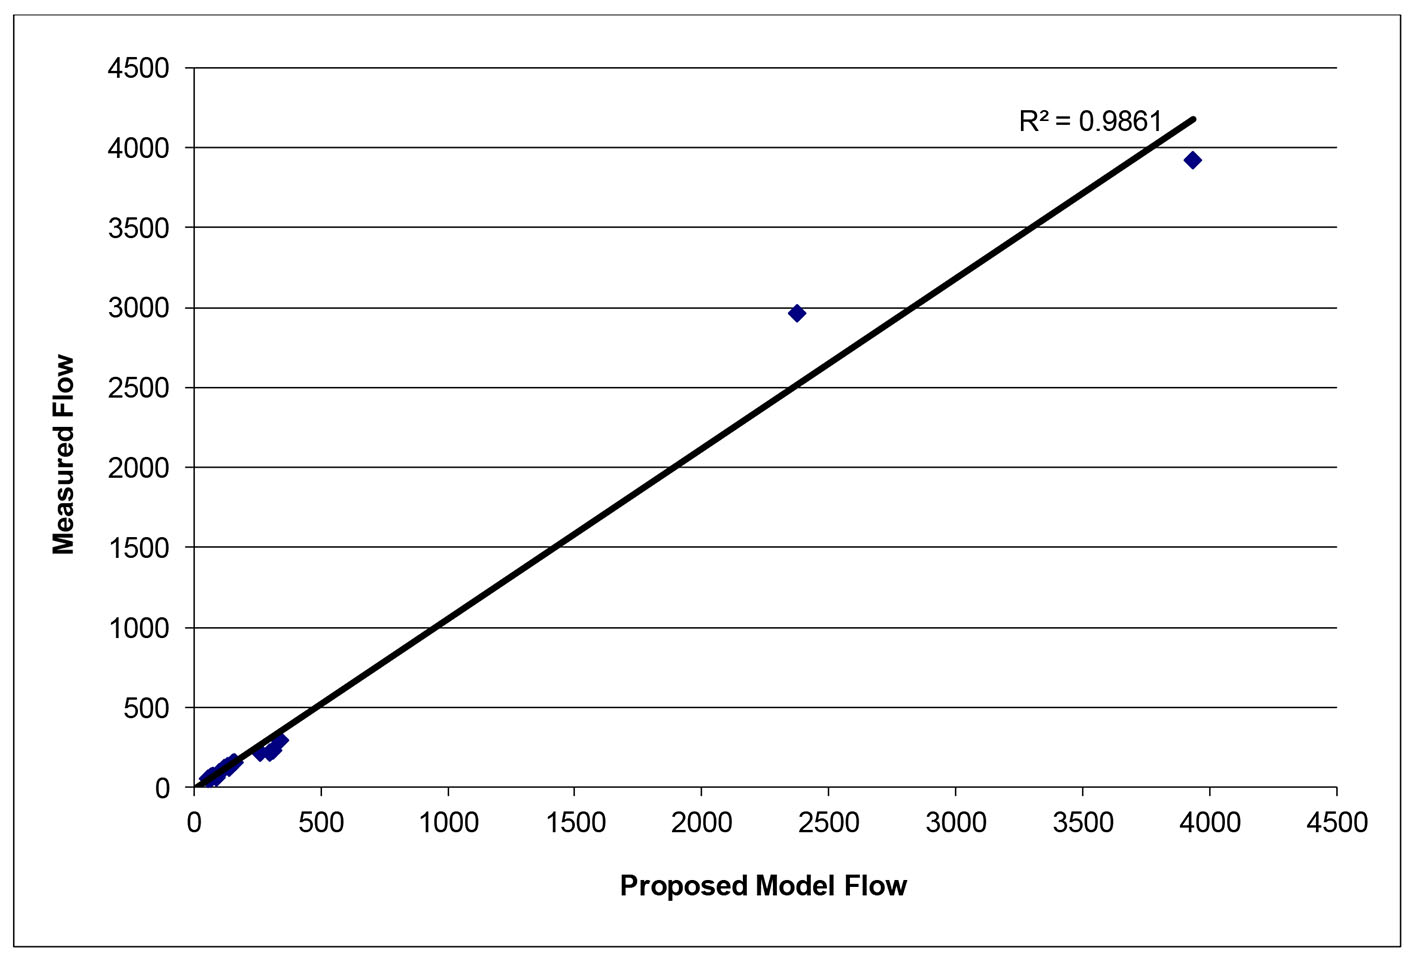 Click for large image | Figure 13. Vessel flows measured by qMRA vs. proposed model at baseline for patient 1. |
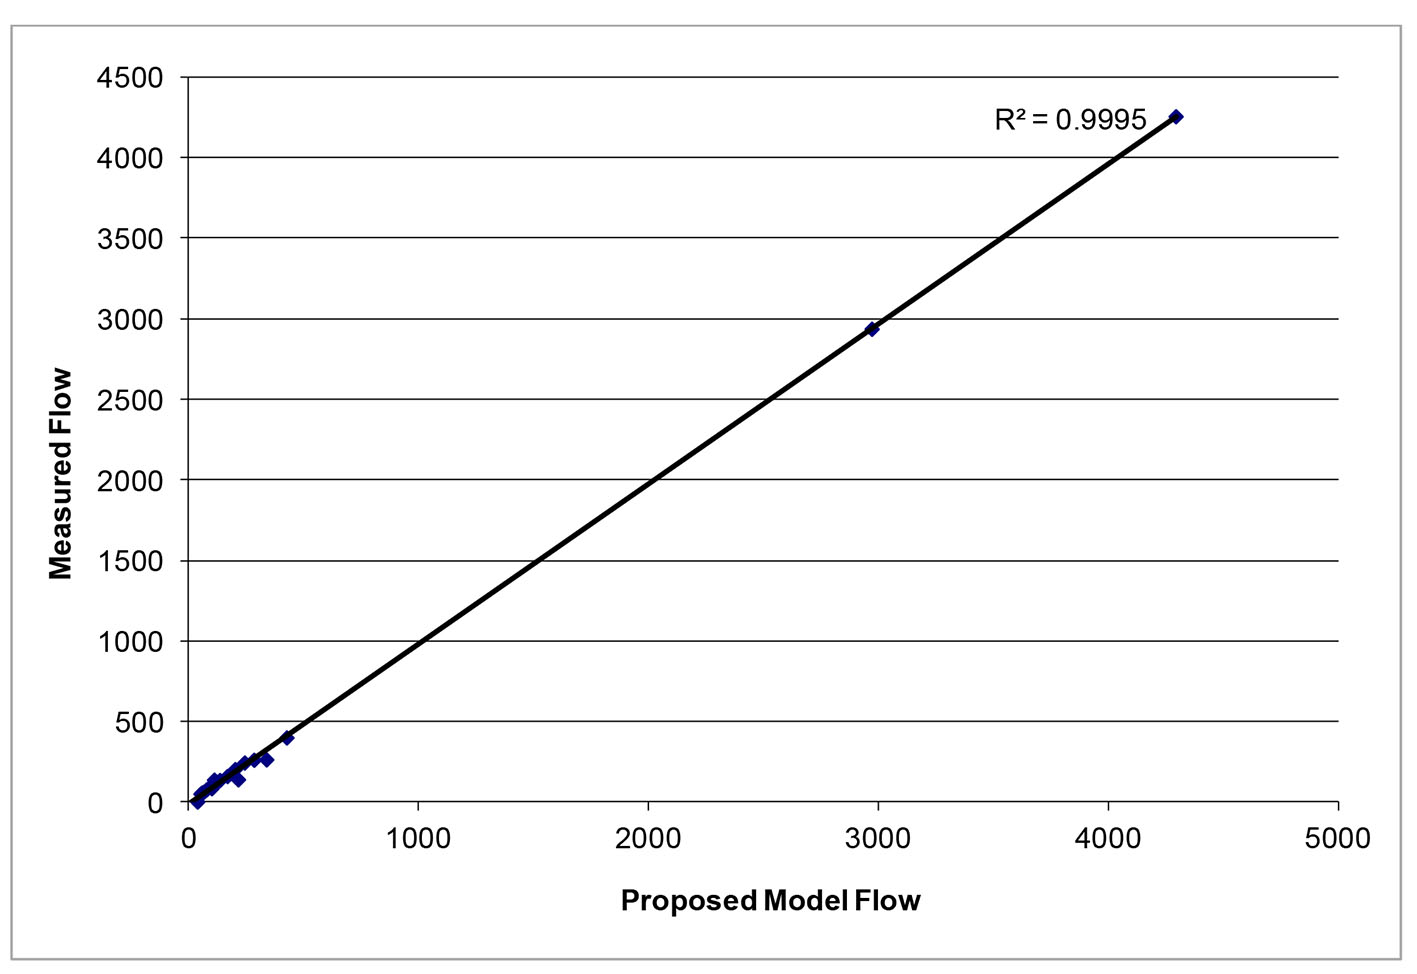 Click for large image | Figure 14. Vessel flows measured by qMRA vs. proposed model at baseline for patient 2. |
The balloon occlusion simulation results are shown in Table 7. The percent changes for flow and pressure between the baseline and occlusion were calculated for both ipsilateral and contralateral M1, A3 and P2 to the site of the balloon occlusion. According to previous findings [3, 18], a decrease in blood flow in the ipsilateral M1 over 20% indicates a failure in the balloon occlusion test. This is consistent with the clinical outcomes of both patients, i.e., patient 1 tolerated the balloon occlusion but patient 2 did not.
Click to view | Table 7. The Balloon Occlusion Simulation for Patient 1 and Patient 2 |
| Discussion | ▴Top |
We have described a new multi-staged algorithm to estimate the arterial stiffness, the ascending aorta pressure, and the terminal resistance distribution for the enhanced sector model using non-invasive data from both qMRA and cuff pressure. Moreover, we have successfully applied the proposed computer model to predict the clinical outcomes of the BOT for two patients. This 1D pulsatile flow model consists of 156 distensible vessel segments where the stiffness parameter β was used to represent the compliance of the arterial wall. The model uses 13 sectors to model the terminal resistances in the 13 regions including both the cerebral circulation and the systemic circulation.
The parameters estimated with the multi-staged algorithm were put into the computer model and we have successfully applied the enhanced computer model to simulate two patients undergoing a BOT, and were able to predict the clinical outcomes of the two BOTs. The results of the stiffness parameter are consistent with the age of the patients, i.e., the higher the stiffness parameter, the stiffer the artery. The aortic pressure obtained from the simulation was compared with the actual aortic pressure measurement from the catheter transducer and the results have shown great concordance in the shapes of the waveform.
Our model did not consider auto-regulation [11, 22] and also did not simulate the hypotensive challenge used during the BOT [4]. Limitations of the present study were that the volume flows in the ophthalmic artery, middle meningeal artery, and other pial collaterals were assumed to be negligible. Future work towards the enhancement of the computer model will need to include auto-regulation [11, 22] and develop a new model to be able to simulate the hypotensive challenge.
In conclusion, the following patient-specificity has been achieved with the multi-staged algorithm: the stiffness coefficient, the ascending aortic pressure, and the terminal resistance distribution using non-invasive data from both qMRA and the cuff pressure.
Acknowledgments
The work was supported by University of Illinois at Chicago Clinical Translational Science Awards. The authors gratefully acknowledge Christa Wellman for her art work in Figure 1 and also Jimmy Li’s help in getting the references as well as Dr. Xixi Zhao’s editing and her valuable comments. This paper is dedicated to Professor Marlyn Earl “M.E.” Clark, professor emeritus of Theoretical and Applied Mechanics, University of Illinois at Urbana-Champaign, who passed away on November 18, 2010, at age 88. Professor Clark pioneered the cerebral blood flow research in the Circle of Willis which led to this work.
Conflicts of Interest
The following authors have conflicts of interest to report: Meide Zhao: share holder of VasSol, Inc. Marlyn E. Clark: share holder of VasSol, Inc. Xinjian Du: consultant of VasSol, Inc. Fady T. Charbel: share holder of VasSol, Inc. The following authors have no conflicts of interest to report: Robert Kufahl, Sepideh Amin-Hanjani, Victor Aletich, and Ali Alaraj.
| References | ▴Top |
- Ursino M. Cerebrovascular modelling: a union of physiology, clinical medicine and biomedical engineering. Med Eng Phys. 2003;25(8):617-620.
doi - Orosz L, Hoksbergen AW, Molnar C, Siro P, Cassot F, Marc-Vergnes JP, Fulesdi B. Clinical applicability of a mathematical model in assessing the functional ability of the communicating arteries of the circle of Willis. J Neurol Sci. 2009;287(1-2):94-99.
doi pubmed - Clark ME, Zhao M, Loth F, Alperin N, Sadler L, Guppy K, Charbel FT. A patient-specific Computer Model for Prediction of Clinical Outcomes in the Cerebral Circulation Using MR Flow Measurements. Medical Image Computing and Computer-Assisted Intervention - MICCAI'99, Cambridge, UK, September 19-22, Lecture Notes in Computer Science, 1999, Volume 1679/1999, 368-377.
doi - Charbel FT, Zhao M, Amin-Hanjani S, Hoffman W, Du X, Clark ME. A patient-specific computer model to predict outcomes of the balloon occlusion test. J Neurosurg. 2004;101(6):977-988.
doi pubmed - Kufahl RH, Clark ME. A circle of Willis simulation using distensible vessels and pulsatile flow. J Biomech Eng. 1985;107(2):112-122.
doi - Roessler FC, Reith W, Siegel G. Simulation of cerebral hemodynamics for preoperative risk assessment. Brain Res. 2006;1118(1):183-191.
doi pubmed - Zagzoule M, Marc-Vergnes JP. A global mathematical model of the cerebral circulation in man. J Biomech. 1986;19(12):1015-1022.
doi - Stergiopulos N, Young DF, Rogge TR. Computer simulation of arterial flow with applications to arterial and aortic stenoses. J Biomech. 1992;25(12):1477-1488.
doi - Olufsen MS. Structured tree outflow condition for blood flow in larger systemic arteries. Am J Physiol. 1999;276(1 Pt 2):H257-268.
pubmed - Wan J, Steele B, Spicer SA, Strohband S, Feijoo GR, Hughes TJ, Taylor CA. A one-dimensional finite element method for simulation-based medical planning for cardiovascular disease. Comput Methods Biomech Biomed Engin. 2002;5(3):195-206.
doi pubmed - David T, Brown M, Ferrandez A. Auto-regulation and blood flow in the cerebral circulation. Int J Numer. Method Fluid. 2003;43:701-713.
doi - Formaggia L, Lamponi D, Tuveri M, Veneziani A. Numerical modeling of 1D arterial networks coupled with a lumped parameters description of the heart. Comput Methods Biomech Biomed Engin. 2006;9(5):273-288.
doi pubmed - Alastruey J, Parker KH, Peiro J, Byrd SM, Sherwin SJ. Modelling the circle of Willis to assess the effects of anatomical variations and occlusions on cerebral flows. J Biomech. 2007;40(8):1794-1805.
doi pubmed - Devault K, Gremaud PA, Novak V, Olufsen MS, Vernieres G, Zhao P. Blood Flow in the Circle of Willis: Modeling and Calibration. Multiscale Model Simul. 2008;7(2):888-909.
doi pubmed - Kim HJ, Vignon-Clementel IE, Figueroa CA, LaDisa JF, Jansen KE, Feinstein JA, Taylor CA. On coupling a lumped parameter heart model and a three-dimensional finite element aorta model. Ann Biomed Eng. 2009;37(11):2153-2169.
doi pubmed - Olufsen MS, Ottesen JT, Tran HT, Ellwein LM, Lipsitz LA, Novak V. Blood pressure and blood flow variation during postural change from sitting to standing: model development and validation. J Appl Physiol (1985). 2005;99(4):1523-1537.
doi pubmed - Moore S, David T, Chase JG, Arnold J, Fink J. 3D models of blood flow in the cerebral vasculature. J Biomech. 2006;39(8):1454-1463.
doi pubmed - Moore SM, Moorhead KT, Chase JG, David T, Fink J. One-dimensional and three-dimensional models of cerebrovascular flow. J Biomech Eng. 2005;127(3):440-449.
doi pubmed - Blanco PJ, Pivello MR, Urquiza SA, Feijoo RA. On the potentialities of 3D-1D coupled models in hemodynamics simulations. J Biomech. 2009;42(7):919-930.
doi pubmed - Cebral JR, Castro MA, Soto O, Lohner R, Alperin N. Blood-flow models of the circle of Willis from magnetic resonance data. Journal of Engineering Mathematics. 2003;47:369-386.
doi - Cebral JR, Castro MA, Appanaboyina S, Putman CM, Millan D, Frangi AF. Efficient pipeline for image-based patient-specific analysis of cerebral aneurysm hemodynamics: technique and sensitivity. IEEE Trans Med Imaging. 2005;24(4):457-467.
doi pubmed - Ursino M, Giannessi M. A Model of Cerebralvascular Reactivity Including the Circle of Willis and Cortical Ansatomoses. Annuals of Biomedical Engineering. 2010;38(3):955-974.
doi pubmed - Spilker RL, Taylor CA. Tuning Multidomain Hemodynamic Simulation to Match Physiological Measurements. Annuals of Biomedical Engineering. 2010;38(8):2635-2648.
doi pubmed - Zhao M, Amin-Hanjani S, Ruland S, Curcio AP, Ostergen L, Charbel FT. Regional Cerebral Blood Flow Using Quantitative MR Angiography. American Journal Neuroradiology. 2007;28:1470-1473.
doi pubmed - Zhao M, Charbel FT, Alperin N, Loth F, Clark ME. Improved phase-contrast flow quantification by three-dimensional vessel localization. Magn Reson Imaging. 2000;18(6):697-706.
doi - Hayashi K, Handa H, Nagasawa S, Okumura A, Moritake K. Stiffness and Elastic Behavior of Human Intracranial and External Arteries. Biomechanics. 1980;13:175-184.
doi - O'Rourke MF, Staessen JA, Vlachopoulos C, Duprez D, Plante GE. Clinical applications of arterial stiffness; definitions and reference values. Am J Hypertens. 2002;15(5):426-444.
doi - Laurent S, Cockcroft J, Van Bortel L, Boutouyrie P, Giannattasio C, Hayoz D, Pannier B, et al. Expert consensus document on arterial stiffness: methodological issues and clinical applications. Eur Heart J. 2006;27(21):2588-2605.
doi pubmed
This article is distributed under the terms of the Creative Commons Attribution Non-Commercial 4.0 International License, which permits unrestricted non-commercial use, distribution, and reproduction in any medium, provided the original work is properly cited.
Journal of Neurology Research is published by Elmer Press Inc.