


| Journal of Neurology Research, ISSN 1923-2845 print, 1923-2853 online, Open Access |
| Article copyright, the authors; Journal compilation copyright, J Neurol Res and Elmer Press Inc |
| Journal website http://www.neurores.org |
Original Article
Volume 4, Number 1, February 2014, pages 7-14
Color-Coded Microspheres and Histological Analysis for Cerebral Mapping: An Experimental Model
Judith Bellaparta, j, Kylie Cuthbertsonb, Joana Skermanb, Kimble R. Dunsterc, Sara Diabc, David G. Plattsd, Christopher Raffeld, Levon Gabrieliane, Marc O. Maybauerc, f, g, Adrian Barnetth, Rob Bootsa, John F. Fraserc, h, i
aIntensive Care Department, Royal Brisbane and Women’s Hospital, Burns-Trauma & Critical Care Research Centre, The University of Queensland, Herston, QLD, Australia
bHistopathology Department, Royal Brisbane and Women’s Hospital, QLD, Australia
cMedical Engineering Research Facility, Queensland University of Technology, QLD, Australia
dDepartment of Cardiology, The Prince Charles Hospital, QLD, Australia
eMedical School Research Centre, Adelaide, South Australia, Australia
fCardiothoracic Anaesthesia and Intensive Care, Oxford Heart Centre, Oxford University Hospitals, Oxford, UK
gDepartment of Anaesthesiology and Intensive Care, Philipps University, Marburg, Germany
hInstitute of Health and Biomedical Innovation & School of Public Health and Social Work, Queensland University of Technology, QLD, Australia
iIntensive Care Department, The Prince Charles Hospital and Medical Engineering Research Facility, Queensland University of Technology, QLD, Australia
jCorresponding author: Judith Bellapart-Rubio, Intensive Care Department, Royal Brisbane and Women’s Hospital, Butterfield Street, Herston, 4025, QLD, Australia
Manuscript accepted for publication December 27, 2013
Short title: Cerebral Histology and Flow
doi: https://doi.org/10.14740/jnr256w
| Abstract | ▴Top |
Background: The integration of histology and microcirculation in real time through specific regions of the brain is a challenging concept that has not been reported before. This study describes for first time a brain-mapping model that superimposes regional microvascular blood flow (RMBF) analysis with immunohistochemistry analysis in an experimental ovine model.
Methods: Five Merino sheep were instrumented, ventilated and cardiovascularly supported according to local guidelines. Two ultrasound catheter sheaths were inserted into the right internal jugular vein for the introduction of an intracardiac echocardiography probe and transeptal catheter, as previously described. For the analysis of RMBF, color-coded microspheres were injected into the left atrium while a reference blood sample was extracted from the femoral artery. After euthanasia and fixation with formalin, the brain was used as proof of principle and the endpoint for determination of microcirculation and histology analysis at different time points. An antero-posterior slicing strategy of the sheep brain differentiated even-numbered from odd-numbered slices. For the histology analysis, immunohistochemistry applied to odd-numbered slices used amyloid precursor protein (APP) antibodies and hematoxylin-eosin staining. Simultaneously, even-numbered slices were dedicated for cytometric quantification of RMBF.
Results: Homogeneous allocation of microspheres to different regions of the brain over time with no statistical difference between slices and RMBF count was found. In addition, immunohistochemistry showed baseline staining, confirming a state of normal cerebral perfusion.
Conclusions: This study has demonstrated the feasibility and reproducibility of a brain-mapping model that superimposes RMBF data and immunohistochemistry data over time, establishing a new experimental model.
Keywords: Histology; Cerebral microcirculation; Microspheres and APP staining
| Introduction | ▴Top |
The study of regional microvascular blood flow (RMBF) using microspheres has been a focus of research from several decades [1]. Multiple developments within its methodology have led to the optimization in the assessment of microcirculation [2, 3]. Recently, the description of a novel approach to the injection of microspheres [4] demonstrated the feasibility of a transeptal injection of microspheres, showing their homogeneous distribution to several areas of the brain and other systemic tissues over time. A fundamental interest of the study on cerebral microcirculation lies upon its dynamic nature and its influence on metabolic and tissue processes. This latter aspect offers information about the interaction between microvasculature and neuronal function, which is applicable in many fields of research. However, the study of such interaction has been limited by the absence of early markers of neuronal dysfunction in order to correlate more accurately changes in microcirculation with tissue changes.
Over the past years, a growing emphasis in the description of early markers of cerebral damage has led to the use of amyloid precursor protein (APP) staining. APP is a neuronal ubiquitous protein with an essential role in the neuronal response to trauma [5-7]. APP matures under glycosylation as it is transported through the neuronal axon [8]. In pathological situations, axonal disruption can be histologically graded by quantification of APP with the use of immunohistochemistry [9-13]. Experimental studies have shown APP expression to be upregulated after traumatic brain injury around the site of damage, in neuronal perikarya and in damaged dystrophic neurites [14]. Antibodies designed to target specific regions of APP have detected the presence of APP in a number of difference disease processes including axonal injury [15] detecting regions where neuronal damage has occurred. Conversely, a low expression of APP reflects histological integrity [16] and the absence of tissue damage. In addition to APP quantification, more basic histology assessments such as hematoxylin-eosin (H&E) staining, offer general information about the integrity of the cellular nuclei, their cytoplasm and other extracellular matrix features [17]. This is a fast and accurate staining that in combination with APP labeling and a real-time assessment of RMBF offers unique and novel information about the interaction between brain function and cerebral microcirculation.
The aim of this study is to combine the analysis of cerebral microcirculation in real time using color-coded microspheres with histology findings assessed by APP antibodies and H&E staining by superimposing these markers using a novel brain-mapping model.
| Materials and Methods | ▴Top |
Animal care and preparation
After study approval by the Animal Ethics Committee of the Queensland University of Technology, five male sheep of the Merino breed, weighing 65 ± 6.01 kg, were instrumented inserting one triple lumen central line (Cook Medical Inc., QLD, Australia) and two 16-Fr introducer sheaths in the right internal jugular vein, under local anesthesia. Via the central line, general anesthesia was given using ketamine at a maintenance dose of 0.5 - 1 mg/kg, midazolam infusion at a rate of 0.5 mL/kg and buprenorphine at 0.01 mg/kg. Administration of a Hartmann’s solution to ensure hydration was then commenced at a rate of 2 mL/kg/h, titrated to a central venous pressure of 6 - 10 mmHg. Orotracheal intubation followed using a size 10 mm endotracheal tube (SIMS Portex, UK). Under anesthesia, sheep were ventilated delivering 8 mL/kg tidal volumes, rate of 12 breaths per minute, PEEP 5 cmH2O and initial FiO2 of 1.0. Inspired partial pressure of oxygen was titrated to maintain partial pressure of oxygen (PaO2) of > 95 mmHg. A femoral arterial catheter was inserted using a Seldinger technique, to ensure continuous blood pressure monitoring. Two burr holes were performed following described guidelines [18] and two 16-Fr intravenous cannulas were inserted through the burr holes to simulate intracranial pressure and oximetry monitoring probes. These probes penetrated to a 35 mm depth corresponding to an area of white matter. The intention of this simulation was to reproduce future interventions during the pilot phase in order to recreate histological changes that may occur as a result of the instrumentation and not the injury itself.
Finally, an insertion of a transeptal catheter inside the left atrium was placed by two interventional cardiologists, under intracardiac echocardiography surveillance, as previously described [4].
Protocol for microspheres injection
After insertion of the transeptal catheter and confirmation of its correct positioning, hourly injection of color-coded microspheres (E-Z TRAC; Interactive Medical Technology, Los Angeles, CA) used the following protocol. After a thorough mixing of the spheres, 0.8 mL was drawn containing 4 million spheres. The transeptal catheter line was then flushed over a 10 s injection approximately 20 s after the commencement of the withdrawal pump which was removing blood during a total period of 2 min [19].
Aspects of the injection of color-coded microspheres
Approximately 4 million color-coded spheres of 15 µm diameter each were injected at each hour, using a 1 mL syringe and a saline flush after injection. Randomly assigned colors were attributed to each injection time in order to minimize selection biases, as previously described [20, 21]. For each hour at five time points, five different colors were chosen. Microspheres had been preserved at room temperature and not exposed to sunlight, heating or vibration in line with manufacturer instructions. The microspheres were mixed using a manual technique in order to minimize foaming and avoid unequal concentration of spheres in each injection.
Euthanasia and post-mortem tissue manipulation
After 5 h of continuous monitoring and microsphere injection, the sheep were euthanized under non-recovered anesthesia, with the injection of 0.5 mL/kg of Lethabarb (sodium pentobarbitone). After confirmation of death, a craniotomy was performed for brain harvesting. The brain was weighed followed by fixation in 10% formalin for 3 weeks. Samples from skin, gut and heart were taken from the last sheep to confirm systemic distribution of microspheres. After fixation, the brains were sectioned in 5 mm slices and numerically labeled in an antero-posterior direction. Such strategy aimed to incorporate RMBF data with adjacent histological data and it was designed after consensus from all clinical investigators. This design is based on the designation of all even-numbered slices processed for cytometric count while odd-numbered slices were assigned for histopathology analysis (Fig. 1). This design has not been reproduced before and aimed to integrate real-time microcirculation data with adjacent histology data in targeted areas of the brain.
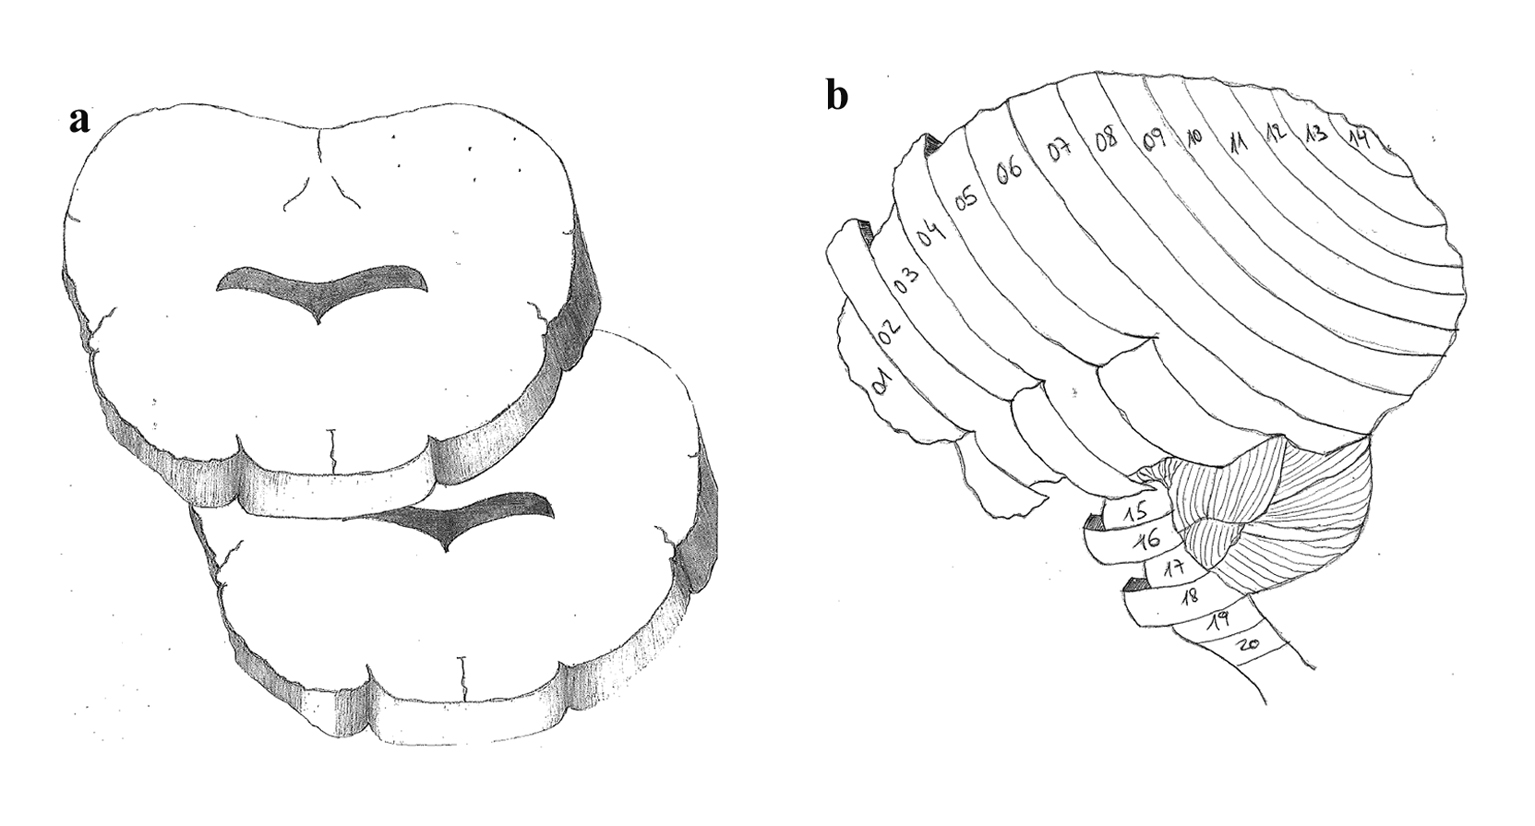 Click for large image | Figure 1. (a) Brain slicing model with axial cutting. (b) Antero-posterior slicing of 5 mm sections throughout the brain in a sagital view. |
Paraffin embedding for sheep brains
For the odd-numbered brain blocks dedicated for histological analysis, tissue was processed using a Leica Peloris tissue processor. The total processing time was 120 h. Each stage, excluding the wax stages, was performed at 35 °C. Brain slices were blocked in paraffin wax and cooled on an ice plate. Blocked paraffin brains were sectioned at 8 µm on a Leica RM2235 manual rotary microtome (Leica Microsystems Pty Ltd, North Ryde, Australia). Sections were floated on a water bath at 35 °C, collected on silanized activated slides and dried overnight. Sections were then used for immunohistochemistry.
Immunohistochemistry processing
Immunohistochemistry used a Leica Novolink polymer detection systems kit (Leica Microsystems Pty Ltd, North Ryde, Australia) as per manufacturer’s instructions. Sections had paraffin removed through a series of xylene immersions and then re-hydrated through graded alcohols and washed in di-H2O. Antigen retrieval was carried out using Leica BOND ER1 solution for 20 min at 100 °C. Slides were washed for 5 min in di-H2O. Endogenous peroxidise was neutralized using peroxidase block for 5 min. Following incubation, the sections were washed in phosphate buffered saline (PBS) (2 × 5 min washes). Sections were incubated with protein block for 5 min and washed again in PBS (2 × 5 min washes). The primary antiserum made up in Leica BOND antibody diluent (1:40,000) was applied to the sections for 30 min. Following incubation, the sections were washed in PBS (2 × 5 min washes) and incubated with post-primary for 30 min. After incubation, slides were washed in PBS (2 × 5 min washes) and incubated with Novolink polymer for 30 min and then washed in PBS (2 × 5 min with gentle rocking on an orbital shaker). 3-3'-diaminobenzidine working solution was applied to the slides for 1 min. Slides were washed in di-H2O, counterstained with Mayers hematoxylin for 1 min and washed in di-H2O for 5 min before dehydration, clearing and mounting.
Immunohistochemistry and H&E scoring and interpretation
Immunohistochemistry analysis was applied to the five sheep brains for the baseline presence and location of APP antibodies. A grading system measuring the presence of APP was developed and structured into three qualitative categories dependent upon the severity of injury seen: 1) mild: injury pattern characterized by a focal contusion with APP labeling limited to the site of injury or focal APP labeling; 2) moderate: injury pattern characterized by a pattern of APP staining greater than one hemisphere, greater than half a hemisphere or less than half a hemisphere; 3) severe: injury pattern characterized for the presence of diffuse staining; and sub-classified as either of the following: diffuse vascular injury, diffuse axonal injury with macroscopic hemorrhage, diffuse axonal injury with microscopic hemorrhage/tissue tears or diffuse axonal injury only.
Quantification of cerebral blood flow
Even-numbered blocks were reserved for cytometric analysis of RMBF. Cytometric count of spheres allows calculation of RMBF through a process that includes: the known microspheres concentration injected into the arterial supply of an organ and a “reference sample of blood” - this refers to an arterial blood sample withdrawn at a known rate during a known length of time [22]. This way, RMBF will be proportional to the number of microspheres trapped in the targeted tissue in relation to the total quantity of spheres per mL of blood per minute and corresponds to the equation:
RMBF (mL/min/g) = (total tissue spheres)/[(tissue weight, g) × (reference spheres/mL/min)] [23].
Brain-mapping model
A novel design of sheep brains sectioned in blocks and numbered in an alternate order was created with the intention of simultaneously interpreting RMBF and histological findings (Fig. 1). Fine subsections had been performed after fixation, with the aim of superimposing RMBF results with histological data, as adjacent slices were only separated by 5 µm of distance, corresponding to the same macroscopic anatomical area within the brain.
Statistical analysis
RMBF analysis
Cytometric counts for each time and slice were averaged. Means for each time and for the difference between each time point from baseline were also calculated. To test for any statistically significant differences, the differences from baseline were regressed against time (as a categorical variable) using linear regression with time as the independent variable. These regressions were performed for each sheep. All analysis was performed using the R software (www.r-project.org).
To assess the significance of the apparent RMBF variability at different time points with respect to the baseline, estimates from a mixed model showed that the confidence interval of the mean baseline difference in RMBF over time (Fig. 2) does include zero, which means that despite the visual variability, this was not statistically significant. A mixed model showed confidence interval crossed zero for RMBF throughout the slices (Fig. 3) and among individual sheep (Fig. 4), indicating absence of a statistically significant difference.
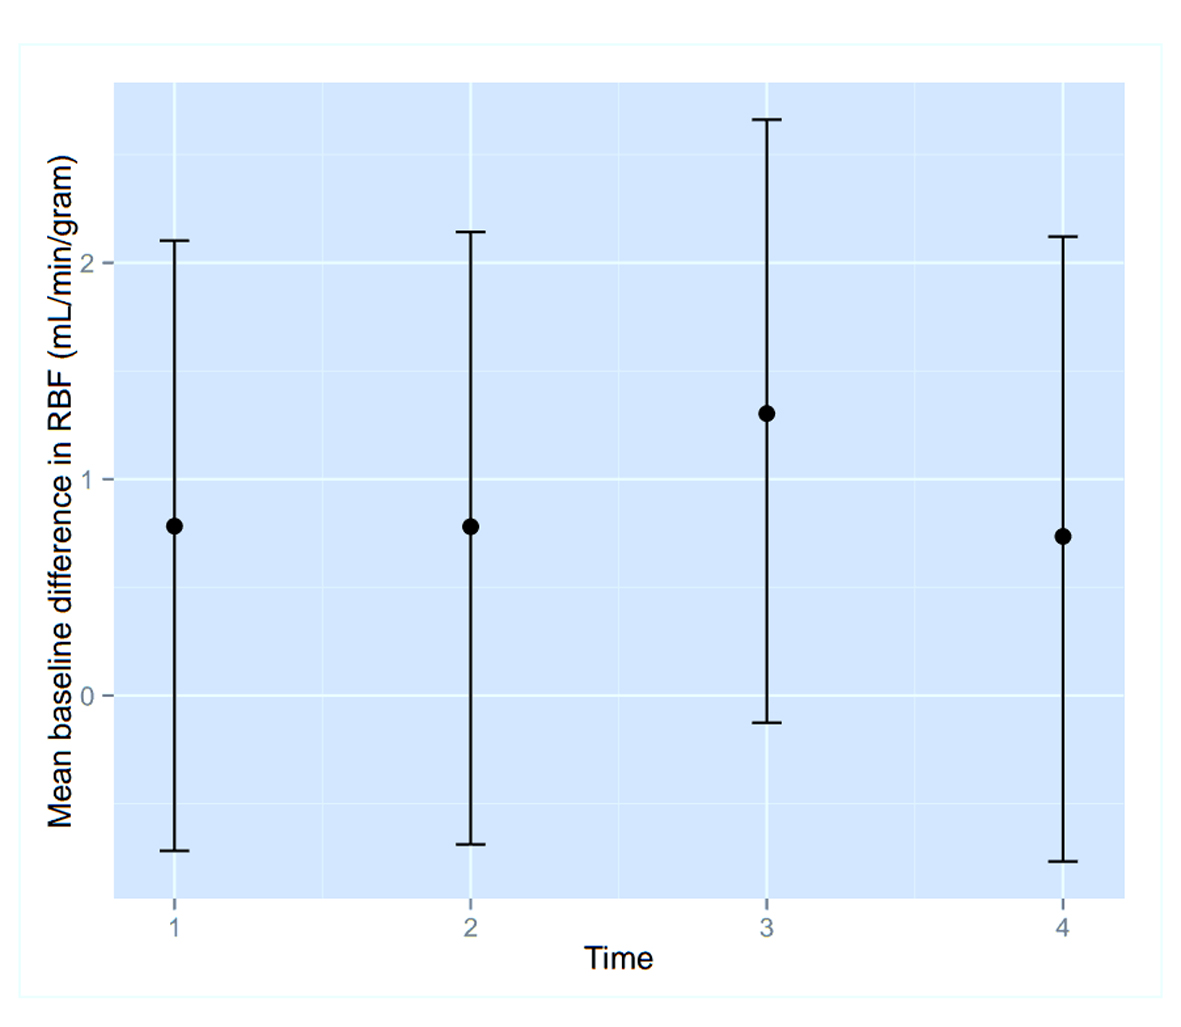 Click for large image | Figure 2. Confidence interval of RMBF over time points. |
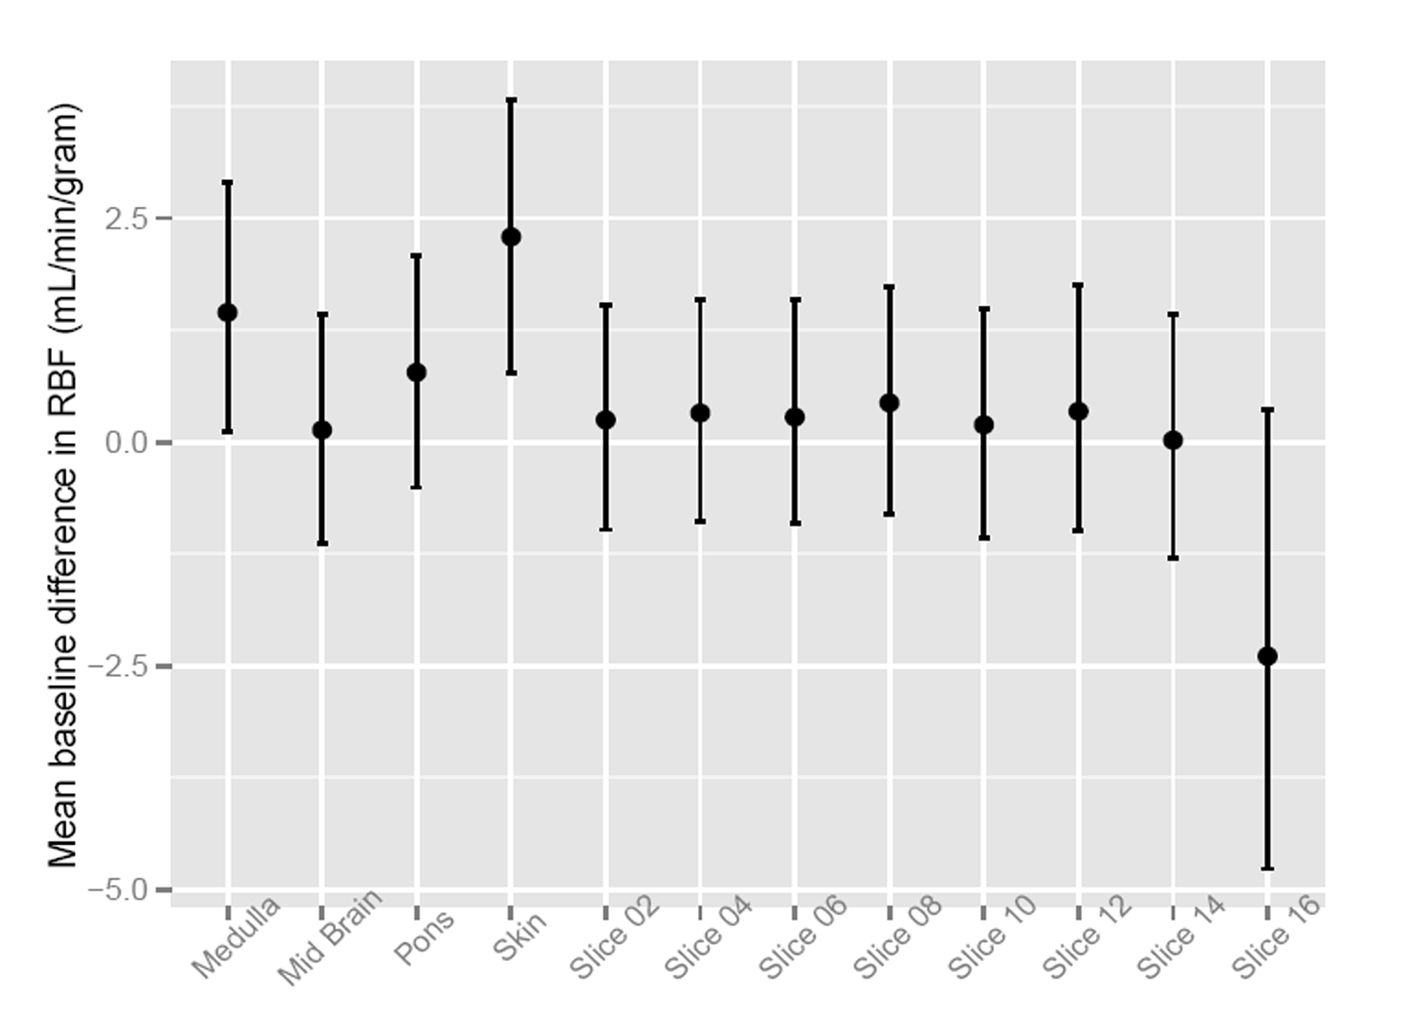 Click for large image | Figure 3. Confidence interval of RMBF over brain slices. |
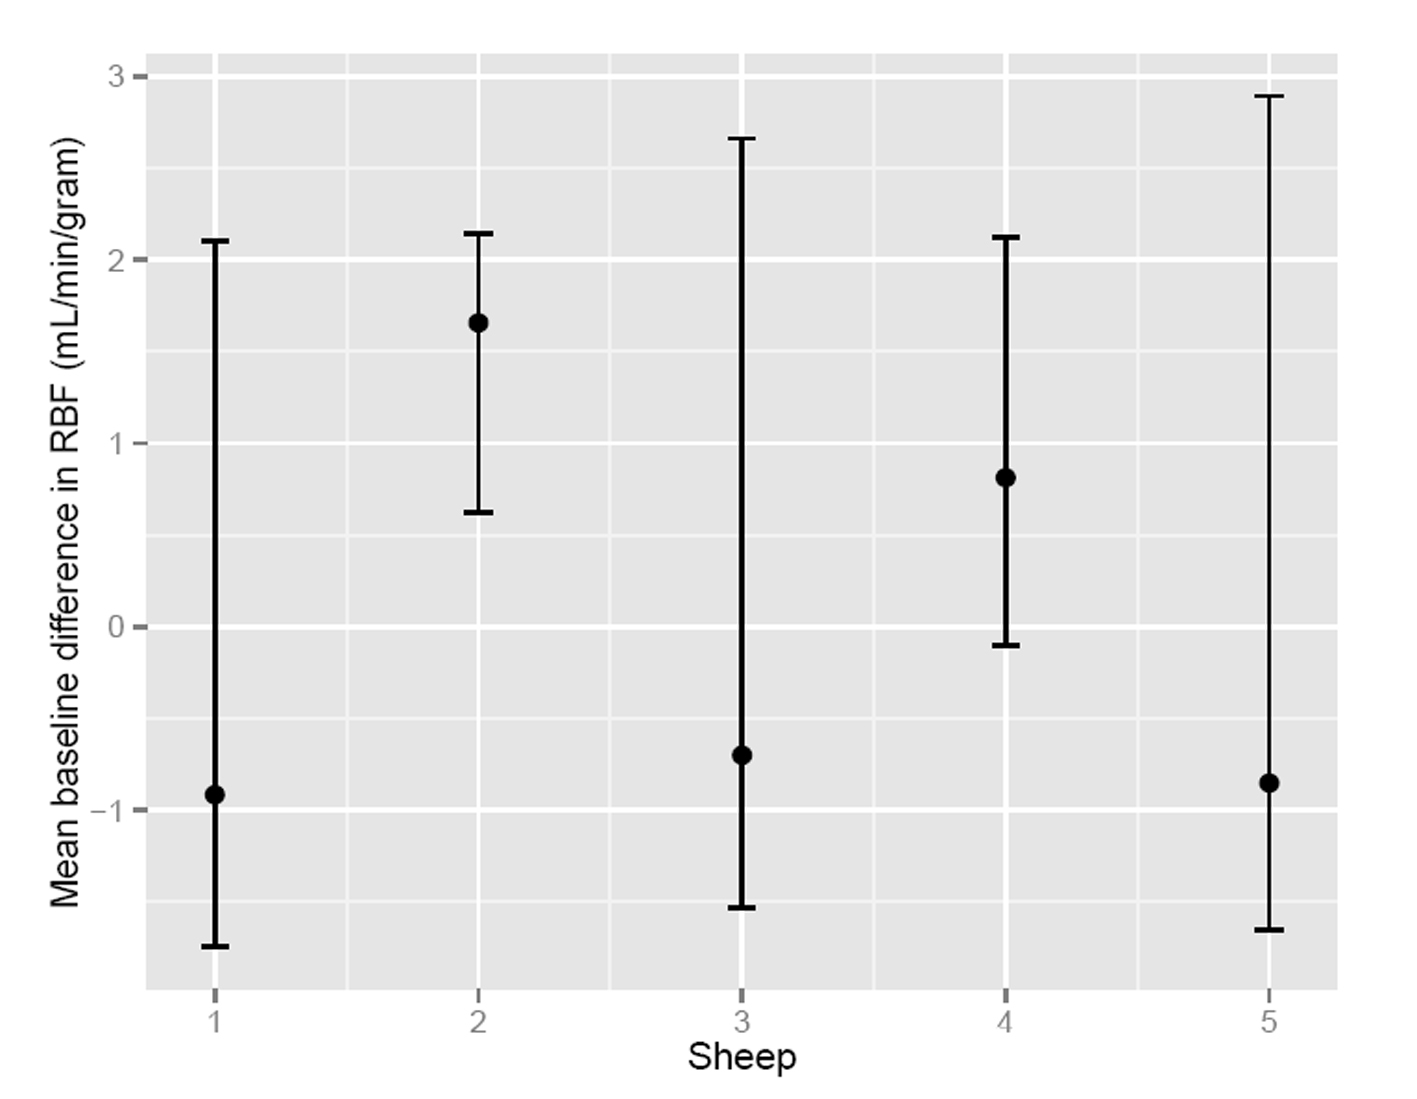 Click for large image | Figure 4. Confidence interval of RMBF among subjects. |
| Results | ▴Top |
Immunohistology data
Odd-numbered brain slices were stained with H&E and demonstrated a normal range of nuclear, cytoplasmic and extracellular matrix features (Fig. 5a, b). Additional APP positive staining was seen around sites of injury (Fig. 6a, b), these sites corresponding to areas of injury caused from the brain instrumentation only. In non-injured brain regions, there was no APP labeling. All slices and subjects demonstrated a mild H&E scoring. No significant histological differences were found among slices and among subjects. H&E staining also demonstrated in some slices, the presence of intravascular microspheres (Fig. 7). There was no evidence of microspheres in brain parenchyma or occluding the vessel lumens.
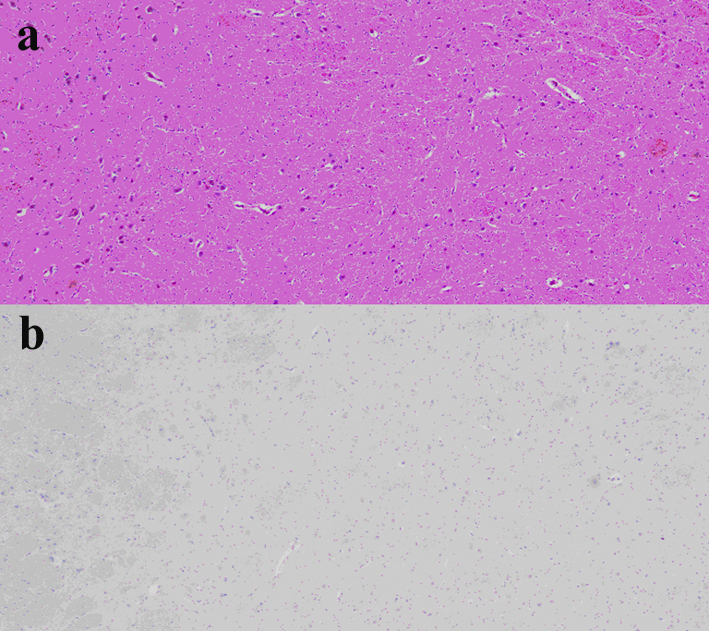 Click for large image | Figure 5. (a) Representation of H&E staining of a normal brain slice. Slice corresponding to frontal lobes at the deep gray matter including “pencil” white matter tracts. (b) Same slice after APP staining with negative APP immunohistochemical staining indicating no axonal injury. |
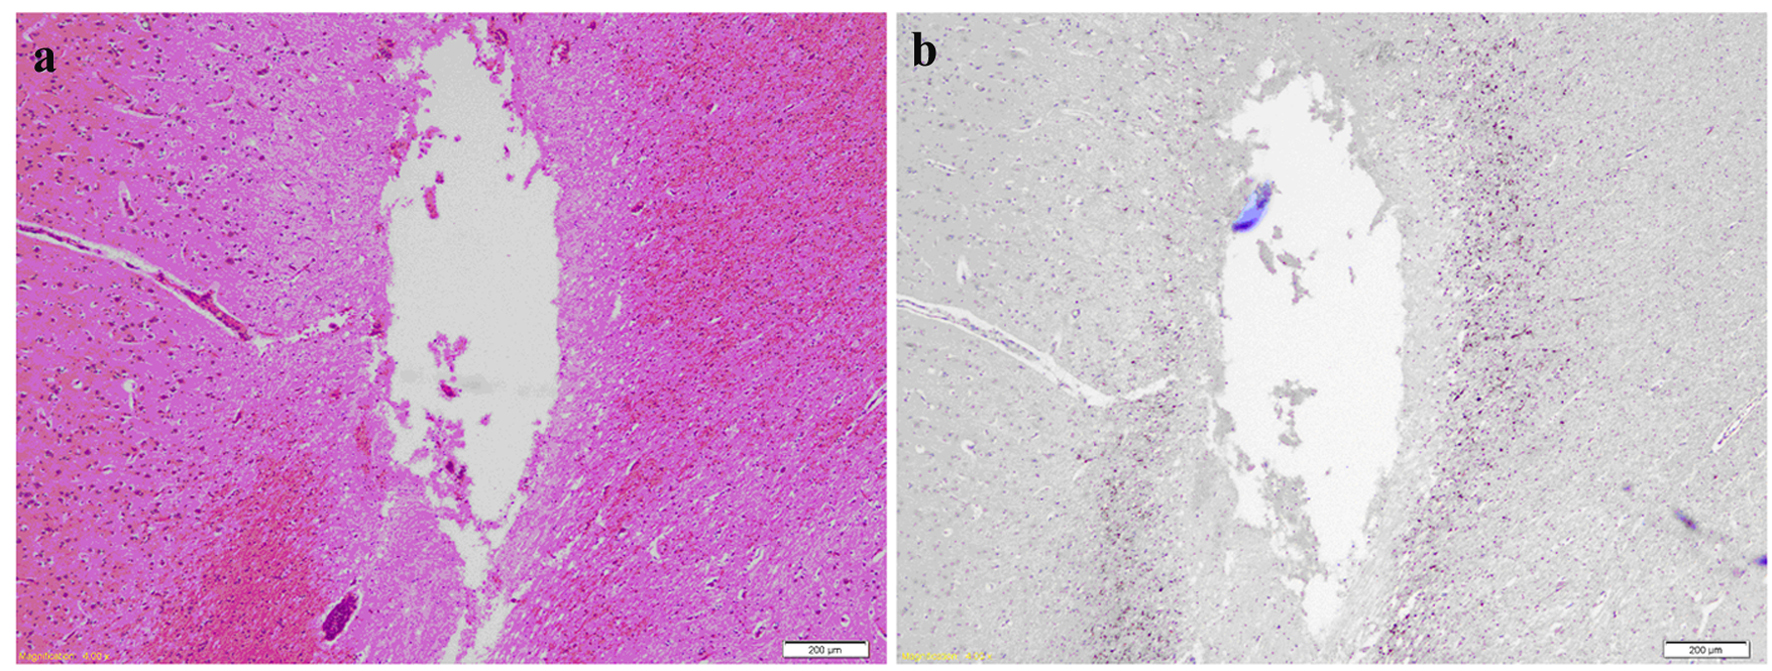 Click for large image | Figure 6. (a) H&E of brain slice at the fronto-parietal region showing a needle track cavity with fragments of necrotic brain and surrounding penumbra of pale edematous brain. (b) Same slice after APP staining highlighting axonal injury around the necrotic needle track. |
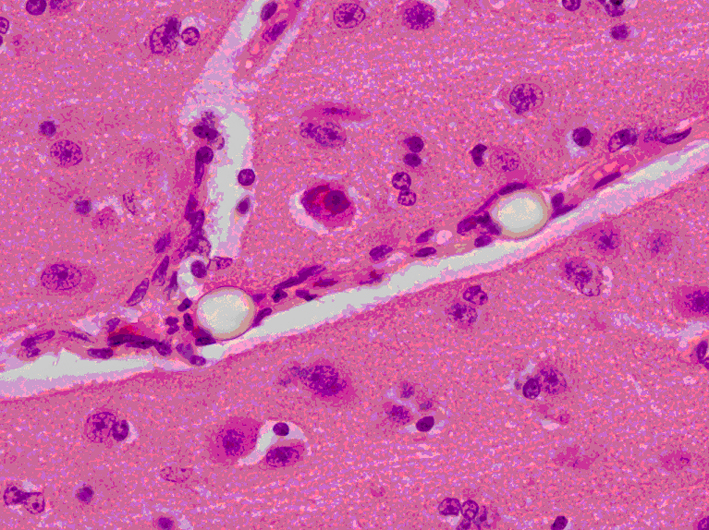 Click for large image | Figure 7. Brain slice at the parietal region showing two clear refractile microspheres trapped in a small cerebral vessel that runs diagonally across the image. The surrounding gray matter appears normal (H&E stain × 400 magnification). |
RMBF data
Even-numbered brain slices showed the following RMBF range: slice 02: 0.57 - 1.02 mL/min/g; slice 04: 0.45 - 1.42 mL/min/g; slice 06: 0.35 - 1.87 mL/min/g; slice 08: 0.46 - 1.77 mL/min/g; slice 10: 0.34 - 1.28 mL/min/g; slice 12: 0.35 - 1.58 mL/min/g; slice 14: 0.29 - 1.15 mL/min/g. RMBF measurements within the midbrain showed a range of 0.45 - 0.76 mL/min/g. RMBF in the pons showed a range of 0.64 - 2.28 mL/min/g. RMBF at the medulla showed a range of 0.66 - 4.8 mL/min/g (Table 1). No significant RMBF differences were found among slices and between sheep.
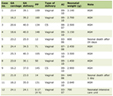 Click to view | Table 1. RMBF Means (Standard Deviations) by Each Brain Slice Over Time (T), Expressed in mL/min/g |
| Discussion | ▴Top |
This study demonstrates for first time the feasibility of combining RMBF mapping with histological mapping in baseline conditions, in an experimental ovine model. The investigators have shown that a model of antero-posteriorly oriented 5 mm slices of Merino brains is reproducible and consistently reproduces comparable anatomical regions. In addition, this study shows that the comparison of adjacent odd- and even-numbered brain blocks represents the same anatomical region. This facilitates simultaneously superimposition of anatomical and RMBF information in real time. RMBF data in a specific region of the brain are quantified and tracked over time with the adjacent histological findings reflecting early markers of neuronal, glial and axonal damage. The correlation between RMBF and histological data integrates the relationship between cerebral blood flow and tissue integrity. This is a very relevant concept as direct assessment of histopathological changes related to flow disturbances in specific brain regions becomes independent of other insults. In addition, it identifies the time point when flow changes may have occurred allowing calculation of the timing of a perfusion-related injury.
The results of this study also show that immersion fixation using formalin does not alter the integrity of color-coded microspheres, APP labeling or H&E staining. However, as the microspheres diameter is 15 µm, RMBF must be separately quantified from the immunohistochemistry analysis. The use of thinner slices would result in repeated counting of microspheres once as they are trapped and embedded throughout different consecutive slices. The immersion fixation does not affect our immunohistochemical assessment of injury.
This study also demonstrates that RMBF was found to be both temporally and spatially homogeneous throughout different areas of the brain (Table 1). Similarly, immunohistochemistry analysis also found homogeneous staining without histology indicators of damage (Fig. 5). A single area of damage identified in the site of an intra-cerebral monitoring probe insertion (Fig. 6) was shown as an APP labeled foci not related to any blood flow disturbance when simultaneous RMBF data were superimposed. This finding supports the utility of the model in comparing RMBF with histology.
In summary, this study has designed a novel brain-mapping model that superimposes histology data and microcirculation data in real time. This study demonstrates that common tissue processing techniques do not compromise further immunohistochemistry analysis or microspheres count, in an experimental ovine model.
Acknowledgments
The investigators would like to thank Dr Thomas Robertson (Director of Neuro-pathology Laboratory, Royal Brisbane and Women’s Hospital, QLD, Australia) as well as Ms Janette Thurley (supervising Scientists) for their contribution in the processing of brain slices, their advice during the design and preservation of the animals’ brain, the immunohistochemistry analysis and the histology scoring design. Finally, we would like to acknowledge the Study Education & Research Trust Fund (SERTF) for their source of funding dedicated to the histological analysis and to the Royal Brisbane and Women’s Hospital Research Foundation Grant funding offered in 2012 which allowed the completion of this study.
Competing Interest
None declared.
| References | ▴Top |
- Rudolph AM, Heymann MA. The circulation of the fetus in utero. Methods for studying distribution of blood flow, cardiac output and organ blood flow. Circ Res. 1967;21(2):163-184.
doi pubmed - Prinzen FW, Glenny RW. Developments in non-radioactive microsphere techniques for blood flow measurement. Cardiovasc Res. 1994;28(10):1467-1475.
doi - Bassingthwaighte JB, Malone MA, Moffett TC, King RB, Chan IS, Link JM, Krohn KA. Molecular and particulate depositions for regional myocardial flows in sheep. Circ Res. 1990;66(5):1328-1344.
doi pubmed - Bellapart J, Dunster KR, Diab S, Platts DG, Raffel C, Gabrielian L, Maybauer MO, et al. Intracardiac echocardiography guided transeptal catheter injection of microspheres for assessment of cerebral microcirculation in experimental models. Cardiol Res Pract. 2013;2013:595838.
- Bendotti C, Forloni GL, Morgan RA, O'Hara BF, Oster-Granite ML, Reeves RH, Gearhart JD, et al. Neuroanatomical localization and quantification of amyloid precursor protein mRNA by in situ hybridization in the brains of normal, aneuploid, and lesioned mice. Proc Natl Acad Sci U S A. 1988;85(10):3628-3632.
doi pubmed - Card JP, Meade RP, Davis LG. Immunocytochemical localization of the precursor protein for beta-amyloid in the rat central nervous system. Neuron. 1988;1(9):835-846.
doi - Farber SA, Nitsch RM, Schulz JG, Wurtman RJ. Regulated secretion of beta-amyloid precursor protein in rat brain. J Neurosci. 1995;15(11):7442-7451.
pubmed - Mattson MP, Cheng B, Culwell AR, Esch FS, Lieberburg I, Rydel RE. Evidence for excitoprotective and intraneuronal calcium-regulating roles for secreted forms of the beta-amyloid precursor protein. Neuron. 1993;10(2):243-254.
doi - Lewis SB, Finnie JW, Blumbergs PC, Scott G, Manavis J, Brown C, Reilly PL, et al. A head impact model of early axonal injury in the sheep. J Neurotrauma. 1996;13(9):505-514.
doi pubmed - Gentleman SM, Nash MJ, Sweeting CJ, Graham DI, Roberts GW. Beta-amyloid precursor protein (beta APP) as a marker for axonal injury after head injury. Neurosci Lett. 1993;160(2):139-144.
doi - Gentleman SM, Roberts GW, Gennarelli TA, Maxwell WL, Adams JH, Kerr S, Graham DI. Axonal injury: a universal consequence of fatal closed head injury? Acta Neuropathol. 1995;89(6):537-543.
doi pubmed - Sherriff FE, Bridges LR, Sivaloganathan S. Early detection of axonal injury after human head trauma using immunocytochemistry for beta-amyloid precursor protein. Acta Neuropathol. 1994;87(1):55-62.
doi pubmed - Blumbergs PC, Scott G, Manavis J, Wainwright H, Simpson DA, McLean AJ. Topography of axonal injury as defined by amyloid precursor protein and the sector scoring method in mild and severe closed head injury. J Neurotrauma. 1995;12(4):565-572.
doi pubmed - Itoh T, Satou T, Nishida S, Tsubaki M, Hashimoto S, Ito H. Expression of amyloid precursor protein after rat traumatic brain injury. Neurol Res. 2009;31(1):103-109.
doi pubmed - Loers G, Aboul-Enein F, Bartsch U, Lassmann H, Schachner M. Comparison of myelin, axon, lipid, and immunopathology in the central nervous system of differentially myelin-compromised mutant mice: a morphological and biochemical study. Mol Cell Neurosci. 2004;27(2):175-189.
doi pubmed - Van den Heuvel C, Blumbergs PC, Finnie JW, Manavis J, Jones NR, Reilly PL, Pereira RA. Upregulation of amyloid precursor protein messenger RNA in response to traumatic brain injury: an ovine head impact model. Exp Neurol. 1999;159(2):441-450.
doi pubmed - Fischer AH, Jacobson KA, Rose J, Zeller R. Cutting sections of paraffin-embedded tissues. CSH Protoc. 2008;2008:pdb prot4987.
- Wilson MH, Wise D, Davies G, Lockey D. Emergency burr holes: "How to do it". Scand J Trauma Resusc Emerg Med. 2012;20:24.
doi pubmed - Hodeige D, de Pauw M, Eechaute W, Weyne J, Heyndrickx GR. On the validity of blood flow measurement using colored microspheres. Am J Physiol. 1999;276(4 Pt 2):H1150-1158.
pubmed - Schenarts PJ, Bone HG, Traber LD, Traber DL. Effect of severe smoke inhalation injury on systemic microvascular blood flow in sheep. Shock. 1996;6(3):201-205.
doi pubmed - Maybauer DM, Maybauer MO, Traber LD, Westphal M, Nakano YY, Enkhbaatar P, Morita N, et al. Effects of severe smoke inhalation injury and septic shock on global hemodynamics and microvascular blood flow in sheep. Shock. 2006;26(5):489-495.
doi pubmed - Prinzen FW, Bassingthwaighte JB. Blood flow distributions by microsphere deposition methods. Cardiovasc Res. 2000;45(1):13-21.
doi - Hakkinen JP, Miller MW, Smith AH, Knight DR. Measurement of organ blood flow with coloured microspheres in the rat. Cardiovasc Res. 1995;29(1):74-79.
doi
This is an open-access article distributed under the terms of the Creative Commons Attribution License, which permits unrestricted use, distribution, and reproduction in any medium, provided the original work is properly cited.
Journal of Neurology Research is published by Elmer Press Inc.